Latest U.S. Census Bureau Data: Around 550K domestic migrants moved to Texas in 2024, while 480K left for other states. Texas saw the largest net inflows of migrants from California, New York, and New Jersey and net outflows to Oklahoma, Tennessee, and Colorado.
09.02.2026 15:30 — 👍 0 🔁 1 💬 0 📌 0

Between 2024–2025, Texas added about 1,072 residents per day, down from 1,500–1,600 in 2021–2024. Reduced international and domestic migration drove the decline, while natural increase made up 40% of growth, up from about 25% since 2020.
02.02.2026 14:34 — 👍 0 🔁 0 💬 0 📌 0

New Census Bureau data shows Texas’ population reached 31.7 million in July 2025 — a 1.2% increase from 2024 to 2025, more than 2X the 0.5% national growth rate. Though growth slowed compared to recent years, TX still led the nation in numeric gains, adding over 391K residents.
28.01.2026 14:34 — 👍 0 🔁 1 💬 0 📌 0

The poverty rate in Texas has declined, reflecting a mix of economic, demographic, and policy factors. Children and working-age adults experienced notable declines in poverty. Yet, the uptick among older Texans is concerning, particularly with the state’s growing 65+ population.
15.01.2026 18:17 — 👍 0 🔁 0 💬 0 📌 0

Texans are spending more time getting to work. From 2014-2024, the share of workers with commutes under 25 minutes declined, while longer trips became more common across the state. Addressing commuting times can improve the economy and the quality of life for Texans everywhere.
15.01.2026 18:17 — 👍 0 🔁 1 💬 0 📌 0

All states have experienced shrinking college enrollment, except for Alabama, Idaho, TX, and Utah. This trend, described as the “demographic cliff”, is driven by lower birth rates. Migration, birth rates, and the economy will determine higher education enrollment in the future.
15.12.2025 14:42 — 👍 0 🔁 1 💬 0 📌 0

HOA and condominium fees are an added expense for some Texas homeowners. In 2024, 34% of Texas homeowners paid HOA or condo fees, with a median fee of $76/month statewide. Fees vary across the state, making them an important factor to consider when buying a home in Texas.
08.12.2025 15:41 — 👍 0 🔁 0 💬 0 📌 0

This month, we celebrate the legacy, diversity and richness of the American Indian and Alaska Native peoples in Texas. Their diverse cultures, stewardship of the environment, and commitment to community remind us of the importance of honoring heritage.
24.11.2025 19:13 — 👍 0 🔁 0 💬 0 📌 0

Texas had a median age of 35.6 in 2020, younger than the nation. By 2060, it is projected to rise to 43.0–44.2. Under the higher migration scenario, the median age trends lower since migrants to Texas are, on average, younger.
17.11.2025 19:04 — 👍 1 🔁 0 💬 0 📌 0


From 2014 to 2024, the U.S. veteran share of the total population fell from 6.0% to 4.6%; Texas saw a similar drop from 5.6% to 4.5%. Yet in 2024, Texas topped the nation with 1.42M veterans. We honor their service and are proud to be home to the largest veteran population.
10.11.2025 15:02 — 👍 0 🔁 0 💬 0 📌 0
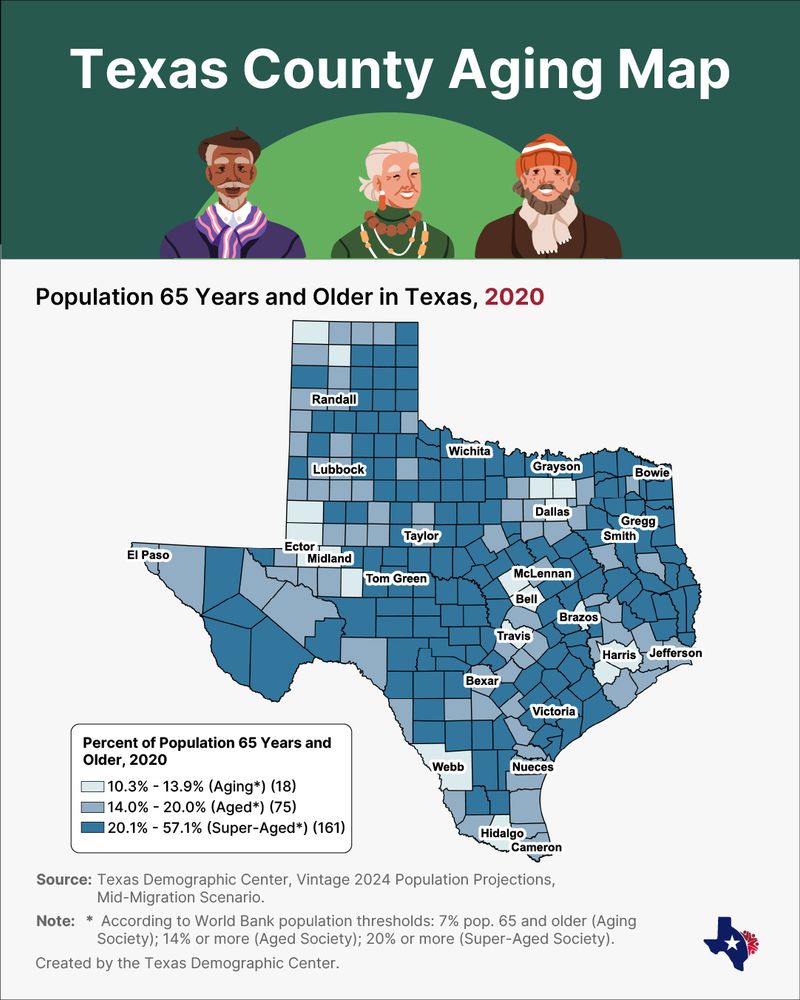

Texas is young but aging—13.5% of its population was 65+ in 2020, but by 2060, that’ll jump to 21.7%, making it “super-aged.” Counties in the TX Triangle and Permian Basin are among the youngest, but nearly all TX counties will be super-aged, with more than 20% of population 65+.
04.11.2025 14:59 — 👍 0 🔁 0 💬 0 📌 0


Our Vintage 2024 population projections show continued growth in major metro areas, while rural and selected border counties experience moderate growth or declining population. With migration as a major driver, TDC will monitor and highlight these patterns in future projections.
27.10.2025 13:25 — 👍 0 🔁 1 💬 0 📌 0

New TDC Vintage 2024 projections show Texas will continue to age in the next few decades. The 65+ group will grow fastest. Growth among those under18 will slow and begin to decline. The working-age population will grow and maintain a stable share of the total population.
20.10.2025 14:13 — 👍 1 🔁 1 💬 0 📌 0

Texas’ Hispanic population reached 12.8 M in 2024 and nearly 80% are of Mexican origin. Hispanics have contributed to the state’s economic growth, and their stories strengthen our shared future with cultural connections, traditions and innovation.
13.10.2025 14:33 — 👍 0 🔁 0 💬 0 📌 0

The Texas Demographic Center just released updated county-level population projections (2020–2060) by age, sex & race/ethnicity under multiple migration scenarios. Join our webinar on Oct 22 to learn about the methodology & more. 👉 bit.ly/4oXJHTW
30.09.2025 14:52 — 👍 0 🔁 1 💬 0 📌 0

The proportion of the Texas Hispanic population aged 25 years or older with an Associate’s Degree or higher grew throughout the last decade, from 18.3% in 2014 to 26.7% in 2024. In 2024, higher education enrollment for Hispanic students totaled over 760,000.
22.09.2025 17:08 — 👍 0 🔁 0 💬 0 📌 0

From 2014 to 2024, Texas saw its school-age population (ages 5–17) grow from 5.2M to 5.7M. While private school enrollment and homeschooling rose from 7.1% to 9.9%, public schools still serve the majority of Texas students.
15.09.2025 13:34 — 👍 0 🔁 0 💬 0 📌 0

Dependency ratios measure the size of the dependent population (children and seniors) relative to the working age. The state dependency ratio increased from 2010 to 2024, a change driven by the faster growth of the older age population compared to the working age population.
25.08.2025 13:32 — 👍 0 🔁 0 💬 0 📌 0

Individual proprietorships make up a majority (97.5%) of nonemployers in TX. Couriers and messengers had the largest increase since 2018, likely due to higher demand for delivery services since COVID-19. The top 5 gig industries in TX contributed $9.8 billion in revenue in 2023.
18.08.2025 14:25 — 👍 0 🔁 0 💬 0 📌 0

Dependency ratios compare the size of the dependent population (ages 0-14 & 65+) to the working population (ages 15-64). In 2024, Texas had a dependency ratio of 51.6, meaning 51.6 dependents for every 100 workers. Ratios vary statewide, with the largest in counties west of I-35.
11.08.2025 13:51 — 👍 1 🔁 0 💬 0 📌 0

August 8 is Digital Nomad Day, celebrating remote workers. In Texas, the percentage of people working from home almost tripled from 5.7% in 2019 (pre-pandemic) to 16.3% in 2021 (pandemic) and dropped to 13.7% in 2023 (post-pandemic) as people began returning to work onsite.
04.08.2025 14:15 — 👍 1 🔁 0 💬 0 📌 0

The Digital Divide Persists. While 99.1% of high-income households have internet access, only 88.1% of low-income households are connected. This gap, though seemingly small, highlights the continuing challenges lower-income households face in accessing internet services.
28.07.2025 13:40 — 👍 1 🔁 0 💬 0 📌 0

In Texas during the past two decades (2004-2024), the share of younger age groups (0–24) declined considerably, while that of middle-aged groups (30–44) kept relatively stable. The population is aging overall, as evidenced by the rise in older age groups (55+).
21.07.2025 18:10 — 👍 1 🔁 0 💬 0 📌 0

The median earnings of Texans with disabilities match their national peers through employment wages, whereas earnings for those without disabilities fell below the US in 2023. For Disability Pride Month, we honor the talent and contributions of the disability community in TX.
14.07.2025 17:35 — 👍 1 🔁 0 💬 0 📌 0

The world population hit 8.12 billion in 2025, up from 6.13 billion in 2000. It's projected to reach 10.23 billion by 2060. If Texas were a country, it would rank 53rd with 31.67 million people, a density of 46.8 per square kilometer, and a median age of 35.8.
07.07.2025 14:21 — 👍 1 🔁 0 💬 0 📌 0

The median household income has not kept up with the cost of housing in TX. Population growth, rising costs for building materials, and labor shortages have affected the supply of homes and increased their cost, making it difficult for many Texans to purchase and own a home.
23.06.2025 14:02 — 👍 4 🔁 0 💬 0 📌 0