
428.44 ppm #CO2 in OUR PLANET'S AIR on Mar. 8 2025
📈 Up 2.34 ppm from 426.10 a year ago 📈
🌎 @NOAA Mauna Loa data: buff.ly/WzraZfS 🌎
🌎 Brought to you by CO2.Earth at buff.ly/GZJ8mbe 🌎
🙏 Let's keep this 350 overshoot brief 🙏
@co2earth.bsky.social
The latest measurements of the most important GHG in the Earth’s air--3400 metres above sea level near the top of the Earth's largest mountain & the middle of its largest ocean. Posts by Michael McGee, b. 318 ppm, creator of CO2.Earth.
428.44 ppm #CO2 in OUR PLANET'S AIR on Mar. 8 2025
📈 Up 2.34 ppm from 426.10 a year ago 📈
🌎 @NOAA Mauna Loa data: buff.ly/WzraZfS 🌎
🌎 Brought to you by CO2.Earth at buff.ly/GZJ8mbe 🌎
🙏 Let's keep this 350 overshoot brief 🙏


🏆📈🏆 FIRST TIME #CO2 SURPASSES 430 🏆📈🏆 430.60 ppm is the HIGHEST EVER CO2 in Earth’s atmosphere as of March 7, 2025 🏆 Up 5.24 ppm from 425.36 ppm a year ago 🏆 #NOAA Mauna Loa Obervatory data & graphic: gml.noaa.gov/ccgg/trends/... 🏆 Daily CO2.Earth records at: www.co2.earth/co2-records
09.03.2025 05:44 — 👍 39 🔁 19 💬 2 📌 14
428.49 parts per million (ppm) CO2 in air 07-Mar-2025 keelingcurve.ucsd.edu
08.03.2025 18:58 — 👍 22 🔁 12 💬 0 📌 3Our Ralph Keeling explains to @deutschewelle.bsky.social how CO2 measurements got started and why they are important in the new podcast 'What does 1 ton of CO2 look like' now available on the Living Planet #podcast. pod.link/livingplanet...
07.03.2025 22:51 — 👍 21 🔁 9 💬 1 📌 0427.16 parts per million (ppm) CO2 in air 06-Mar-2025 keelingcurve.ucsd.edu
07.03.2025 17:22 — 👍 9 🔁 7 💬 0 📌 0If you're in Austin, come visit!
06.03.2025 17:29 — 👍 5 🔁 3 💬 0 📌 0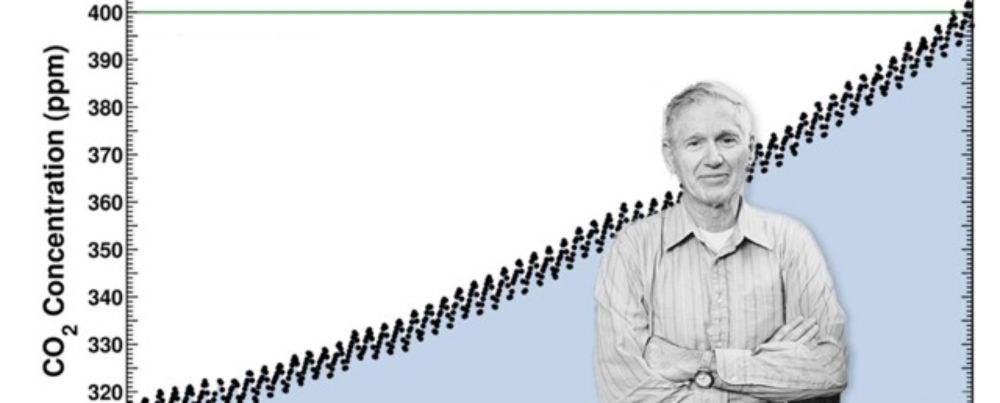
427.43 parts per million (ppm) CO2 in air 05-Mar-2025 keelingcurve.ucsd.edu
06.03.2025 17:20 — 👍 13 🔁 6 💬 0 📌 0
427.38 parts per million (ppm) CO2 in air 03-Mar-2025
keelingcurve.ucsd.edu
426.97 parts per million (ppm) CO2 in air 02-Mar-2025 keelingcurve.ucsd.edu
03.03.2025 17:12 — 👍 19 🔁 1 💬 0 📌 0
426.64 parts per million (ppm) CO2 in air 01-Mar-2025
keelingcurve.ucsd.edu

Kudos to Bill McKibben for this piece on the story behind one of the icons of @scrippsocean.bsky.social science. www.newyorker.com/news/the-led...
02.03.2025 17:38 — 👍 48 🔁 21 💬 2 📌 1
426.41 ppm #CO2 in OUR PLANET'S AIR on Jan. 5 2025
📈 Up 3.80 ppm from 422.61 a year ago 📈
🌎 NOAA Mauna Loa data: gml.noaa.gov/ccgg/trends/... 🌎
🌎 Brought to you by CO2.Earth at www.co2.earth/daily-co2 🌎
🙏 Let's keep this 350 overshoot brief 🙏
425.87 parts per million (ppm) CO2 in air 05-Jan-2025 keelingcurve.ucsd.edu
06.01.2025 17:06 — 👍 11 🔁 5 💬 0 📌 1
425.87 parts per million (ppm) CO2 in air 04-Jan-2025 keelingcurve.ucsd.edu
05.01.2025 21:33 — 👍 7 🔁 2 💬 0 📌 0Acceleration in the Keeling Curve is the long term constant. The current numbers and past trend say loud & clear that we're still pushing the environment into unsustainable territory for people & other species. That may sound doomy, but the point is: Take note and accelerate the solutions we have.
05.01.2025 19:15 — 👍 1 🔁 0 💬 1 📌 0
426.03 ppm #CO2 in OUR PLANET'S AIR on Jan. 4 2025
📈 Up 3.66 ppm from 422.37 a year ago 📈
🌎 NOAA Mauna Loa data: gml.noaa.gov/ccgg/trends/... 🌎
🌎 Brought to you by CO2.Earth at www.co2.earth/daily-co2 🌎
🙏 Let's keep this 350 overshoot brief 🙏

426.13 ppm #CO2 in OUR PLANET'S AIR on Jan. 3 2025
📈 Up 3.76 ppm from 422.37 a year ago 📈
🌎 NOAA Mauna Loa data: gml.noaa.gov/ccgg/trends/... 🌎
🌎 Brought to you by CO2.Earth at www.co2.earth/daily-co2 🌎
🙏 Let's keep this 350 overshoot brief 🙏
426.16 parts per million (ppm) CO2 in air 02-Jan-2025 keelingcurve.UCSD.edu
03.01.2025 21:01 — 👍 10 🔁 9 💬 0 📌 0
425.78 parts per million (ppm) CO2 in air 03-Jan-2025 keelingcurve.ucsd.edu
04.01.2025 17:33 — 👍 6 🔁 3 💬 0 📌 0
427.16 ppm #CO2 in OUR PLANET'S AIR on Dec. 31 2024
📈 Up 4.83 ppm from 422.33 a year ago 📈
🌎 NOAA Mauna Loa data: gml.noaa.gov/ccgg/trends/... 🌎
🌎 Brought to you by CO2.Earth at www.co2.earth/daily-co2 🌎
🙏 Let's keep this 350 overshoot brief 🙏
425.74 parts per million (ppm) CO2 in air 30-Dec-2024 keelingcurve.ucsd.edu
31.12.2024 20:13 — 👍 10 🔁 4 💬 0 📌 1Readings for the past several days have been unavailable because of a problem with a server. Technicians are troubleshooting the issue now and we hope to resume reporting of daily readings as soon as possible.
30.12.2024 19:42 — 👍 7 🔁 2 💬 0 📌 0
🌎 425.59 ppm #CO2 in the planet's air in the last week of 2024 🌎
📈 Up from 421.75 for the week one year ago📈
🔗 NOAA Mauna Loa weekly data: gml.noaa.gov/ccgg/trends/... 🔗
🔄 CO2.Earth distribution: www.co2.earth/weekly-co2 & www.show.earth/the-weekly-co2-tracker-for-web 🔄

425.33 ppm #CO2 in OUR PLANET'S AIR on Dec. 29 2024
📈 Up 3.88 ppm from 421.55 a year ago 📈
🌎 NOAA Mauna Loa data: gml.noaa.gov/ccgg/trends/... 🌎
🌎 Brought to you by CO2.Earth at www.co2.earth/daily-co2 🌎
🙏 Let's keep this 350 overshoot brief 🙏
425.23 parts per million (ppm) CO2 in air 24-Dec-2024 keelingcurve.ucsd.edu
25.12.2024 21:13 — 👍 11 🔁 7 💬 0 📌 0
425.21 parts per million (ppm) CO2 in air 23-Dec-2024 keelingcurve.ucsd.edu
24.12.2024 17:08 — 👍 7 🔁 4 💬 0 📌 0
425.48 parts per million (ppm) CO2 in air 22-Dec-2024 keelingcurve.ucsd.edu
23.12.2024 17:43 — 👍 13 🔁 5 💬 0 📌 0
425.53 parts per million (ppm) CO2 in air 21-Dec-2024 keelingcurve.ucsd.edu
22.12.2024 17:37 — 👍 5 🔁 4 💬 0 📌 0
Baseline reading not available, data too variable 20-Dec-2024 keelingcurve.ucsd.edu
21.12.2024 17:11 — 👍 5 🔁 1 💬 0 📌 0
Baseline reading not available, data too variable 19-Dec-2024 keelingcurve.ucsd.edu
20.12.2024 17:12 — 👍 2 🔁 1 💬 0 📌 0