I've turned my intro to R workshop into a free open-access book: The R Workshop 🌟 Perfect for R beginners, with more chapters coming soon! Check it out: www.r-workshop.org
Prefer live instruction? Join my 2-day virtual workshop Jan 15-16 via Instats. Details: instats.org/seminar/intr...
#rstats
06.01.2025 17:51 —
👍 50
🔁 11
💬 3
📌 3

Python for R Users - On-Demand
This Instats seminar on Python for R Users taught by Rebecca Barter will help you take your research to the next level. Sign up today!
In case you missed my "Python for R Users" seminar last month, registration for the recorded on-demand version is now open for you to explore at your own pace 🚀
Info and registration: instats.org/seminar/pyth...
05.12.2024 17:04 —
👍 3
🔁 1
💬 1
📌 0
Agreed! View() is super helpful for this too.
I just like the convenience of everything printing in the console rather than opening up another window, so I tend to use the print() trick more often than the View() trick myself
02.12.2024 18:01 —
👍 2
🔁 0
💬 0
📌 0

Printing a data frame (tibble) in the R console, where 3 columns are hidden

The output of df |> print(width = Inf) which prints all columns of a data frame (tibble) in the R console
I don't know who needs to hear this, but if you want to look at all columns of a tibble (which has the somewhat annoying habit of only showing you as many columns as you have space for), just pipe it into print(width = Inf):
df |> print(width = Inf)
#rstats
02.12.2024 17:38 —
👍 70
🔁 13
💬 4
📌 1

Python for R Users - Live-streaming:
This Instats seminar on Python for R Users taught by Rebecca Barter will help you take your research to the next level. Sign up today!
Only one week to go until my full-day "Python for R Users" workshop!
This workshop is designed for R users interested in learning Python and expanding their coding toolkit. Join me to learn Python from an R-friendly perspective!
Click here to register: instats.org/seminar/pyth...
07.11.2024 17:37 —
👍 0
🔁 0
💬 0
📌 0
If you're teaching R, or statistics, and you want your students to get more practice of data wrangling with "messy" data, you can use the {messy} package to turn the clean data you currently use for examples into more realistic looking data!
#RStats #StatsEd
05.11.2024 15:34 —
👍 154
🔁 49
💬 8
📌 9
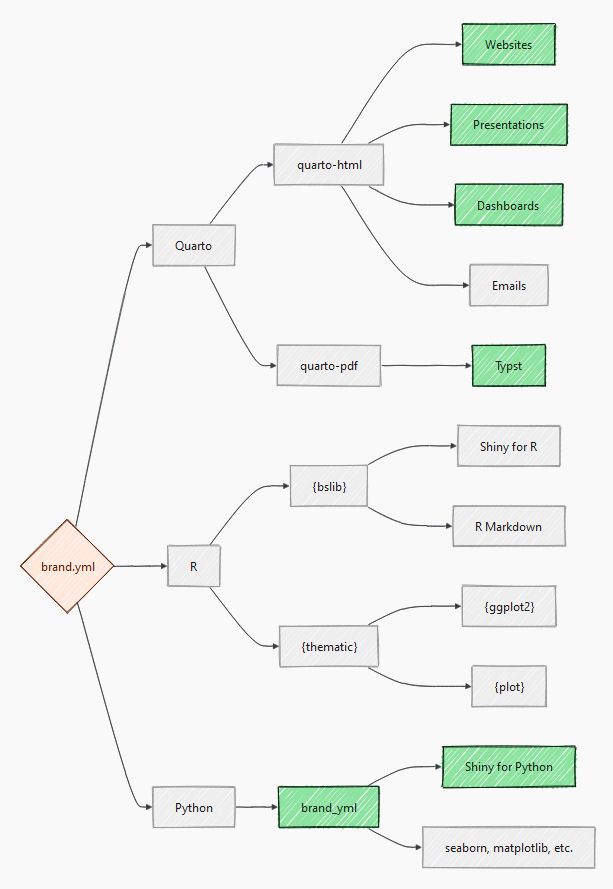
Making things "pretty" has never been where I find the most joy in data work. So, I'm super excited about @posit.co 's {brand.yml} framework for adding unified styling across Quarto, Shiny, and more at minimal effort 🤩
posit-dev.github.io/brand-yml/
Site also featuring best at-a-glance roadmap
31.10.2024 13:25 —
👍 85
🔁 18
💬 4
📌 1
Am I bad at R if I don't even understand the question?
31.10.2024 16:43 —
👍 4
🔁 0
💬 1
📌 0
A few things I've been working on lately:
elmer, elmer.tidyverse.org, is a new package to make it easier to work with LLMs (hosted and local) from #rstats. It includes helps for structured data extraction and tool calling, and an easy way to upload a plot. Joint work with Joe Cheng.
29.10.2024 22:13 —
👍 229
🔁 55
💬 10
📌 5
This is awesome!
30.10.2024 15:16 —
👍 1
🔁 0
💬 0
📌 0
Some news: I've just open-sourced the draft of a book I'm working on about how #rstats tidymodels users can make their code run faster without sacrificing predictive performance!
www.simonpcouch.com/blog/2024-10...
29.10.2024 15:43 —
👍 188
🔁 41
💬 13
📌 2
I've heard of them
29.10.2024 14:34 —
👍 1
🔁 0
💬 0
📌 0
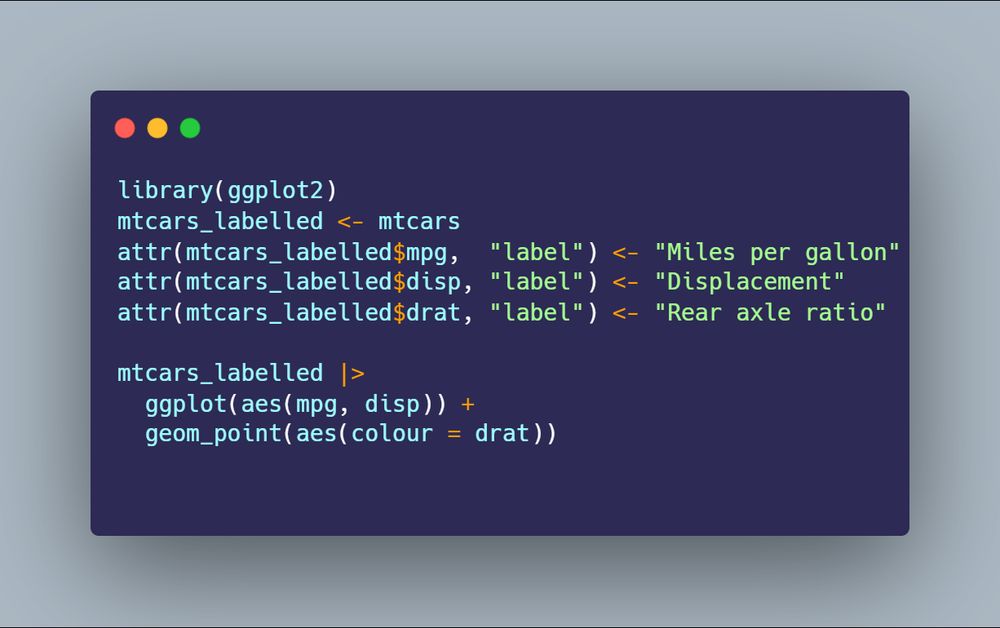
library(ggplot2)
mtcars_labelled <- mtcars
attr(mtcars_labelled$mpg, "label") <- "Miles per gallon"
attr(mtcars_labelled$disp, "label") <- "Displacement"
attr(mtcars_labelled$drat, "label") <- "Rear axle ratio"
mtcars_labelled |>
ggplot(aes(mpg, disp)) +
geom_point(aes(colour = drat))
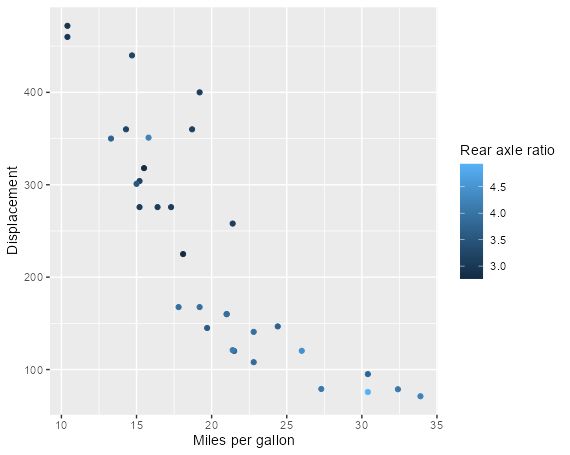
ggplot figure showing "Miles per gallon" on x-axis, "Displacement" on y-axis, and "Rear axle ratio" on legend.
y'all probably know i ❤️labelled data. the dev version of {ggplot2} has a new feature that automatically applies variable labels when plotting 😍✨ thank you @teunbrand.bsky.social!!! 🙏 #rstats
29.10.2024 12:59 —
👍 127
🔁 31
💬 10
📌 2
I always figured it was just a shortening "for categoricals", I never realised it was an anagram!
28.10.2024 15:58 —
👍 0
🔁 0
💬 1
📌 0
Check out the new `pastum` extension for Positron (and VS Code I guess)—it's {datapasta} for Positron! It works with both R (base R, tibble, and data.frame) and Python (pandas and polars) github.com/atsyplenkov/... #rstats #python
28.10.2024 15:18 —
👍 112
🔁 19
💬 4
📌 1
Hello world 👋
(This is how you're supposed to start with any new programming language/social media platform, right?)
28.10.2024 15:22 —
👍 6
🔁 0
💬 1
📌 0


