Great to see our paper presenting recall, a framework which calibrates clustering for the impact of data "double-dipping" in single-cell studies, out today in AJHG! Congratulations, @alandenadel.bsky.social and co-authors!
12.03.2025 19:18 — 👍 9 🔁 3 💬 1 📌 0
Thank you to all my collaborators for their contributions and thoughtful feedback.
Madeline Hughes
Akshaya Thoutam
@anaygupta.bsky.social
Andrew Navia
@nfusi.bsky.social
Srivatsan Raghavan
Peter Winter
@avapamini.bsky.social
@lcrawford.bsky.social
I welcome any comments!
18.12.2024 18:48 — 👍 0 🔁 0 💬 1 📌 0
Our results highlight the need for a more nuanced approach, balancing dataset size and diversity with careful attention to model architectures and model benchmarking.
18.12.2024 18:48 — 👍 0 🔁 0 💬 1 📌 0
Our findings underscore the importance of prioritizing data quality and content over sheer size. Developers of scFMs and large databases should consider this rather than simply scaling up models and databases, which we have shown is unlikely to meaningfully improve performance.
18.12.2024 18:48 — 👍 0 🔁 0 💬 1 📌 0
While neural scaling laws observed in other domains suggest that increasing dataset size leads to better performance, our findings show that, past a learning saturation point, simply increasing pre-training datasets doesn't necessarily improve performance on downstream tasks.
18.12.2024 18:48 — 👍 0 🔁 0 💬 1 📌 0
These results suggest that further scaling up of pre-training datasets from tens of millions of cells to hundreds of millions or even billions of cells without appropriately modeling the non-sequential nature of single-cell data may not yield tangible returns.
18.12.2024 18:48 — 👍 0 🔁 0 💬 1 📌 0
Our work addresses a critical consideration in training large-scale models: the size and diversity of the pre-training corpus.
18.12.2024 18:48 — 👍 0 🔁 0 💬 1 📌 0

(B) Heatmap visualizing the learning saturation point for the clonal hematopoiesis, intestine-on-chip, periodontitis, and placental infection datasets for each of scVI, SSL, and Geneformer, across each downsampling strategy and when evaluated in the zero-shot regime. Each sub-panel corresponds to the model architecture, the x-axis corresponds to the dataset evaluated, and the y-axis corresponds to the downsampling strategy used to pre-train each model.
(C) Heatmap visualizing the learning saturation point for the clonal hematopoiesis, intestine-on-chip, periodontitis, and placental infection datasets for each of scVI, SSL, and Geneformer, across each downsampling strategy and when evaluated in the fine-tuning regime. Each sub-panel corresponds to the model architecture, the x-axis corresponds to the dataset evaluated, and the y-axis corresponds to the downsampling strategy used to pre-train each model.
The learning saturation points were always 25% or less when evaluating the models on zero-shot classification and were always 10% or less when evaluating the models on fine-tuned classification. We also observed similar results for zero-shot batch integration.
18.12.2024 18:48 — 👍 0 🔁 0 💬 1 📌 0

Schematic of analysis to find the learning saturation point. For each family of models (i.e., a downsampling strategy paired with a model) a "saturation threshold" of 95% of the maximum performance was computed, and the minimum pre-training dataset size that produced a model surpassing that threshold was identified. This dataset size was denoted the "learning saturation point" and is considered the point at which model performance saturated as a function of pre-training dataset size.
To assess the extent to which this plateauing generalized across datasets and tasks, we identified the "learning saturation point" for each model. This is the minimum pre-training dataset size for which a model surpassed 95% of the maximum performance observed.
18.12.2024 18:48 — 👍 0 🔁 0 💬 1 📌 0

Figure 2. Zero-shot and fine-tuned performance on classifying cells from a clonal hematopoiesis dataset plateaus at a small fraction of the total data available for pre-training.
(A) Line plots showing zero-shot classification performance for each model’s embeddings, as evaluated by the micro F1 Score. For each model, the different colors correspond to the downsampling strategy used to generate the data used for pre-training. The dotted line shows the performance of using the highly variable genes as an embedding; the dashed line shows the performance of using principal component projections as an embedding.
(B) Line plots showing classification performance for each model after fine-tuning, as evaluated by the micro F1 Score. For each model, the different colors correspond to the downsampling strategy used to generate the data used for pre-training. The dotted line shows the performance of training a regularized logistic regression classifier using the highly variable genes as input features.
Model performance at cell type classification (both zero-shot and fine-tuned) tended to plateau at a small fraction of the total pre-training dataset size on a clonal hematopoiesis evaluation dataset, regardless of pre-training dataset diversity.
18.12.2024 18:48 — 👍 0 🔁 0 💬 1 📌 0

Supplemental Figure 1. Diversity of datasets used for pre-training as evaluated by intrinsic and extrinsic metrics. The Shannon index, Gini-Simpson index, and Vendi Score are shown for each of the downsampled pre-training datasets. Cell type re-weighting and geometric sketching have increased diversity relative to the randomly downsampled datasets. Cell type re-weighting (which re-weights based on cell type metadata) has the highest Shannon index and Gini-Simpson index (which both measure the diversity of cell type metadata). Geometric sketching (which samples evenly across transcriptional space) has the highest Vendi Score (which measures the diversity of the transcriptional data directly).
The three downsampling schemes were: (1) random downsampling (2) cell type re-weighting and (3) geometric sketching. (1) conserves diversity, while (2) and (3) increase diversity (relative to the full corpus). Datasets were generated at 1%, 10%, 25%, 50%, and 75% of the total.
18.12.2024 18:48 — 👍 0 🔁 0 💬 1 📌 0
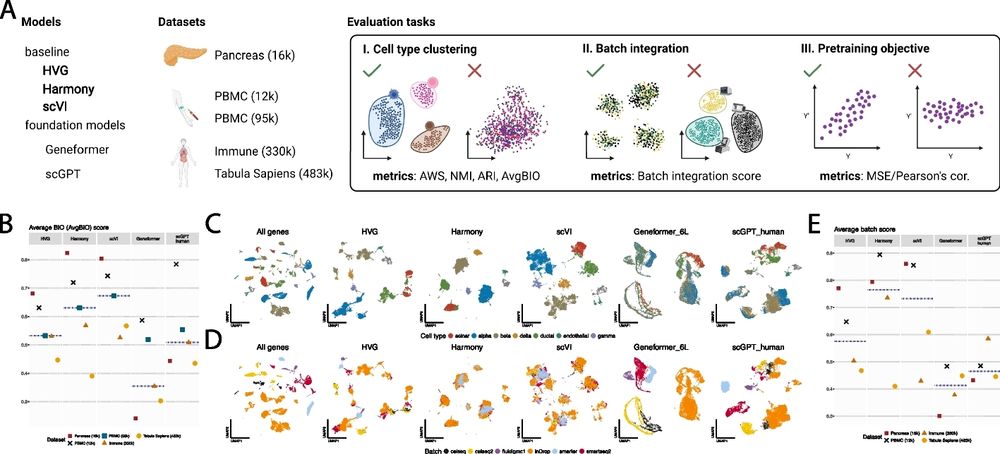
We assessed three model architectures pre-trained to perform as single-cell foundation models (scFMs) in the context of single-cell RNA-seq: scVI, SSL, and Geneformer. We pre-trained these models on subsets of the scTab corpus using three different downsampling schemes.
18.12.2024 18:48 — 👍 0 🔁 0 💬 1 📌 0

Figure 1. Strategy to assess the effects of pre-training dataset size and diversity on scFM performance. (A) Schematic of the downsampling approaches, sizes of downsampled pre-training datasets, and data splitting strategy. (B) An example of what evaluation performance might a priori be expected to look like as a function of pre-training dataset size and diversity.
Current methods in the field are trained on atlases ranging from 1 to 100 million cells. In our newest preprint, we show that these same approaches tend to plateau in performance with pre-training datasets that are only a fraction of the size.
18.12.2024 18:48 — 👍 5 🔁 0 💬 1 📌 2
Your complete source for all the life science news and events in the Seattle area. Brought to you by the Science in the City program @stemcell.com.
Understanding life. Advancing health.
Oncologist-scientist at Weill Cornell and New York genome center. Into somatic evolution, trees and words
Computational immunologist. Interested in immunooncology, cytometry, single cell data, spatial data, T and B cell specificities...
Professor, Molecular & Cellular Biology, Harvard University
Moonlighting as a human population geneticists in the Huerta-Sánchez Lab at Brown University, and aspiring speciation geneticists.
Bioconductor: Free, open-source software for rigorous, reproducible biological data analysis with R. Join our diverse community of developers and data scientists.
https://bioconductor.org/
Core Investigator @ Arc Institute | Associate Professor @ UCSF | {Computational, Systems, Cancer, RNA} biologist | Co-founder @exaibio @vevo_ai
Genetics, bioinformatics, comp bio, statistics, data science, open source, open science!
Theoretical Physicist.
(She/her/hers)
From Eastern KY.
md-phd student harvard/mit in elise robinson and luke o'connor labs/ interested in statistical and functional genomics, developmental neuro, heist movies
Interested in ML, comp bio, immunology, and just about anything one hop away from either.
postdoctoral research fellow @brownCAAS. previously @brownclinpsych & @uri, researching harm reduction treatment approaches for underserved groups
Rare disease and cancer analysis models for sequencing data. Scientist at PacBio. Art school survivor. Views my own.
Learning the rules of life.
Assistant Professor of Medicine and Computer Science @ Yale
shendure lab |. krishna.gs.washington.edu
Regulatory genomics, machine learning, networks, systems biology, evolution
Associate Professor
DFCI & HMS
Scientist. Director of AI + Life Sciences and Professor of Public Health Sciences at Northeastern University. External Faculty at the Santa Fe Institute and Vermont Complex Systems Institute. scarpino.github.io
A scientific journal publishing cutting-edge methods, tools, analyses, resources, reviews, news and commentary, supporting life sciences research. Posts by the editors.