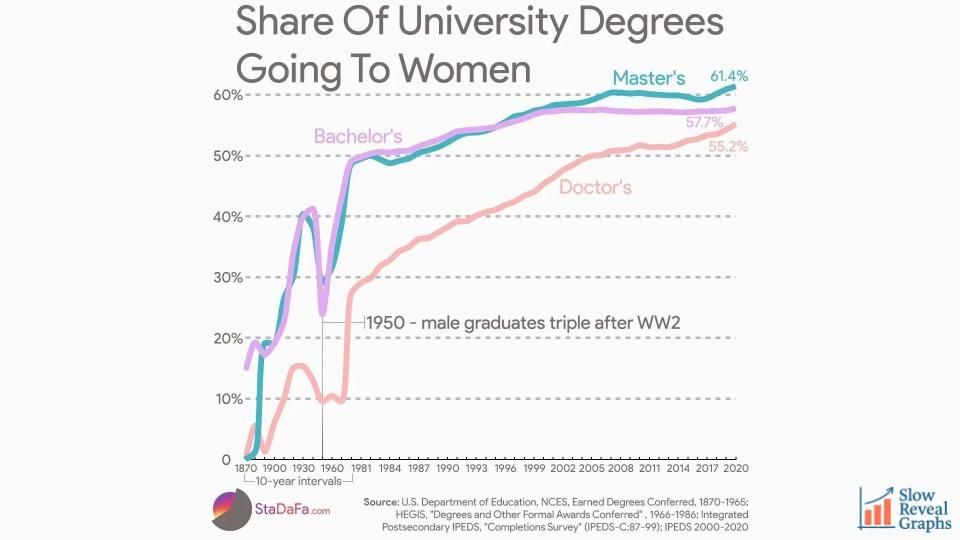
New #SlowRevealGraph
Share of US University Degrees Going To Women (1870 - 2020)
@jennalaib.bsky.social
K-8 Math Specialist, #EduSky (pronounced Lai-eeb) 📝jennalaib.com 📈slowrevealgraphs.com

New #SlowRevealGraph
Share of US University Degrees Going To Women (1870 - 2020)
Sorry to hear that. ❤️🩹 Best wishes for a better start to 25-26!
04.08.2025 02:08 — 👍 1 🔁 0 💬 0 📌 0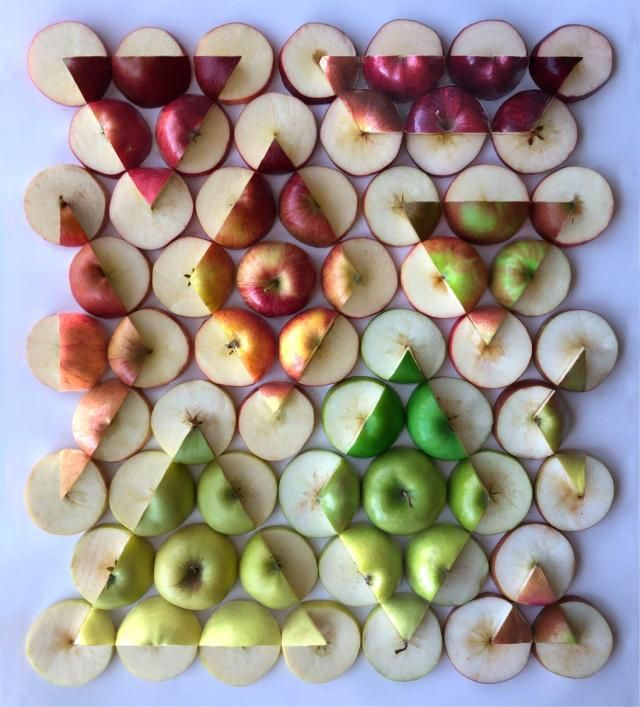
#mathart #fractionchat #howmany www.tumblr.com/mathhombre/7...
02.08.2025 22:24 — 👍 10 🔁 3 💬 0 📌 0
New #SlowRevealGraph Blog Post:
Digging Into Data Sources
A few years ago, I started citing not just the source of the graph, but the source of the data behind it. In this blog post, I explain why that's important, and how it can change our interpretation of the graph.
Updated this slide deck! (graph is updated to include that it's CPI-adjusted, and there are added graphs from the NOAA/NCEI website that provide additional nuance. Fascinating.
Thanks to @scottfarrar.bsky.social :)
Hahaha our posts crossed on the internet. But yes! It IS adjusted, and that is extra terrifying.
01.08.2025 17:13 — 👍 0 🔁 0 💬 0 📌 0Wait! Reading further on the NCEI/NOAA site, which I’m pretty certain is the original source of the data, I think it IS adjusted for inflation. I may have been hasty posting this one. (Usually I look up the original data first…) Updates coming soon!
01.08.2025 17:13 — 👍 0 🔁 0 💬 0 📌 0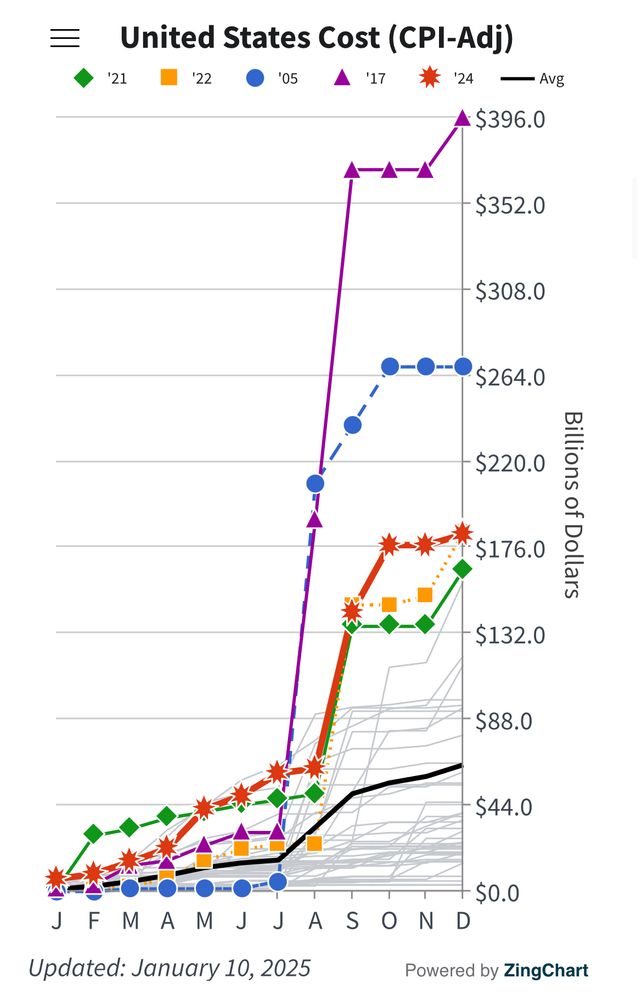
Check out this one! Different data from the NOAA. Hurricane season 😳
www.ncei.noaa.gov/access/billi...
My best guess is that it is not, which is why I threw up slide with the inflation rate for 1980. That said, I haven’t yet listed the Riede data from the NOAA. I’m tempted to make my own adjusted for inflation…
01.08.2025 17:06 — 👍 0 🔁 0 💬 2 📌 0Yes! Even without adjusting for inflation, it still feels worth of Dan Meyer’s #OMGraph hashtag.
01.08.2025 16:46 — 👍 1 🔁 0 💬 1 📌 0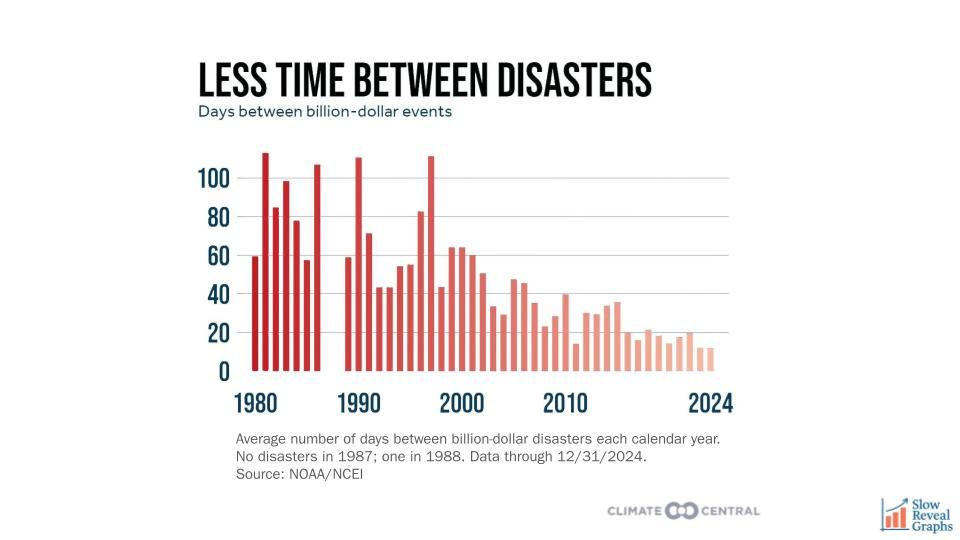
Days Between Billion-Dollar Natural Disasters in the US
Days Between Billion-Dollar Natural Disasters in the USgraph by Climate Central; slow reveal by Jenna Laib (Slide deck includes notes and questions to elicit discourse) Type of Graph: bar graph Visualization Source: Climate Central, “U.S.…

"Slow reveal" method of teaching graphs - [Image - Silhouette of extended hands in front of an out-of-focus screen of a bar graph. These hands aren't as creepy as in the image I posted yesterday]
21.07.2025 17:53 — 👍 5 🔁 1 💬 1 📌 0
[New Post] Ontario Math Links-My favourite #math related links from this week:
ontariomath.blogspot.com/2025/07/math...
Links & help from @jennalaib.bsky.social @howiehua.bsky.social @kurt-salisbury.bsky.social @dwekselgreene.bsky.social @theericklee.bsky.social & more
#MathChat #MTBoS #iTeachMath
I like building antiprisms! They require a lot of triangles, though.
Or maybe you’re going for more architecturally inspired creations…?
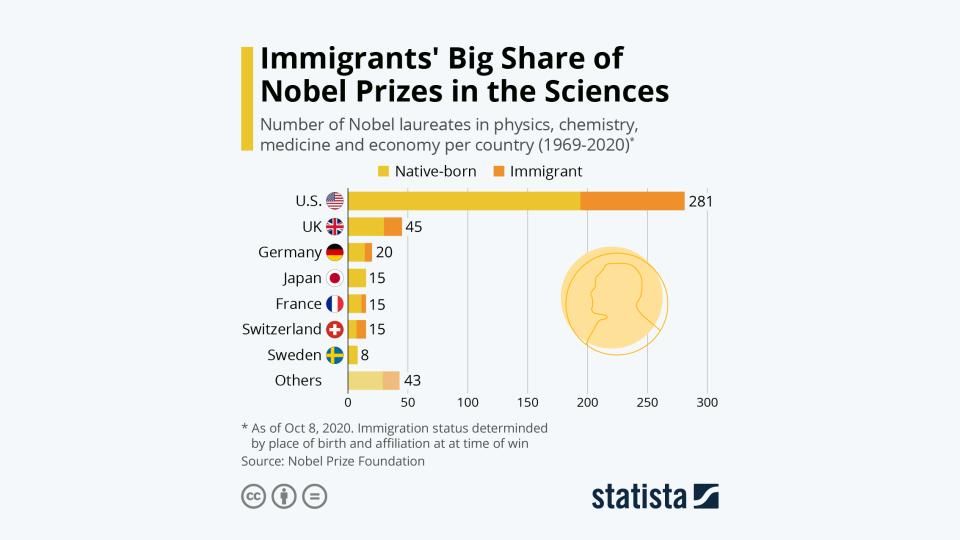
Immigrants’ Big Share of Nobel Prizes in the Sciences
Immigrants' Big Share of Nobel Prizes in the Sciencesgraph by Katharina Buchholz/Statista; slow reveal by Jenna Laib (Slide deck includes notes and questions to elicit discourse) Type of Graph: bar graph Visualization Source: Buchholz,…
Did the Dog vs People Names scatter plot today with a room full of k-12 computer science teachers, and WOW, the discussion we had! 🤓 #slowrevealgraphs
12.07.2025 03:08 — 👍 7 🔁 3 💬 0 📌 0Aww! Love that. I haven’t done this one with students yet, but maybe come September…
@normabgordon.bsky.social
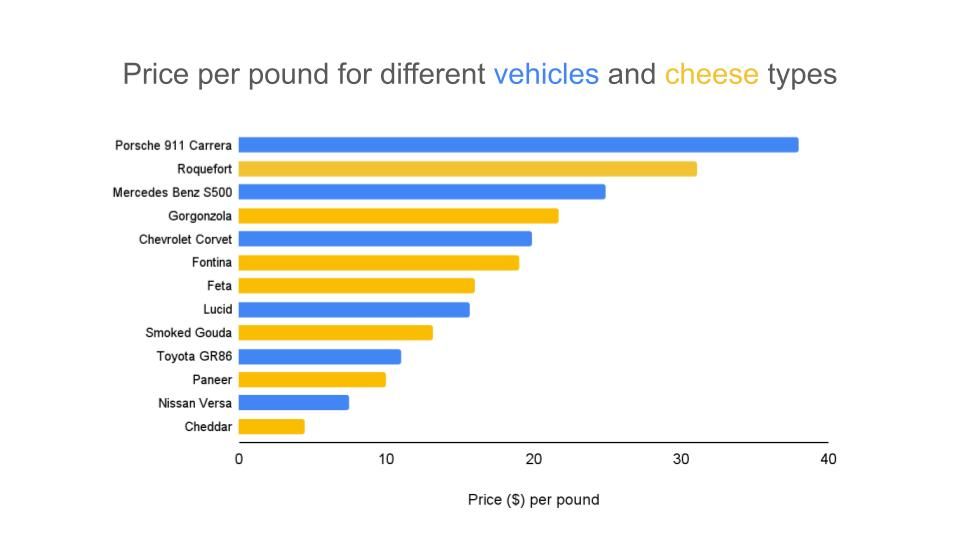
Cost per pound of vehicles compared with per pound of types of cheese
Cost (in USD $) per pound of Vehicles compared with per pound of Types of Cheesegraph by Andrew McCalip/Norma Gordon; slow reveal by Norma Gordon (Slide deck includes notes and questions to elicit discourse) Type of Graph: bar…
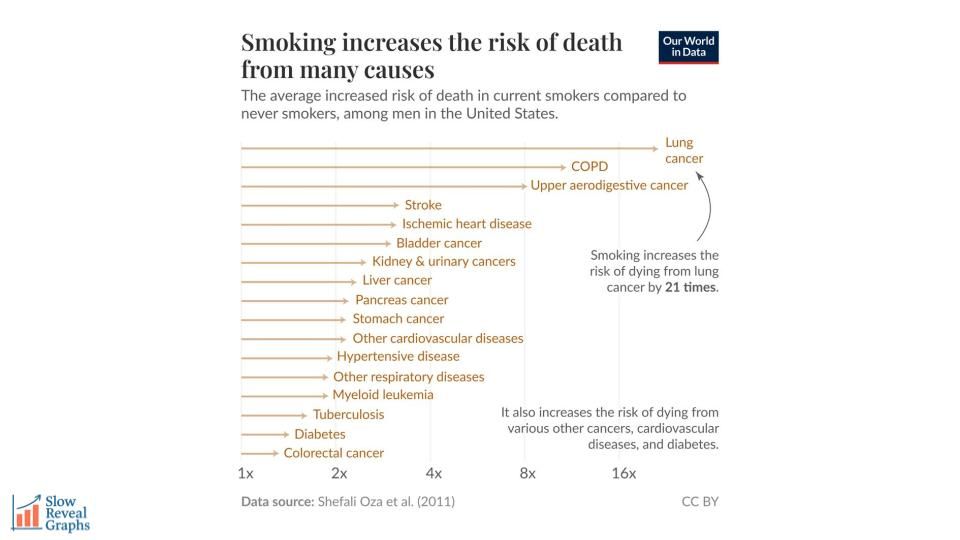
New #SlowRevealGraph
Smoking increases the risk of death for many causes
Which states have Americans visited?
Which states have American visited?graph by David H. Montgomery/YouGov; slow reveal by Jeremy Knight (Slide deck includes notes and questions to elicit discourse) Type of Graph: choropleth map, bar graph Visualization Source: Montgomery, David H. "Which states…
Oof, I had a Saturday morning slot in Chicago. You’ll be great, though! And I’m still around then.
See you there!
Noooo — will you be in Atlanta? I’ll be there, for NCTM only.
25.06.2025 00:35 — 👍 0 🔁 0 💬 1 📌 0October 30! 🤩
25.06.2025 00:32 — 👍 0 🔁 0 💬 1 📌 0What a beautiful meeting!! I love Annie.
25.06.2025 00:28 — 👍 3 🔁 0 💬 1 📌 0That sounds like a lot!
Sending love to you and your family. 💛
You can talk to an editor (Eg at Stenhouse/Routledge, Corwin, etc) and I think some will help you work on your formal proposal (if they’re invested in your idea). Go for it!
18.06.2025 22:35 — 👍 5 🔁 0 💬 0 📌 0The students wrote petitions, called local reps, and researched ways to create change about their topics.
And, naturally, many of them used graphs as part of their argument. I found myself taking lots of photos for #slowrevealgraph inspiration.
Attending the showcase was restorative. 2/🧵
Today, the 8th graders at my school shared their civics action projects in a beautiful showcase. Their topics varied greatly: climate change, immigration, artist compensation from streaming services, health and health issues, etc. 1/🧵
10.06.2025 22:59 — 👍 8 🔁 0 💬 1 📌 0Ooh! I only wish we could break it down into a two way table!
But I'm going to find a way to use this. It's great.
My parents took Sanskrit at a philosophy school when I was a little kid! Their class was more… communal chanting in a room rather than isolated translations.
The course sounds like it needed much more coherence but still: interesting!