
www.nj.com/weather/2026...
24.02.2026 23:06 — 👍 0 🔁 0 💬 1 📌 0
www.nj.com/weather/2026...
24.02.2026 23:06 — 👍 0 🔁 0 💬 1 📌 0
Join us tonight!
Mt. Washington's Science on the Mountain virtual series invited us to discuss how we communicate climate science, impacts, and solutions.
Find more info here: mountwashington.org/event/scienc...
@climatecentral.org

From Climate Central: Coffee-harming heat. Yearly days added by climate change, 2021 - 2025.
☕Climate change is coming for our coffee.
New analysis from #ClimateCentral shows that climate change has added more coffee-harming heat to the world’s coffee-growing regions during 2021-2025, potentially affecting the quality and quantity of recent harvests.

Hmmmm...this is what's showing on their site right now:
22.02.2026 14:42 — 👍 0 🔁 0 💬 0 📌 0
There’s still time to apply for @Metcalf's Science Immersion Workshop for Journalists: Pollution, Plastics, and PFAS
It's a funded week-long fellowship, June 21-26, 2026) .
Deadline extended to Feb 23: web.uri.edu/metcalf/awj/
A powerful statement from @ametsoc.org:
The repeal of the Endangerment Finding does not alter the central unambiguous scientific conclusion: The climate change people are causing threatens human lives and well-being.
@michaelemann.bsky.social
@bernwoodsplacky.bsky.social
@joeromm.bsky.social

Weather played a big role in Washington's crossing of the Delaware River. The weather that Washington experienced has changed.
Learn more in this great CBS Sunday Morning story with David Schechter. www.youtube.com/watch?v=t6L0...
@cbssundaymorning.bsky.social @climatecentral.org
#ClimateMatters

A graphic displaying the text: Causes and Responses to Extreme Winter Weather: February 8, 1-2 PM (EST) and headshots of panelists Jaime Palter, Jennifer Francis, Kevin Kircher, and moderator Charles Ellison. Description text: Recent winter extremes have raised new questions about how a warming Arctic may be reshaping weather far beyond the polar regions. Hosted by URI's Metcalf Institute and Solutions Journalism Network, this training for journalists explores the links between Arctic ice loss, polar vortex disruptions, and the growing frequency of severe winter weather across the Northern Hemisphere, as well as solutions that show how communities are adapting to these emerging risks.
Metcalf and @soljourno.bsky.social are teaming up to offer another free science training for journalists – on an issue many of us are feeling the effects of right now: Causes and Responses to Extreme Winter Weather. Join us Feb. 18 at 1 PM!
ow.ly/YVeX50Y8lZp

Join us on February 10 from 12-1pm at the @appc.upenn.edu for a panel discussion with @bernwoodsplacky.bsky.social and Edward Maibach moderated by @michaelemann.bsky.social on "Challenges and Opportunities in Today's Climate Communication Space".
Register here: www.eventbrite.com/e/challenges...

Graphic showing weekly concentration of CO2 in parts per million for the years from 2020 to 2026. We are currently setting new record high levels.
Carbon dioxide (CO₂) surpassed 430 ppm last year. How high will it go for the seasonal maximum in 2026?
➡️ Check out @climatecentral.org's latest monthly and year-in-review report at www.climatecentral.org/climate-brie..., which is part of our new climate services initiative.
Thanks for the shout out, @bernwoodsplacky.bsky.social!
26.01.2026 00:47 — 👍 2 🔁 1 💬 1 📌 0Couldn't miss a chance to call out one of the best!
29.01.2026 16:16 — 👍 1 🔁 0 💬 0 📌 0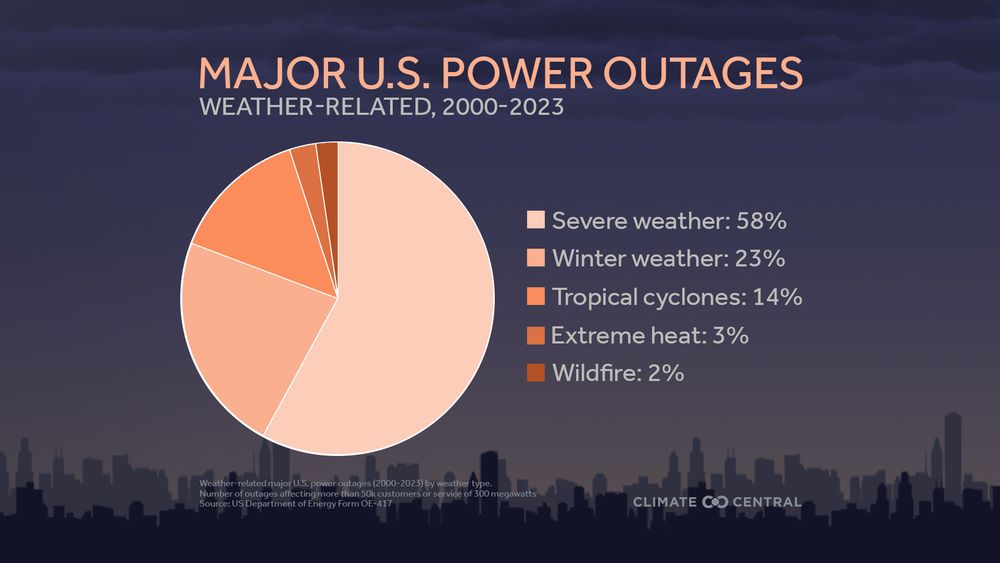
Pie chart showing causes of major U.S. power outages from 2000–2023. Severe weather accounts for 58% of outages, winter weather for 23%, tropical cyclones for 14%, extreme heat for 3%, and wildfire for 2%, highlighting weather as the dominant driver of large outages.
⚡Winter weather: 2nd biggest cause of U.S. power disruptions
From 2000–2023, 80% of major U.S. power outages (affecting 50k+ customers or 300+ MW) were weather-related.
Of 1,755 outages reported, 398 (23%) were caused by winter weather — including ice, snow, and freezing rain.

U.S. map of current National Weather Service hazards showing widespread winter storm warnings, winter weather advisories, and ice storm warnings across parts of the South, Midwest, and East. Highlights the large geographic extent of expected winter impacts.

Map showing the probability of at least minor winter weather impacts across the U.S. Highest probabilities extend from Texas through the Southeast, Mid-Atlantic, and into the Northeast, indicating widespread risk of winter weather disruptions.
Frigid air and an impactful, disruptive winter storm are in the works for the weekend.
These kinds of events don’t happen despite a warming climate...they’re connected to it, especially when it comes to ice and snow totals.
A short 🧵to walk through the science together ⬇️

Applications are now open for the CCNow Academy, our flagship, 3-month training program for journalists worldwide.
Join us for 12 live sessions, with colleagues from around the world, CCNow and guest experts.
Runs March-June 2026. Apply by February 16!

Bar graph showing US temperatures by year. Blue bars going down are temperatures below 20th century average and are present in beginning of graph 1895-1970s. Orange bars most recently indicate above-average temperatures. Temperatures are rising because of climate change.
📈 It's official from NOAA. 2025 was the fourth-hottest year on record (since 1895) for the contiguous U.S. 🔥
Average temperatures for the contiguous U.S. in 2025 were 2.6°F (1.4°C) warmer than the 20th century (1901-2000) average.
🧵 Let's dig in a little deeper.

Promo to register for Climate Central Monthly climate brief. image is over billion dollar disasters over US with round icons of the types of disasters.
🔥Just how hot was 2025?
💲 What about billion-dollar weather and climate disasters?
🌊 And will La Nina last long into 2026?
Get those questions answered and more at Climate Central's next Monthly Climate Brief 🗓️Tuesday, January 20 | 12pm ET
🔗Register: buff.ly/WNPWI8e


Looking forward to the 106th Annual Meeting of the @ametsoc.org.
If you're one of the thousands attending, we'd love to see you at any or all of these listed below. And honestly? Just come say "howdy" anytime! We're always up for a good conversation and connecting.
See you in Houston! #AMS2026

🔥 2026 has started with extreme heat in many places - including Australia.
According to the Bureau of Meteorology, many areas across Australia will experience severe - extreme heatwaves this week.
Learn how to stay safe during extreme heat:
🔗 https://bit.ly/44XiPLA
📷 Bureau of Meteorology

The 2025 Billion Dollar Disaster #s are in
⚡23 total events at $1B or higher (inflation adjusted)
⚡This is the 3rd highest year
⚡Severe storms accounted for 21 of the 23 events
⚡The costliest: LA fires, $61.2B (costliest wildfire on record)
@climatecentral
www.climatecentral.org/climate-matt...

From a Massachusetts neighborhood cutting monthly bills to cutting-edge drilling that reaches “crazy hot” temperatures miles underground, Ben Tracy reports on how heat beneath our feet could help power America’s future.
youtu.be/BlvWcdNUwTQ

Will you see a white Christmas this year?
For most of the U.S.: Nope. 🫤
Still, here are the historical odds 🎁
(Download your city's data: www.climatecentral.org/graphic/data...)
Was there a graphic or resource that really stuck with you this year?
Reply below 👇 and let us know what stood out, surprised you, or sparked a conversation in 2025.
🔎 Browse the full Climate Central resource library ⤵️
www.climatecentral.org/resources


➕...but there are so many more
"I can’t choose just one. And that’s the point. There are so many climate stories to tell, from rising food costs & renewables to worsening allergies & air quality, risks to chocolate, more home runs, & catalyzing climate conversations” - @bernwoodsplacky.bsky.social
As 2025 wraps, we’re looking back at some of the Climate Central team’s favorite Climate Matters from the past year.
From memorable graphics to go-to story resources, these are the releases that stuck with us.
🧵Let's stroll through the resource library ⤵️


At least two dozen record highs are expected to be tied or broken across the Lower 48 on Christmas Day.
Near-record/Top 5 December 25th warmth is forecast for at least ~half of the U.S.
Climate Change now makes unseasonable, not-so-holly-jolly warmth like this at least twice as likely to occur
Starter Packs are one of my favourite features of @bsky.app. I’ve curated 20+ climate-themed packs on everything from health to comedy (all linked on my profile). But this one is special: my very first pack, the colleagues I personally turn to for insight + perspective, most of whom I know IRL.
09.12.2025 18:51 — 👍 144 🔁 45 💬 4 📌 3
Meteorologists are some of the original creators.
Learn more here, in addition to lessons learned that all communicators can incorporate:
newscreatorcorps.org/2025/12/why-...
@newscreatorcorp @climatecentral.org
This is absolutely awful. This was one of the best resources for climate indicators data, and my go-to share for help answering public questions.
Luckily I captured some of them on my new U.S. climate page a few months ago: zacklabe.com/united-state...

Map of continental US with dots in red and blue. Red over much of the country outside the northeast indicate above-average temperatures in November.
🌡️🧵This past November saw elevated temperatures in the U.S., with an average anomaly — or difference from normal — of 2.0°F across 194 cities.
www.climatecentral.org/report/month...