The image is a chart of nitrogen dioxide on specific dates, with the values in micrograms per metre cubed. The data is as follows.
18-09-2025: 8.91.
19-09-2025: 9.75.
20-09-2025: 14.38.
21-09-2025: 7.7.
22-09-2025: 11.98.
23-09-2025: 24.15.
24-09-2025: 32.21.

The image is a chart of nitrogen dioxide on specific dates, with the values in micrograms per metre cubed. The data is as follows.
18-09-2025: 18.65.
19-09-2025: 18.46.
20-09-2025: 13.39.
21-09-2025: 5.87.
22-09-2025: 17.65.
23-09-2025: 18.2.
24-09-2025: 24.46.

The image is a chart of nitrogen dioxide on specific dates, with the values in micrograms per metre cubed. The data is as follows.
18-09-2025: 13.89.
19-09-2025: 16.15.
20-09-2025: 19.34.
21-09-2025: 12.22.
22-09-2025: 22.21.
23-09-2025: 29.03.
24-09-2025: 36.71.
24h average NO2 readings for Wed 24th Sep 2025
Gosforth: 32.21µg/m³
Coast Road: 24.46µg/m³
Tyne Bridge: 36.71µg/m³
https://sensors.spaceforheaton.com
25.09.2025 08:30 — 👍 1 🔁 1 💬 0 📌 0

The image is a chart of nitrogen dioxide on specific dates, with the values in micrograms per metre cubed. The data is as follows.
17-09-2025: 13.73.
18-09-2025: 8.91.
19-09-2025: 9.75.
20-09-2025: 14.38.
21-09-2025: 7.7.
22-09-2025: 11.98.
23-09-2025: 24.15.

The image is a chart of nitrogen dioxide on specific dates, with the values in micrograms per metre cubed. The data is as follows.
17-09-2025: 24.62.
18-09-2025: 18.65.
19-09-2025: 18.46.
20-09-2025: 13.39.
21-09-2025: 5.87.
22-09-2025: 17.65.
23-09-2025: 18.2.

The image is a chart of nitrogen dioxide on specific dates, with the values in micrograms per metre cubed. The data is as follows.
17-09-2025: 18.72.
18-09-2025: 13.89.
19-09-2025: 16.15.
20-09-2025: 19.34.
21-09-2025: 12.22.
22-09-2025: 22.21.
23-09-2025: 29.03.
24h average NO2 readings for Tue 23rd Sep 2025
Gosforth: 24.15µg/m³
Coast Road: 18.2µg/m³
Tyne Bridge: 29.03µg/m³
https://sensors.spaceforheaton.com
24.09.2025 08:30 — 👍 1 🔁 0 💬 0 📌 0

The image is a chart of nitrogen dioxide on specific dates, with the values in micrograms per metre cubed. The data is as follows.
16-09-2025: 6.64.
17-09-2025: 13.73.
18-09-2025: 8.91.
19-09-2025: 9.75.
20-09-2025: 14.38.
21-09-2025: 7.7.
22-09-2025: 11.98.

The image is a chart of nitrogen dioxide on specific dates, with the values in micrograms per metre cubed. The data is as follows.
16-09-2025: 13.97.
17-09-2025: 24.62.
18-09-2025: 18.65.
19-09-2025: 18.46.
20-09-2025: 13.39.
21-09-2025: 5.87.
22-09-2025: 17.65.

The image is a chart of nitrogen dioxide on specific dates, with the values in micrograms per metre cubed. The data is as follows.
16-09-2025: 11.41.
17-09-2025: 18.72.
18-09-2025: 13.89.
19-09-2025: 16.15.
20-09-2025: 19.34.
21-09-2025: 12.22.
22-09-2025: 22.21.
24h average NO2 readings for Mon 22nd Sep 2025
Gosforth: 11.98µg/m³
Coast Road: 17.65µg/m³
Tyne Bridge: 22.21µg/m³
https://sensors.spaceforheaton.com
23.09.2025 08:30 — 👍 1 🔁 0 💬 0 📌 0

The image is a chart of nitrogen dioxide on specific dates, with the values in micrograms per metre cubed. The data is as follows.
15-09-2025: 9.04.
16-09-2025: 6.64.
17-09-2025: 13.73.
18-09-2025: 8.91.
19-09-2025: 9.75.
20-09-2025: 14.38.
21-09-2025: 7.7.

The image is a chart of nitrogen dioxide on specific dates, with the values in micrograms per metre cubed. The data is as follows.
15-09-2025: 18.38.
16-09-2025: 13.97.
17-09-2025: 24.62.
18-09-2025: 18.65.
19-09-2025: 18.46.
20-09-2025: 13.39.
21-09-2025: 5.87.

The image is a chart of nitrogen dioxide on specific dates, with the values in micrograms per metre cubed. The data is as follows.
15-09-2025: 14.75.
16-09-2025: 11.41.
17-09-2025: 18.72.
18-09-2025: 13.89.
19-09-2025: 16.15.
20-09-2025: 19.34.
21-09-2025: 12.22.
24h average NO2 readings for Sun 21st Sep 2025
Gosforth: 7.7µg/m³
Coast Road: 5.87µg/m³
Tyne Bridge: 12.22µg/m³
https://sensors.spaceforheaton.com
22.09.2025 08:30 — 👍 1 🔁 0 💬 0 📌 0

The image is a chart of nitrogen dioxide on specific dates, with the values in micrograms per metre cubed. The data is as follows.
14-09-2025: 12.5.
15-09-2025: 9.04.
16-09-2025: 6.64.
17-09-2025: 13.73.
18-09-2025: 8.91.
19-09-2025: 9.75.
20-09-2025: 14.38.

The image is a chart of nitrogen dioxide on specific dates, with the values in micrograms per metre cubed. The data is as follows.
14-09-2025: 21.67.
15-09-2025: 18.38.
16-09-2025: 13.97.
17-09-2025: 24.62.
18-09-2025: 18.65.
19-09-2025: 18.46.
20-09-2025: 13.39.

The image is a chart of nitrogen dioxide on specific dates, with the values in micrograms per metre cubed. The data is as follows.
14-09-2025: 21.72.
15-09-2025: 14.75.
16-09-2025: 11.41.
17-09-2025: 18.72.
18-09-2025: 13.89.
19-09-2025: 16.15.
20-09-2025: 19.34.
24h average NO2 readings for Sat 20th Sep 2025
Gosforth: 14.38µg/m³
Coast Road: 13.39µg/m³
Tyne Bridge: 19.34µg/m³
https://sensors.spaceforheaton.com
21.09.2025 08:30 — 👍 1 🔁 0 💬 0 📌 0

The image is a chart of nitrogen dioxide on specific dates, with the values in micrograms per metre cubed. The data is as follows.
13-09-2025: 11.33.
14-09-2025: 12.5.
15-09-2025: 9.04.
16-09-2025: 6.64.
17-09-2025: 13.73.
18-09-2025: 8.91.
19-09-2025: 9.75.

The image is a chart of nitrogen dioxide on specific dates, with the values in micrograms per metre cubed. The data is as follows.
13-09-2025: 22.5.
14-09-2025: 21.67.
15-09-2025: 18.38.
16-09-2025: 13.97.
17-09-2025: 24.62.
18-09-2025: 18.65.
19-09-2025: 18.46.

The image is a chart of nitrogen dioxide on specific dates, with the values in micrograms per metre cubed. The data is as follows.
13-09-2025: 22.22.
14-09-2025: 21.72.
15-09-2025: 14.75.
16-09-2025: 11.41.
17-09-2025: 18.72.
18-09-2025: 13.89.
19-09-2025: 16.15.
24h average NO2 readings for Fri 19th Sep 2025
Gosforth: 9.75µg/m³
Coast Road: 18.46µg/m³
Tyne Bridge: 16.15µg/m³
https://sensors.spaceforheaton.com
20.09.2025 08:30 — 👍 1 🔁 0 💬 0 📌 0

The image is a chart of nitrogen dioxide on specific dates, with the values in micrograms per metre cubed. The data is as follows.
12-09-2025: 9.3.
13-09-2025: 11.33.
14-09-2025: 12.5.
15-09-2025: 9.04.
16-09-2025: 6.64.
17-09-2025: 13.73.
18-09-2025: 8.91.

The image is a chart of nitrogen dioxide on specific dates, with the values in micrograms per metre cubed. The data is as follows.
12-09-2025: 24.99.
13-09-2025: 22.5.
14-09-2025: 21.67.
15-09-2025: 18.38.
16-09-2025: 13.97.
17-09-2025: 24.62.
18-09-2025: 18.65.

The image is a chart of nitrogen dioxide on specific dates, with the values in micrograms per metre cubed. The data is as follows.
12-09-2025: 19.82.
13-09-2025: 22.22.
14-09-2025: 21.72.
15-09-2025: 14.75.
16-09-2025: 11.41.
17-09-2025: 18.72.
18-09-2025: 13.89.
24h average NO2 readings for Thu 18th Sep 2025
Gosforth: 8.91µg/m³
Coast Road: 18.65µg/m³
Tyne Bridge: 13.89µg/m³
https://sensors.spaceforheaton.com
19.09.2025 08:30 — 👍 1 🔁 0 💬 0 📌 0

The image is a chart of nitrogen dioxide on specific dates, with the values in micrograms per metre cubed. The data is as follows.
11-09-2025: 9.12.
12-09-2025: 9.3.
13-09-2025: 11.33.
14-09-2025: 12.5.
15-09-2025: 9.04.
16-09-2025: 6.64.
17-09-2025: 13.73.

The image is a chart of nitrogen dioxide on specific dates, with the values in micrograms per metre cubed. The data is as follows.
11-09-2025: 21.53.
12-09-2025: 24.99.
13-09-2025: 22.5.
14-09-2025: 21.67.
15-09-2025: 18.38.
16-09-2025: 13.97.
17-09-2025: 24.62.

The image is a chart of nitrogen dioxide on specific dates, with the values in micrograms per metre cubed. The data is as follows.
11-09-2025: 21.17.
12-09-2025: 19.82.
13-09-2025: 22.22.
14-09-2025: 21.72.
15-09-2025: 14.75.
16-09-2025: 11.41.
17-09-2025: 18.72.
24h average NO2 readings for Wed 17th Sep 2025
Gosforth: 13.73µg/m³
Coast Road: 24.62µg/m³
Tyne Bridge: 18.72µg/m³
https://sensors.spaceforheaton.com
18.09.2025 08:30 — 👍 1 🔁 0 💬 0 📌 0

The image is a chart of nitrogen dioxide on specific dates, with the values in micrograms per metre cubed. The data is as follows.
10-09-2025: 25.9.
11-09-2025: 9.12.
12-09-2025: 9.3.
13-09-2025: 11.33.
14-09-2025: 12.5.
15-09-2025: 9.04.
16-09-2025: 6.64.

The image is a chart of nitrogen dioxide on specific dates, with the values in micrograms per metre cubed. The data is as follows.
10-09-2025: 24.72.
11-09-2025: 21.53.
12-09-2025: 24.99.
13-09-2025: 22.5.
14-09-2025: 21.67.
15-09-2025: 18.38.
16-09-2025: 13.97.

The image is a chart of nitrogen dioxide on specific dates, with the values in micrograms per metre cubed. The data is as follows.
10-09-2025: 32.71.
11-09-2025: 21.17.
12-09-2025: 19.82.
13-09-2025: 22.22.
14-09-2025: 21.72.
15-09-2025: 14.75.
16-09-2025: 11.41.
24h average NO2 readings for Tue 16th Sep 2025
Gosforth: 6.64µg/m³
Coast Road: 13.97µg/m³
Tyne Bridge: 11.41µg/m³
https://sensors.spaceforheaton.com
17.09.2025 08:30 — 👍 1 🔁 0 💬 0 📌 0

The image is a chart of nitrogen dioxide on specific dates, with the values in micrograms per metre cubed. The data is as follows.
09-09-2025: 22.69.
10-09-2025: 25.9.
11-09-2025: 9.12.
12-09-2025: 9.3.
13-09-2025: 11.33.
14-09-2025: 12.5.
15-09-2025: 9.04.

The image is a chart of nitrogen dioxide on specific dates, with the values in micrograms per metre cubed. The data is as follows.
09-09-2025: 25.68.
10-09-2025: 24.72.
11-09-2025: 21.53.
12-09-2025: 24.99.
13-09-2025: 22.5.
14-09-2025: 21.67.
15-09-2025: 18.38.

The image is a chart of nitrogen dioxide on specific dates, with the values in micrograms per metre cubed. The data is as follows.
09-09-2025: 29.14.
10-09-2025: 32.71.
11-09-2025: 21.17.
12-09-2025: 19.82.
13-09-2025: 22.22.
14-09-2025: 21.72.
15-09-2025: 14.75.
24h average NO2 readings for Mon 15th Sep 2025
Gosforth: 9.04µg/m³
Coast Road: 18.38µg/m³
Tyne Bridge: 14.75µg/m³
https://sensors.spaceforheaton.com
16.09.2025 08:30 — 👍 1 🔁 0 💬 0 📌 0

The image is a chart of nitrogen dioxide on specific dates, with the values in micrograms per metre cubed. The data is as follows.
08-09-2025: 10.99.
09-09-2025: 22.69.
10-09-2025: 25.9.
11-09-2025: 9.12.
12-09-2025: 9.3.
13-09-2025: 11.33.
14-09-2025: 12.5.

The image is a chart of nitrogen dioxide on specific dates, with the values in micrograms per metre cubed. The data is as follows.
08-09-2025: 26.96.
09-09-2025: 25.68.
10-09-2025: 24.72.
11-09-2025: 21.53.
12-09-2025: 24.99.
13-09-2025: 22.5.
14-09-2025: 21.67.

The image is a chart of nitrogen dioxide on specific dates, with the values in micrograms per metre cubed. The data is as follows.
08-09-2025: 20.5.
09-09-2025: 29.14.
10-09-2025: 32.71.
11-09-2025: 21.17.
12-09-2025: 19.82.
13-09-2025: 22.22.
14-09-2025: 21.72.
24h average NO2 readings for Sun 14th Sep 2025
Gosforth: 12.5µg/m³
Coast Road: 21.67µg/m³
Tyne Bridge: 21.72µg/m³
https://sensors.spaceforheaton.com
15.09.2025 08:30 — 👍 1 🔁 0 💬 0 📌 0

The image is a chart of nitrogen dioxide on specific dates, with the values in micrograms per metre cubed. The data is as follows.
07-09-2025: 20.63.
08-09-2025: 10.99.
09-09-2025: 22.69.
10-09-2025: 25.9.
11-09-2025: 9.12.
12-09-2025: 9.3.
13-09-2025: 11.33.

The image is a chart of nitrogen dioxide on specific dates, with the values in micrograms per metre cubed. The data is as follows.
07-09-2025: 22.2.
08-09-2025: 26.96.
09-09-2025: 25.68.
10-09-2025: 24.72.
11-09-2025: 21.53.
12-09-2025: 24.99.
13-09-2025: 22.5.

The image is a chart of nitrogen dioxide on specific dates, with the values in micrograms per metre cubed. The data is as follows.
07-09-2025: 19.33.
08-09-2025: 20.5.
09-09-2025: 29.14.
10-09-2025: 32.71.
11-09-2025: 21.17.
12-09-2025: 19.82.
13-09-2025: 22.22.
24h average NO2 readings for Sat 13th Sep 2025
Gosforth: 11.33µg/m³
Coast Road: 22.5µg/m³
Tyne Bridge: 22.22µg/m³
https://sensors.spaceforheaton.com
14.09.2025 08:30 — 👍 1 🔁 0 💬 0 📌 0

The image is a chart of nitrogen dioxide on specific dates, with the values in micrograms per metre cubed. The data is as follows.
06-09-2025: 22.96.
07-09-2025: 20.63.
08-09-2025: 10.99.
09-09-2025: 22.69.
10-09-2025: 25.9.
11-09-2025: 9.12.
12-09-2025: 9.3.

The image is a chart of nitrogen dioxide on specific dates, with the values in micrograms per metre cubed. The data is as follows.
06-09-2025: 25.04.
07-09-2025: 22.2.
08-09-2025: 26.96.
09-09-2025: 25.68.
10-09-2025: 24.72.
11-09-2025: 21.53.
12-09-2025: 24.99.

The image is a chart of nitrogen dioxide on specific dates, with the values in micrograms per metre cubed. The data is as follows.
06-09-2025: 33.53.
07-09-2025: 19.33.
08-09-2025: 20.5.
09-09-2025: 29.14.
10-09-2025: 32.71.
11-09-2025: 21.17.
12-09-2025: 19.82.
24h average NO2 readings for Fri 12th Sep 2025
Gosforth: 9.3µg/m³
Coast Road: 24.99µg/m³
Tyne Bridge: 19.82µg/m³
https://sensors.spaceforheaton.com
13.09.2025 08:30 — 👍 1 🔁 0 💬 0 📌 0

The image is a chart of nitrogen dioxide on specific dates, with the values in micrograms per metre cubed. The data is as follows.
05-09-2025: 9.78.
06-09-2025: 22.96.
07-09-2025: 20.63.
08-09-2025: 10.99.
09-09-2025: 22.69.
10-09-2025: 25.9.
11-09-2025: 9.12.
The image is a chart of nitrogen dioxide on specific dates, with the values in micrograms per metre cubed. The data is as follows.
05-09-2025: 23.26.
06-09-2025: 25.04.
07-09-2025: 22.2.
08-09-2025: 26.96.
09-09-2025: 25.68.
10-09-2025: 24.72.
11-09-2025: 21.53.

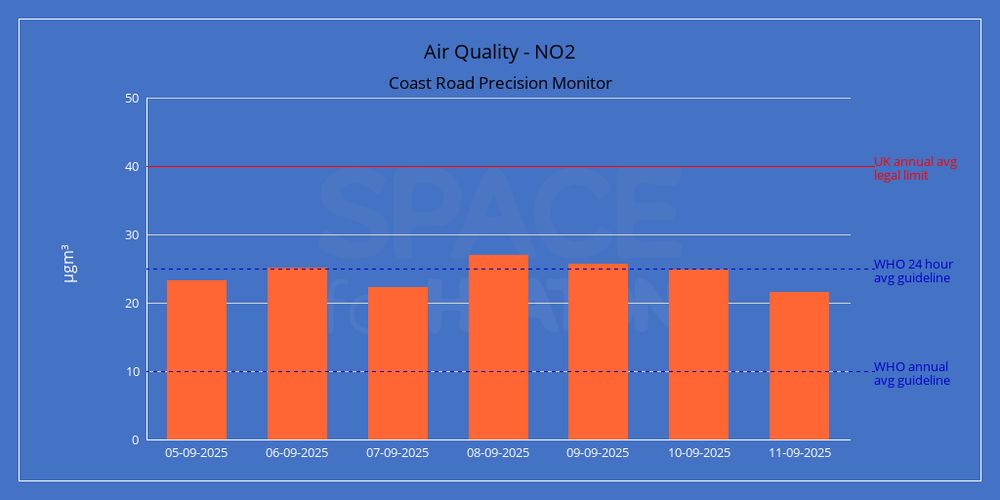
The image is a chart of nitrogen dioxide on specific dates, with the values in micrograms per metre cubed. The data is as follows.
05-09-2025: 25.32.
06-09-2025: 33.53.
07-09-2025: 19.33.
08-09-2025: 20.5.
09-09-2025: 29.14.
10-09-2025: 32.71.
11-09-2025: 21.17.
24h average NO2 readings for Thu 11th Sep 2025
Gosforth: 9.12µg/m³
Coast Road: 21.53µg/m³
Tyne Bridge: 21.17µg/m³
https://sensors.spaceforheaton.com
12.09.2025 08:30 — 👍 1 🔁 0 💬 0 📌 0

The image is a chart of nitrogen dioxide on specific dates, with the values in micrograms per metre cubed. The data is as follows.
04-09-2025: 12.07.
05-09-2025: 9.78.
06-09-2025: 22.96.
07-09-2025: 20.63.
08-09-2025: 10.99.
09-09-2025: 22.69.
10-09-2025: 25.9.

The image is a chart of nitrogen dioxide on specific dates, with the values in micrograms per metre cubed. The data is as follows.
04-09-2025: 25.58.
05-09-2025: 23.26.
06-09-2025: 25.04.
07-09-2025: 22.2.
08-09-2025: 26.96.
09-09-2025: 25.68.
10-09-2025: 24.72.

The image is a chart of nitrogen dioxide on specific dates, with the values in micrograms per metre cubed. The data is as follows.
04-09-2025: 21.35.
05-09-2025: 25.32.
06-09-2025: 33.53.
07-09-2025: 19.33.
08-09-2025: 20.5.
09-09-2025: 29.14.
10-09-2025: 32.71.
24h average NO2 readings for Wed 10th Sep 2025
Gosforth: 25.9µg/m³
Coast Road: 24.72µg/m³
Tyne Bridge: 32.71µg/m³
https://sensors.spaceforheaton.com
11.09.2025 08:30 — 👍 2 🔁 0 💬 0 📌 0

The image is a chart of nitrogen dioxide on specific dates, with the values in micrograms per metre cubed. The data is as follows.
03-09-2025: 22.04.
04-09-2025: 12.07.
05-09-2025: 9.78.
06-09-2025: 22.96.
07-09-2025: 20.63.
08-09-2025: 10.99.
09-09-2025: 22.69.

The image is a chart of nitrogen dioxide on specific dates, with the values in micrograms per metre cubed. The data is as follows.
03-09-2025: 25.68.
04-09-2025: 25.58.
05-09-2025: 23.26.
06-09-2025: 25.04.
07-09-2025: 22.2.
08-09-2025: 26.96.
09-09-2025: 25.68.

The image is a chart of nitrogen dioxide on specific dates, with the values in micrograms per metre cubed. The data is as follows.
03-09-2025: 22.53.
04-09-2025: 21.35.
05-09-2025: 25.32.
06-09-2025: 33.53.
07-09-2025: 19.33.
08-09-2025: 20.5.
09-09-2025: 29.14.
24h average NO2 readings for Tue 9th Sep 2025
Gosforth: 22.69µg/m³
Coast Road: 25.68µg/m³
Tyne Bridge: 29.14µg/m³
https://sensors.spaceforheaton.com
10.09.2025 08:30 — 👍 1 🔁 0 💬 0 📌 0

The image is a chart of nitrogen dioxide on specific dates, with the values in micrograms per metre cubed. The data is as follows.
02-09-2025: 16.18.
03-09-2025: 22.04.
04-09-2025: 12.07.
05-09-2025: 9.78.
06-09-2025: 22.96.
07-09-2025: 20.63.
08-09-2025: 10.99.

The image is a chart of nitrogen dioxide on specific dates, with the values in micrograms per metre cubed. The data is as follows.
02-09-2025: 32.83.
03-09-2025: 25.68.
04-09-2025: 25.58.
05-09-2025: 23.26.
06-09-2025: 25.04.
07-09-2025: 22.2.
08-09-2025: 26.96.

The image is a chart of nitrogen dioxide on specific dates, with the values in micrograms per metre cubed. The data is as follows.
02-09-2025: 25.25.
03-09-2025: 22.53.
04-09-2025: 21.35.
05-09-2025: 25.32.
06-09-2025: 33.53.
07-09-2025: 19.33.
08-09-2025: 20.5.
24h average NO2 readings for Mon 8th Sep 2025
Gosforth: 10.99µg/m³
Coast Road: 26.96µg/m³
Tyne Bridge: 20.5µg/m³
https://sensors.spaceforheaton.com
09.09.2025 08:30 — 👍 1 🔁 0 💬 0 📌 0

The image is a chart of nitrogen dioxide on specific dates, with the values in micrograms per metre cubed. The data is as follows.
01-09-2025: 10.57.
02-09-2025: 16.18.
03-09-2025: 22.04.
04-09-2025: 12.07.
05-09-2025: 9.78.
06-09-2025: 22.96.
07-09-2025: 20.63.

The image is a chart of nitrogen dioxide on specific dates, with the values in micrograms per metre cubed. The data is as follows.
01-09-2025: 16.79.
02-09-2025: 32.83.
03-09-2025: 25.68.
04-09-2025: 25.58.
05-09-2025: 23.26.
06-09-2025: 25.04.
07-09-2025: 22.2.

The image is a chart of nitrogen dioxide on specific dates, with the values in micrograms per metre cubed. The data is as follows.
01-09-2025: 16.18.
02-09-2025: 25.25.
03-09-2025: 22.53.
04-09-2025: 21.35.
05-09-2025: 25.32.
06-09-2025: 33.53.
07-09-2025: 19.33.
24h average NO2 readings for Sun 7th Sep 2025
Gosforth: 20.63µg/m³
Coast Road: 22.2µg/m³
Tyne Bridge: 19.33µg/m³
https://sensors.spaceforheaton.com
08.09.2025 08:30 — 👍 1 🔁 0 💬 0 📌 0

The image is a chart of nitrogen dioxide on specific dates, with the values in micrograms per metre cubed. The data is as follows.
31-08-2025: 8.82.
01-09-2025: 10.57.
02-09-2025: 16.18.
03-09-2025: 22.04.
04-09-2025: 12.07.
05-09-2025: 9.78.
06-09-2025: 22.96.

The image is a chart of nitrogen dioxide on specific dates, with the values in micrograms per metre cubed. The data is as follows.
31-08-2025: 18.23.
01-09-2025: 16.79.
02-09-2025: 32.83.
03-09-2025: 25.68.
04-09-2025: 25.58.
05-09-2025: 23.26.
06-09-2025: 25.04.

The image is a chart of nitrogen dioxide on specific dates, with the values in micrograms per metre cubed. The data is as follows.
31-08-2025: 14.35.
01-09-2025: 16.18.
02-09-2025: 25.25.
03-09-2025: 22.53.
04-09-2025: 21.35.
05-09-2025: 25.32.
06-09-2025: 33.53.
24h average NO2 readings for Sat 6th Sep 2025
Gosforth: 22.96µg/m³
Coast Road: 25.04µg/m³
Tyne Bridge: 33.53µg/m³
https://sensors.spaceforheaton.com
07.09.2025 08:30 — 👍 1 🔁 0 💬 0 📌 0

The image is a chart of nitrogen dioxide on specific dates, with the values in micrograms per metre cubed. The data is as follows.
30-08-2025: 10.56.
31-08-2025: 8.82.
01-09-2025: 10.57.
02-09-2025: 16.18.
03-09-2025: 22.04.
04-09-2025: 12.07.
05-09-2025: 9.78.

The image is a chart of nitrogen dioxide on specific dates, with the values in micrograms per metre cubed. The data is as follows.
30-08-2025: 19.68.
31-08-2025: 18.23.
01-09-2025: 16.79.
02-09-2025: 32.83.
03-09-2025: 25.68.
04-09-2025: 25.58.
05-09-2025: 23.26.

The image is a chart of nitrogen dioxide on specific dates, with the values in micrograms per metre cubed. The data is as follows.
30-08-2025: 19.64.
31-08-2025: 14.35.
01-09-2025: 16.18.
02-09-2025: 25.25.
03-09-2025: 22.53.
04-09-2025: 21.35.
05-09-2025: 25.32.
24h average NO2 readings for Fri 5th Sep 2025
Gosforth: 9.78µg/m³
Coast Road: 23.26µg/m³
Tyne Bridge: 25.32µg/m³
https://sensors.spaceforheaton.com
06.09.2025 08:30 — 👍 1 🔁 0 💬 0 📌 0

The image is a chart of nitrogen dioxide on specific dates, with the values in micrograms per metre cubed. The data is as follows.
29-08-2025: 17.07.
30-08-2025: 10.56.
31-08-2025: 8.82.
01-09-2025: 10.57.
02-09-2025: 16.18.
03-09-2025: 22.04.
04-09-2025: 12.07.

The image is a chart of nitrogen dioxide on specific dates, with the values in micrograms per metre cubed. The data is as follows.
29-08-2025: 23.53.
30-08-2025: 19.68.
31-08-2025: 18.23.
01-09-2025: 16.79.
02-09-2025: 32.83.
03-09-2025: 25.68.
04-09-2025: 25.58.

The image is a chart of nitrogen dioxide on specific dates, with the values in micrograms per metre cubed. The data is as follows.
29-08-2025: 19.7.
30-08-2025: 19.64.
31-08-2025: 14.35.
01-09-2025: 16.18.
02-09-2025: 25.25.
03-09-2025: 22.53.
04-09-2025: 21.35.
24h average NO2 readings for Thu 4th Sep 2025
Gosforth: 12.07µg/m³
Coast Road: 25.58µg/m³
Tyne Bridge: 21.35µg/m³
https://sensors.spaceforheaton.com
05.09.2025 08:30 — 👍 1 🔁 0 💬 0 📌 0

The image is a chart of nitrogen dioxide on specific dates, with the values in micrograms per metre cubed. The data is as follows.
28-08-2025: 16.95.
29-08-2025: 17.07.
30-08-2025: 10.56.
31-08-2025: 8.82.
01-09-2025: 10.57.
02-09-2025: 16.18.
03-09-2025: 22.04.

The image is a chart of nitrogen dioxide on specific dates, with the values in micrograms per metre cubed. The data is as follows.
28-08-2025: 26.95.
29-08-2025: 23.53.
30-08-2025: 19.68.
31-08-2025: 18.23.
01-09-2025: 16.79.
02-09-2025: 32.83.
03-09-2025: 25.68.

The image is a chart of nitrogen dioxide on specific dates, with the values in micrograms per metre cubed. The data is as follows.
28-08-2025: 19.74.
29-08-2025: 19.7.
30-08-2025: 19.64.
31-08-2025: 14.35.
01-09-2025: 16.18.
02-09-2025: 25.25.
03-09-2025: 22.53.
24h average NO2 readings for Wed 3rd Sep 2025
Gosforth: 22.04µg/m³
Coast Road: 25.68µg/m³
Tyne Bridge: 22.53µg/m³
https://sensors.spaceforheaton.com
04.09.2025 08:30 — 👍 1 🔁 0 💬 0 📌 0

The image is a chart of nitrogen dioxide on specific dates, with the values in micrograms per metre cubed. The data is as follows.
27-08-2025: 15.23.
28-08-2025: 16.95.
29-08-2025: 17.07.
30-08-2025: 10.56.
31-08-2025: 8.82.
01-09-2025: 10.57.
02-09-2025: 16.18.

The image is a chart of nitrogen dioxide on specific dates, with the values in micrograms per metre cubed. The data is as follows.
27-08-2025: 29.43.
28-08-2025: 26.95.
29-08-2025: 23.53.
30-08-2025: 19.68.
31-08-2025: 18.23.
01-09-2025: 16.79.
02-09-2025: 32.83.

The image is a chart of nitrogen dioxide on specific dates, with the values in micrograms per metre cubed. The data is as follows.
27-08-2025: 22.67.
28-08-2025: 19.74.
29-08-2025: 19.7.
30-08-2025: 19.64.
31-08-2025: 14.35.
01-09-2025: 16.18.
02-09-2025: 25.25.
24h average NO2 readings for Tue 2nd Sep 2025
Gosforth: 16.18µg/m³
Coast Road: 32.83µg/m³
Tyne Bridge: 25.25µg/m³
https://sensors.spaceforheaton.com
03.09.2025 08:30 — 👍 2 🔁 0 💬 0 📌 0

The image is a chart of nitrogen dioxide on specific dates, with the values in micrograms per metre cubed. The data is as follows.
26-08-2025: 16.68.
27-08-2025: 15.23.
28-08-2025: 16.95.
29-08-2025: 17.07.
30-08-2025: 10.56.
31-08-2025: 8.82.
01-09-2025: 10.57.

The image is a chart of nitrogen dioxide on specific dates, with the values in micrograms per metre cubed. The data is as follows.
26-08-2025: 32.97.
27-08-2025: 29.43.
28-08-2025: 26.95.
29-08-2025: 23.53.
30-08-2025: 19.68.
31-08-2025: 18.23.
01-09-2025: 16.79.

The image is a chart of nitrogen dioxide on specific dates, with the values in micrograms per metre cubed. The data is as follows.
26-08-2025: 24.83.
27-08-2025: 22.67.
28-08-2025: 19.74.
29-08-2025: 19.7.
30-08-2025: 19.64.
31-08-2025: 14.35.
01-09-2025: 16.18.
24h average NO2 readings for Mon 1st Sep 2025
Gosforth: 10.57µg/m³
Coast Road: 16.79µg/m³
Tyne Bridge: 16.18µg/m³
https://sensors.spaceforheaton.com
02.09.2025 08:30 — 👍 1 🔁 0 💬 0 📌 0

The image is a chart of nitrogen dioxide on specific dates, with the values in micrograms per metre cubed. The data is as follows.
25-08-2025: 24.49.
26-08-2025: 16.68.
27-08-2025: 15.23.
28-08-2025: 16.95.
29-08-2025: 17.07.
30-08-2025: 10.56.
31-08-2025: 8.82.

The image is a chart of nitrogen dioxide on specific dates, with the values in micrograms per metre cubed. The data is as follows.
25-08-2025: 28.56.
26-08-2025: 32.97.
27-08-2025: 29.43.
28-08-2025: 26.95.
29-08-2025: 23.53.
30-08-2025: 19.68.
31-08-2025: 18.23.

The image is a chart of nitrogen dioxide on specific dates, with the values in micrograms per metre cubed. The data is as follows.
25-08-2025: 31.61.
26-08-2025: 24.83.
27-08-2025: 22.67.
28-08-2025: 19.74.
29-08-2025: 19.7.
30-08-2025: 19.64.
31-08-2025: 14.35.
24h average NO2 readings for Sun 31st Aug 2025
Gosforth: 8.82µg/m³
Coast Road: 18.23µg/m³
Tyne Bridge: 14.35µg/m³
https://sensors.spaceforheaton.com
01.09.2025 08:30 — 👍 1 🔁 0 💬 0 📌 0

The image is a chart of nitrogen dioxide on specific dates, with the values in micrograms per metre cubed. The data is as follows.
24-08-2025: 21.69.
25-08-2025: 24.49.
26-08-2025: 16.68.
27-08-2025: 15.23.
28-08-2025: 16.95.
29-08-2025: 17.07.
30-08-2025: 10.56.

The image is a chart of nitrogen dioxide on specific dates, with the values in micrograms per metre cubed. The data is as follows.
24-08-2025: 28.64.
25-08-2025: 28.56.
26-08-2025: 32.97.
27-08-2025: 29.43.
28-08-2025: 26.95.
29-08-2025: 23.53.
30-08-2025: 19.68.

The image is a chart of nitrogen dioxide on specific dates, with the values in micrograms per metre cubed. The data is as follows.
24-08-2025: 25.73.
25-08-2025: 31.61.
26-08-2025: 24.83.
27-08-2025: 22.67.
28-08-2025: 19.74.
29-08-2025: 19.7.
30-08-2025: 19.64.
24h average NO2 readings for Sat 30th Aug 2025
Gosforth: 10.56µg/m³
Coast Road: 19.68µg/m³
Tyne Bridge: 19.64µg/m³
https://sensors.spaceforheaton.com
31.08.2025 08:30 — 👍 1 🔁 0 💬 0 📌 0

The image is a chart of nitrogen dioxide on specific dates, with the values in micrograms per metre cubed. The data is as follows.
23-08-2025: 24.48.
24-08-2025: 21.69.
25-08-2025: 24.49.
26-08-2025: 16.68.
27-08-2025: 15.23.
28-08-2025: 16.95.
29-08-2025: 17.07.

The image is a chart of nitrogen dioxide on specific dates, with the values in micrograms per metre cubed. The data is as follows.
23-08-2025: 26.57.
24-08-2025: 28.64.
25-08-2025: 28.56.
26-08-2025: 32.97.
27-08-2025: 29.43.
28-08-2025: 26.95.
29-08-2025: 23.53.

The image is a chart of nitrogen dioxide on specific dates, with the values in micrograms per metre cubed. The data is as follows.
23-08-2025: 24.18.
24-08-2025: 25.73.
25-08-2025: 31.61.
26-08-2025: 24.83.
27-08-2025: 22.67.
28-08-2025: 19.74.
29-08-2025: 19.7.
24h average NO2 readings for Fri 29th Aug 2025
Gosforth: 17.07µg/m³
Coast Road: 23.53µg/m³
Tyne Bridge: 19.7µg/m³
https://sensors.spaceforheaton.com
30.08.2025 08:30 — 👍 1 🔁 0 💬 0 📌 0

The image is a chart of nitrogen dioxide on specific dates, with the values in micrograms per metre cubed. The data is as follows.
22-08-2025: 20.78.
23-08-2025: 24.48.
24-08-2025: 21.69.
25-08-2025: 24.49.
26-08-2025: 16.68.
27-08-2025: 15.23.
28-08-2025: 16.95.

The image is a chart of nitrogen dioxide on specific dates, with the values in micrograms per metre cubed. The data is as follows.
22-08-2025: 28.03.
23-08-2025: 26.57.
24-08-2025: 28.64.
25-08-2025: 28.56.
26-08-2025: 32.97.
27-08-2025: 29.43.
28-08-2025: 26.95.

The image is a chart of nitrogen dioxide on specific dates, with the values in micrograms per metre cubed. The data is as follows.
22-08-2025: 21.33.
23-08-2025: 24.18.
24-08-2025: 25.73.
25-08-2025: 31.61.
26-08-2025: 24.83.
27-08-2025: 22.67.
28-08-2025: 19.74.
24h average NO2 readings for Thu 28th Aug 2025
Gosforth: 16.95µg/m³
Coast Road: 26.95µg/m³
Tyne Bridge: 19.74µg/m³
https://sensors.spaceforheaton.com
29.08.2025 08:30 — 👍 0 🔁 0 💬 0 📌 0

The image is a chart of nitrogen dioxide on specific dates, with the values in micrograms per metre cubed. The data is as follows.
21-08-2025: 18.91.
22-08-2025: 20.78.
23-08-2025: 24.48.
24-08-2025: 21.69.
25-08-2025: 24.49.
26-08-2025: 16.68.
27-08-2025: 15.23.

The image is a chart of nitrogen dioxide on specific dates, with the values in micrograms per metre cubed. The data is as follows.
21-08-2025: 21.86.
22-08-2025: 28.03.
23-08-2025: 26.57.
24-08-2025: 28.64.
25-08-2025: 28.56.
26-08-2025: 32.97.
27-08-2025: 29.43.

The image is a chart of nitrogen dioxide on specific dates, with the values in micrograms per metre cubed. The data is as follows.
21-08-2025: 18.71.
22-08-2025: 21.33.
23-08-2025: 24.18.
24-08-2025: 25.73.
25-08-2025: 31.61.
26-08-2025: 24.83.
27-08-2025: 22.67.
24h average NO2 readings for Wed 27th Aug 2025
Gosforth: 15.23µg/m³
Coast Road: 29.43µg/m³
Tyne Bridge: 22.67µg/m³
https://sensors.spaceforheaton.com
28.08.2025 08:30 — 👍 1 🔁 0 💬 0 📌 0

The image is a chart of nitrogen dioxide on specific dates, with the values in micrograms per metre cubed. The data is as follows.
20-08-2025: 11.32.
21-08-2025: 18.91.
22-08-2025: 20.78.
23-08-2025: 24.48.
24-08-2025: 21.69.
25-08-2025: 24.49.
26-08-2025: 16.68.

The image is a chart of nitrogen dioxide on specific dates, with the values in micrograms per metre cubed. The data is as follows.
20-08-2025: 10.82.
21-08-2025: 21.86.
22-08-2025: 28.03.
23-08-2025: 26.57.
24-08-2025: 28.64.
25-08-2025: 28.56.
26-08-2025: 32.97.

The image is a chart of nitrogen dioxide on specific dates, with the values in micrograms per metre cubed. The data is as follows.
20-08-2025: 10.41.
21-08-2025: 18.71.
22-08-2025: 21.33.
23-08-2025: 24.18.
24-08-2025: 25.73.
25-08-2025: 31.61.
26-08-2025: 24.83.
24h average NO2 readings for Tue 26th Aug 2025
Gosforth: 16.68µg/m³
Coast Road: 32.97µg/m³
Tyne Bridge: 24.83µg/m³
https://sensors.spaceforheaton.com
27.08.2025 09:16 — 👍 2 🔁 0 💬 0 📌 0