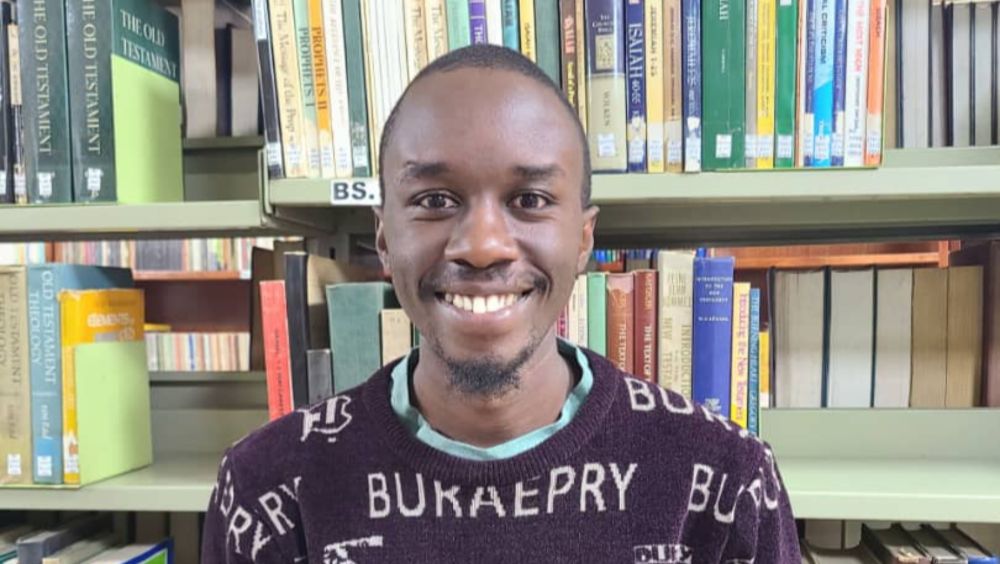
One of the great joys of working on @malengo.org is interacting with our amazing students. Here is a conversation I had with Hillary Turinawe, who is studying Medicine in Bonn, Germany.
26.10.2025 01:56 — 👍 7 🔁 2 💬 1 📌 0
(1) banger
(2) i wish non-economists would realise just how much time each economics paper takes to write (because of our norms about how thorough each paper has to be)
07.10.2025 15:48 — 👍 160 🔁 29 💬 3 📌 2
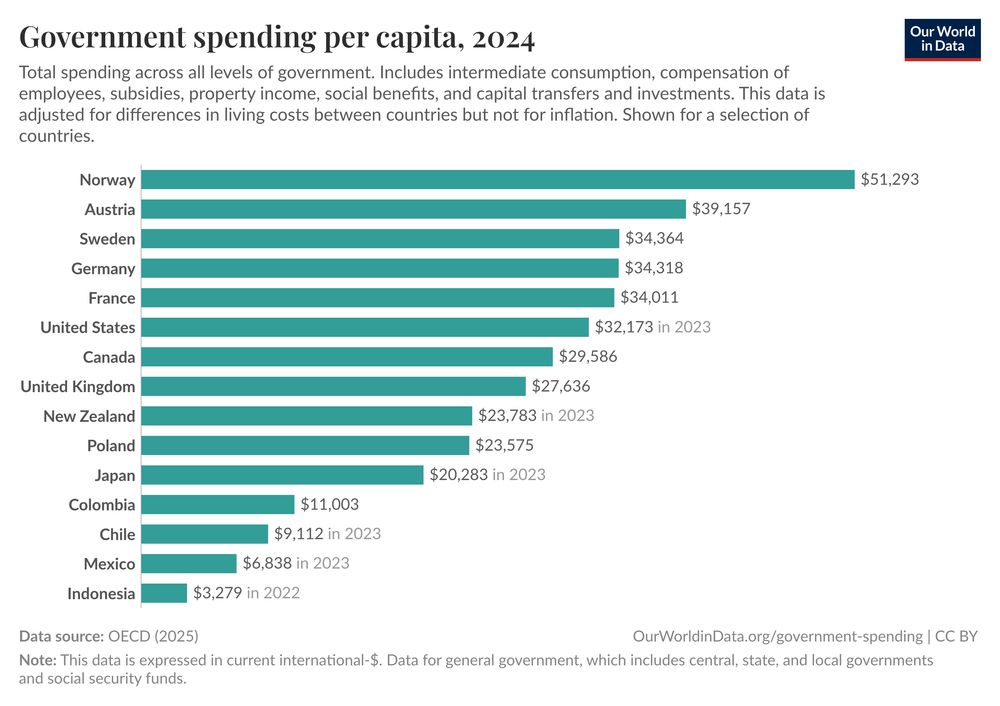
📊 Data update: We've just updated to the 2025 release of the OECD Government at a Glance dataset.
It has general government spending data up to 2024 and spending by function data up to 2023.
This update was led on our team by @parriagadap.bsky.social.
22.07.2025 16:48 — 👍 39 🔁 13 💬 2 📌 3
Donate to Help Derrick Go to Paris school of Economics, organised by Clare Nakimpi
My name is Derrick Ahabyona and I am deeply honored to have been accepted i… Clare Nakimpi needs your support for Help Derrick Go to Paris school of Economics
I would rarely do this, but I happen to know Derrick, and even wrote in his support for his applications. So, if you so inclined, this humble, ambitious, widely read, smart young budding African economist will work extremely hard not to disappoint.
shorturl.at/RgOVn
29.05.2025 21:02 — 👍 2 🔁 2 💬 0 📌 0

📊 Data update: We've just updated the data in our charts on electric vehicles!
The data comes from @iea.org’s Global EV Outlook 2025.
This update was led on our team by @hannahritchie.bsky.social.
29.05.2025 16:51 — 👍 104 🔁 29 💬 2 📌 4

You do field experiments: is there anything you should learn from laboratory experiments?
What can people doing field experiments learn from a new guide to lab experiments? @berkozler12.bsky.social discusses in today's blog and doesn't find that much
blogs.worldbank.org/en/impacteva...
07.05.2025 13:50 — 👍 9 🔁 6 💬 1 📌 0
🚨Development Economists!🚨Do you use Demographic and Health Surveys (DHS Program) data, which had been supported by USAID? IPUMS ( @ipums.bsky.social ) and the UN Statistics Division have a survey for you. I just filled it out. You can too. #econsky
21.04.2025 20:24 — 👍 33 🔁 35 💬 1 📌 0

Field evidence from Uganda on how trading networks shape firms’ tax behavior by #JustineKnebelmann @mitofficial.bsky.social
Paper: "Trading Networks and Tax Compliance: Experimental Evidence from Uganda"
Co-authors: Miguel Almunia, David Henning, Dorothy Nakyambadde, & Lin Tian
#CEPRNovaSBE2025
23.04.2025 09:36 — 👍 3 🔁 1 💬 1 📌 0

We kicked off 2025 with the full Malengo team in Nairobi—diving into strategy, culture, scholar & staff welfare, and more. We also made time to connect, relax, and have fun! Excited to share more in 2025 🎉 Learn more: www.malengo.org
#Malengo #Education #Migration
23.04.2025 13:34 — 👍 4 🔁 2 💬 0 📌 0

A bar graph illustrating the share of global area burned by wildfires across different regions from 2012 to 2024. The graph is divided vertically into segments representing five regions: Africa, Europe, Asia, Oceania, and North and South America. The deep red color represents Africa, which dominates the graph, showing more than half of the total area burned. Other regions, represented by lighter colors, fill the remaining sections of the graph. The year labels are placed along the horizontal axis, indicating the timeline of the data. The title emphasizes that more than half of the area burned by wildfire is in Africa. The data source is the Global Wildfire Information System, with the year of the data being noted as 2025. The graph is under a Creative Commons BY license.
Every year, more than half of the global area burned by wildfire is in Africa
14.04.2025 17:37 — 👍 59 🔁 10 💬 1 📌 3

A line chart showing the share of women in England and Wales who have ever married, by their age, from 17 to 50. There is a line each for women born in 1900, 1920, 1940, 1960, 1970, 1980, 1990, and 2000. The data is sourced from the UK Office for National Statistics (2024).
📊 Data update: We've just updated many of our charts on marriage and divorce!
10.04.2025 11:48 — 👍 74 🔁 14 💬 2 📌 4
Best wishes, kindly let me know when you're here! Maybe I'll contribute starter seedlings to your new farm.
27.03.2025 05:34 — 👍 1 🔁 0 💬 0 📌 0

Abhijit Banerjee and Esther Duflo: Foreign aid can be effective without the US
[FREE TO READ] In the wake of USAID cuts, wealthy nations and individuals must take the reins
Rethinking foreign aid: In a new op-ed, Abhijit Banerjee and Esther Duflo call for governments outside of the US, multilateral institutions, and philanthropists to take the lead on impactful and cost-effective foreign aid. buff.ly/gRYRszI
07.03.2025 21:23 — 👍 10 🔁 7 💬 0 📌 0
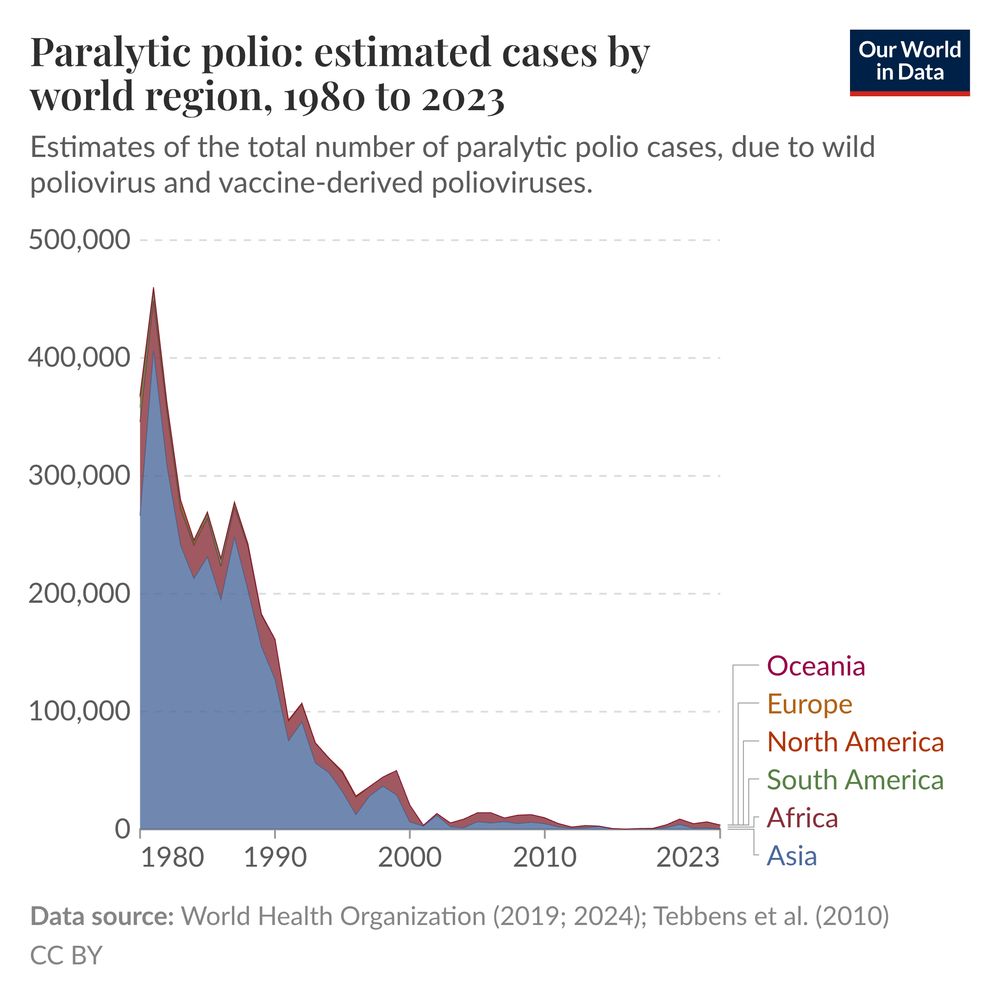
A stacked area chart titled "Paralytic polio: estimated cases by world region, 1980 to 2023" displays data on estimated total cases of paralytic polio, caused by both wild and vaccine-derived polioviruses. The y-axis represents the number of cases ranging from 0 to 500,000, while the x-axis indicates the years from 1980 to 2023.
Colored area bands represent different world regions: Oceania is shown in dark blue, Europe in light brown, North America in red, South America in orange, Africa in dark green, and Asia in teal.
The chart illustrates a significant peak in cases in the early 1980s, followed by a dramatic decrease through the 1990s and early 2000s, leveling out to very low estimates by 2023.
The footer cites the data sources: World Health Organization for the years 2019 and 2024, as well as Tebbens et al. from 2010. The graph is licensed under CC BY.
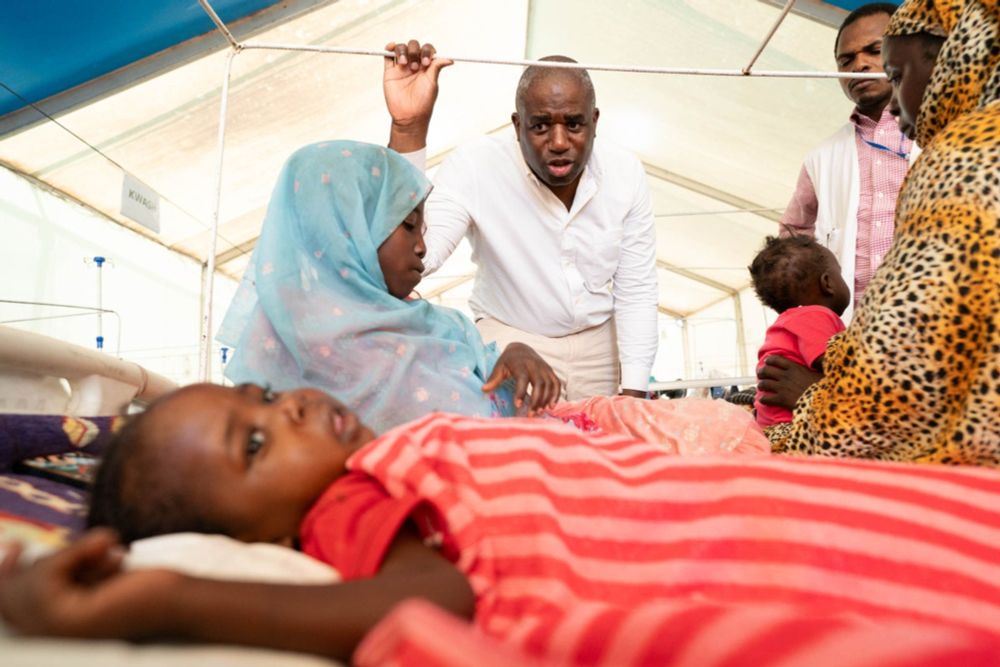
Foreign aid programs have played a crucial role in the fight against polio.
In the early 1980s, almost half a million people worldwide were paralyzed by polio every year, most of them children. But since the peak in 1981, the number of cases has fallen by more than 99%.
10.03.2025 13:59 — 👍 76 🔁 27 💬 4 📌 1
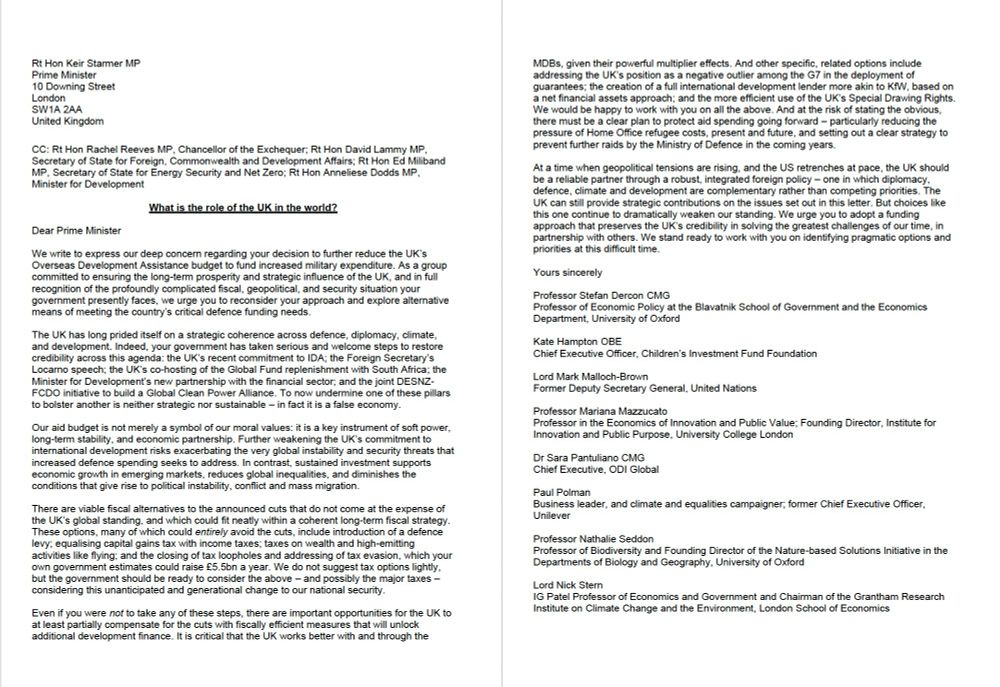
I had to sign this letter to the UK PM on the aid cuts.
National Security is a public good: people rightly expect the state to provide it.
How to fund it is a key public finance decision.
Sensible public financial management is all about trade-offs.
This was the wrong one.
28.02.2025 13:22 — 👍 4 🔁 2 💬 0 📌 0
Personally, I love the broader approach of "development economics" of recent years. IMHO, development econ should cover all of economics in low- and middle-income countries (which is notably 84%of the world's population), rather than being a narrow field, segregated from the rest of economics.
01.01.2025 17:47 — 👍 20 🔁 2 💬 1 📌 0
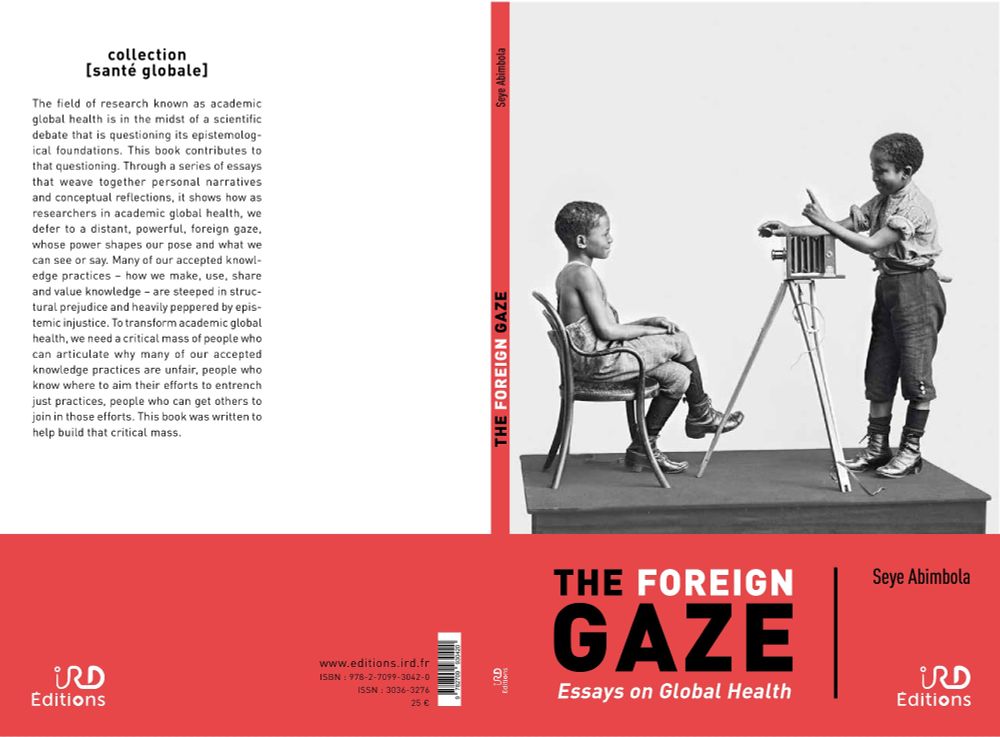
I'm happy to announce that my book, "The Foreign Gaze: Essays on Global Health", is now out!
You can order the print copy and download the e-copy (open access) here: www.editions.ird.fr/produit/728/...
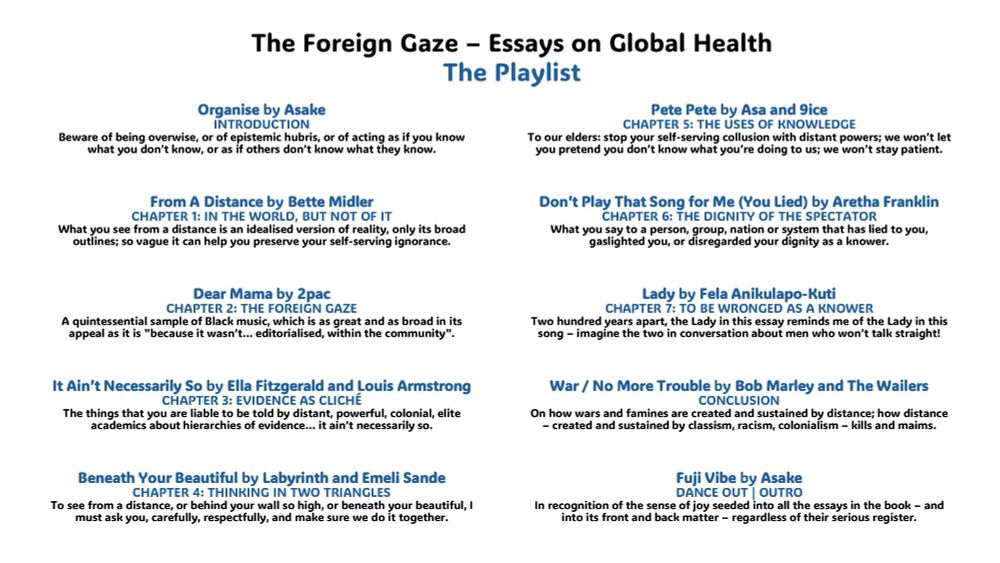
The book comes with a playlist for your listening pleasure: open.spotify.com/playlist/5K5...
18.11.2024 22:29 — 👍 243 🔁 115 💬 23 📌 20

Applied econ papers be like
03.12.2024 12:19 — 👍 165 🔁 12 💬 4 📌 0
Associate Professor of Public Policy, Politics, and Education @UVA.
I share social science.
Center for research and training in economics at the highest international level, with a strong focus on the evaluation of public policies.
📍Paris, France.
Postdoctoral Researcher @w-u-r.bsky.social | Economic Development | Human Capital: Education, Health | Rstats | 🐘🌵🌚🌝 🌊🌶️
Prof of Primary Care Health Sciences, Oxford. Researching digital health/ inequities, covid prevention (masks/ air quality). Wild swimmer. Mum to Rob (marine bio) & Al (doc). She/her. https://scholar.google.com.au/citations?user=QDCqsJwAAAAJ&hl=en&oi=ao
Public policy professor at the Hobby School. Enthusiastic about food, dogs, travel, and research. I write books about many failures of local democracy. Bad opinions my own.
Professor of Political Science at the University of Ottawa / Professeur de science politique à l'Université d'Ottawa. He/him/il. https://stephenbrown.xyz
Research and data to make progress against the world’s largest problems. Based out of Oxford University (@ox.ac.uk), founded by @maxroser.bsky.social.
Words, watercolor, ink, plants, creative cohorts, community convergences. MD-born, VT-at-heart, MA-living. Support 2 refugee-led orgs in Uganda: 🎨NYTC (art/music ed center) & 🍄GoGreen (sustainable ag/mushroom lab). ✍️➡️ substack.com/@emilykaminsky
Economist @cornelluniversity.bsky.social. Founder @malengo.org and @busaracenter.bsky.social. Also @stockholm-uni.bsky.social & @eegmpi.bsky.social. johanneshaushofer.com
Econ prof University of Zurich.
Faculty affiliate at JPAL, CEPR, CESifo.
Board member IIPF, Helvetas, GAIN.
#EconSky
Professor @iobua.bsky.social, @uantwerpen.be
Senior Associate Fellow @egmontinstitute.bsky.social
Researching conflict, governance and geopolitics in Central & Eastern Africa
DRC / Uganda
www.kristoftiteca.com
philosopher of medicine and social sciences, clinical ethicist, pedagogy enthusiast, plant lady
'pretty decent at puns'
Looking for philosophy, medicine, public health, economics, methods, meta-research, history, and bioethics people!
She/Her
sociologist @ youtube and usc. edtech, platformed creation, and youth culture 💻🎥📺
mattrafalow.org / matt.rafalow at gee-✉️
Assistant Prof @ Korbel School of International Studies | studies gender and violence | into coffee, running, biking, and my dogs
Economist | Global Health & Aging | Postdoc @ Harvard Medical School & BWH & Charité | she/her
Senior Researcher @cmi_no, PI @EXCInequality & @InclusionIndia, PhD @UZH_en social protection 🇮🇳🇧🇩 & women's career choices 🇮🇳.
Professor of Economic and Social Policy at the Institute for Policy Research, University of Bath. Research Fellow IZA.
Assistant Professor of Economics at Texas A&M University | Interested in Environmental and Development Economics | Economist & Engineer
Website: www.tatianazarate.com
🇧🇪 Economist interested in trade & development, technology, and labor market inequality.
PhD UC Berkeley. Associate Prof at BI, Oslo.
https://www.ocf.berkeley.edu/~sgalle/