 13.04.2025 21:22 — 👍 541 🔁 62 💬 3 📌 1
Iva Brunec
@ivabrunec.bsky.social
data scientist in toronto / maps and dataviz / almost useless trivia knowledge https://ivabrunec.github.io/
@ivabrunec.bsky.social
data scientist in toronto / maps and dataviz / almost useless trivia knowledge https://ivabrunec.github.io/
 13.04.2025 21:22 — 👍 541 🔁 62 💬 3 📌 1
There's been a committed effort by people like Richard Hanania into mainstreaming race science and eugenics and it's, shamefully, mostly worked. Hanania in particular is a crude, blathering moron bigot using fourth rate statistics to justify his gutter bigotry
12.04.2025 17:33 — 👍 1672 🔁 306 💬 36 📌 22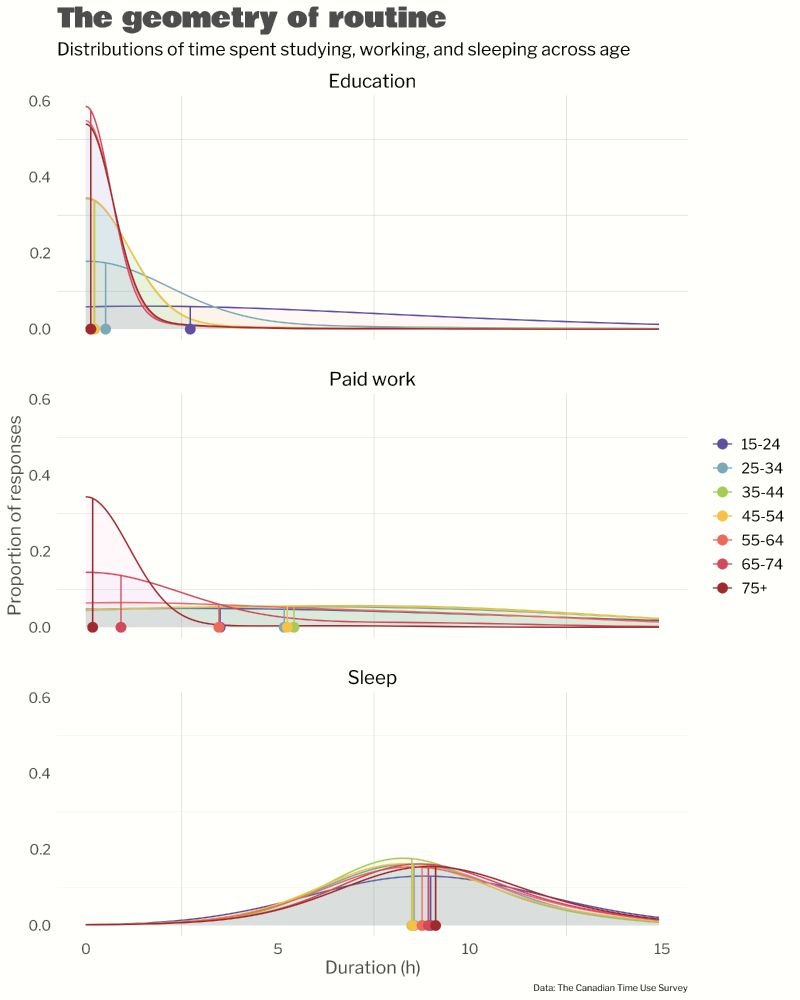
#30daychartchallenge day 10: multimodal.
I could probably find activities with even more variability but I was curious about the shape of how Canadians tend to spend their days across age: work, school, sleep.
Code: github.com/ivabrunec/30...

Inside a Powerful Database ICE Uses to Identify and Deport People
🔗 www.404media.co/inside-a-pow...
Thanks Hugo!
06.04.2025 18:00 — 👍 1 🔁 0 💬 0 📌 0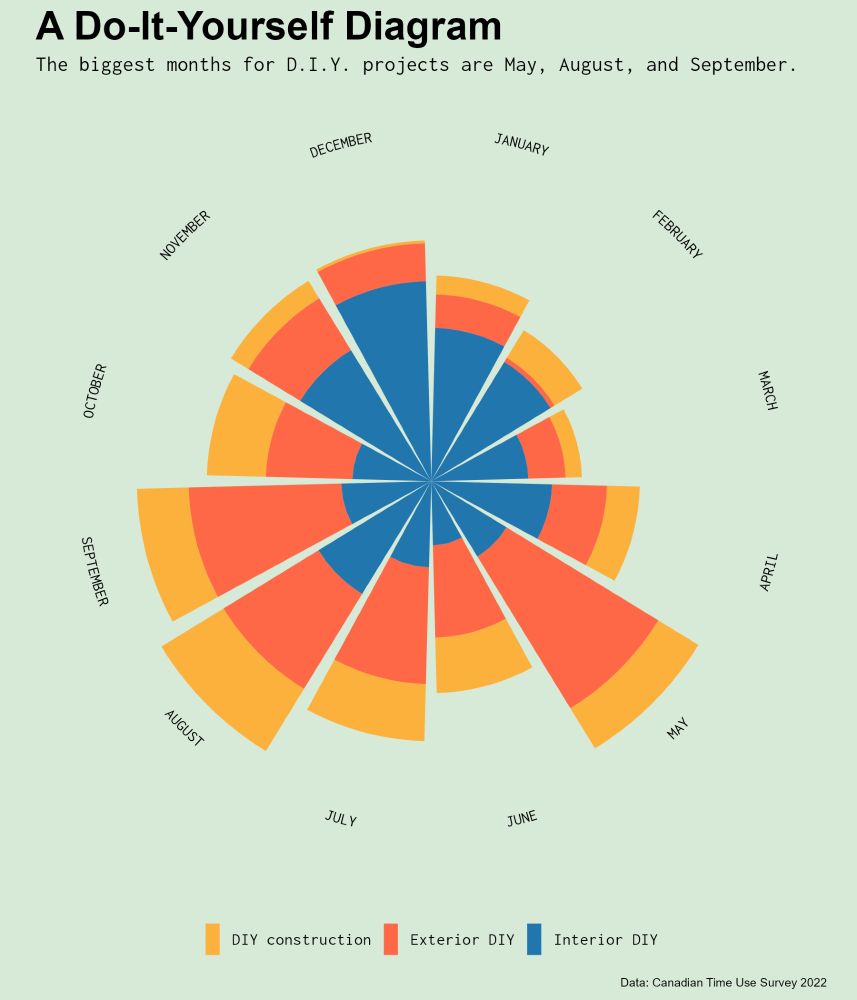
Taking some Sunday inspiration for day 6: Florence Nightingale day. I did a coxcomb graph of the amount of time Canadians spend on DIY projects, by month. Big month coming up.
Code: github.com/ivabrunec/30...
Realized the caption should say >0 mins and now I'm annoyed at myself.
06.04.2025 01:37 — 👍 1 🔁 0 💬 0 📌 0Forgot to add the data source again. It's the Canadian Time Use Survey! www150.statcan.gc.ca/n1/pub/45-25...
06.04.2025 01:24 — 👍 0 🔁 0 💬 0 📌 0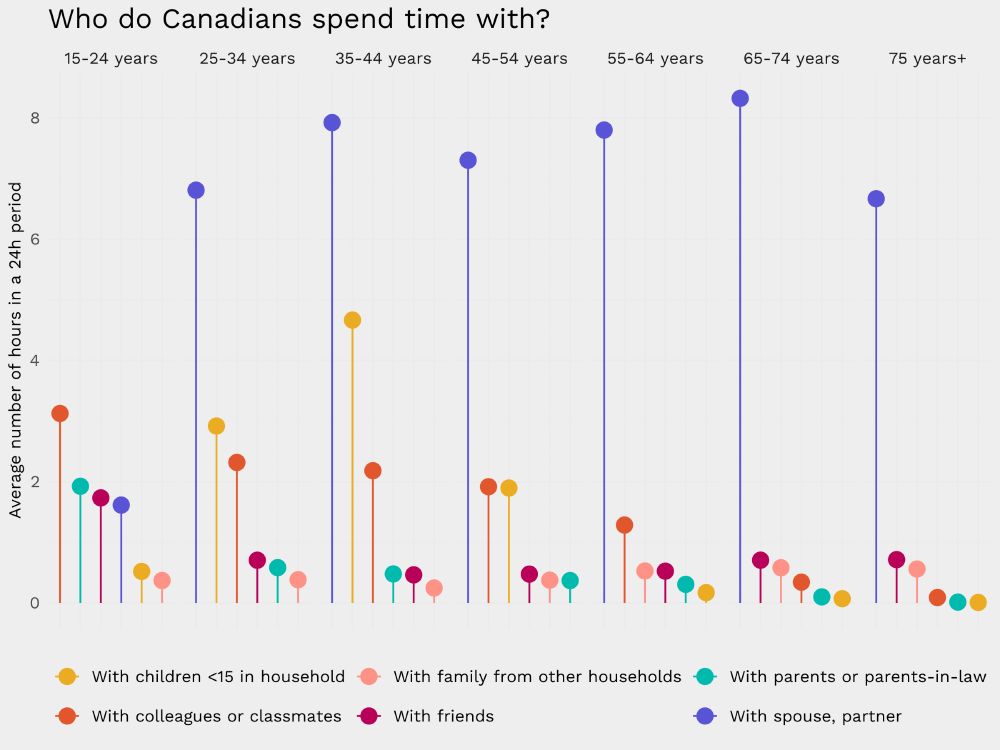
A simple one for day 5 of #30daychartchallenge: ranking.
A lollipop chart of the amount of time Canadians spend with different groups of people, at different ages.
Code: github.com/ivabrunec/30...
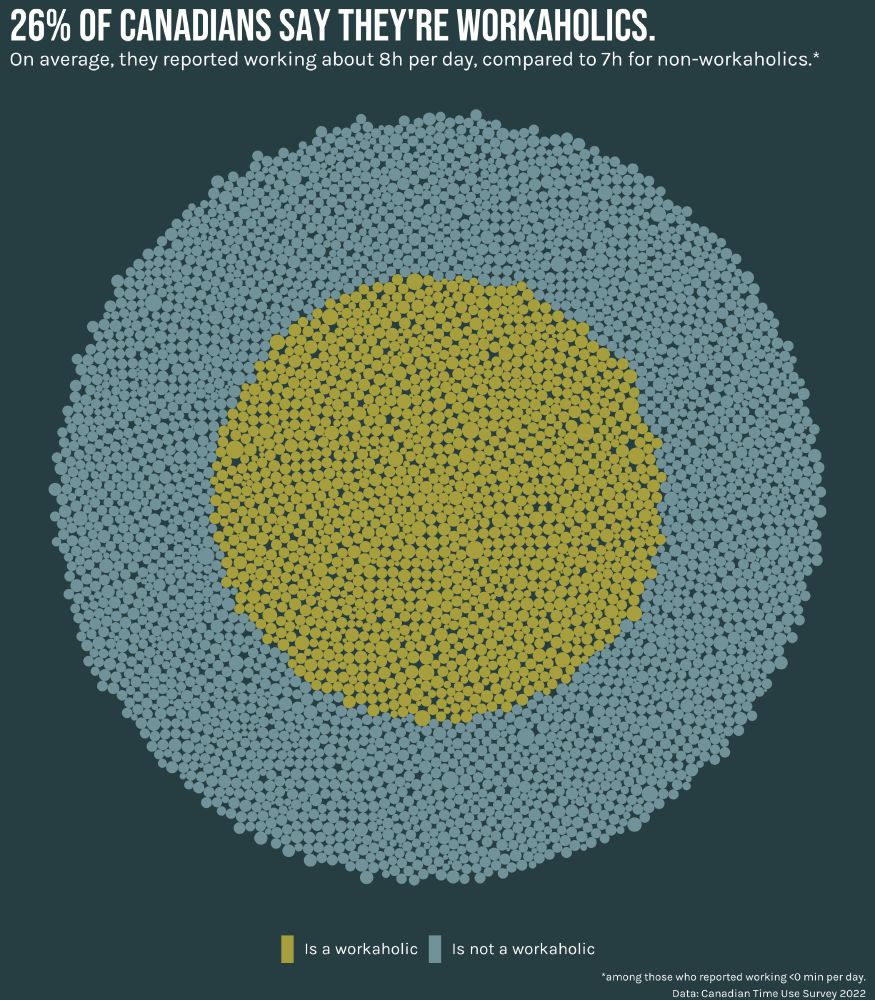
Circle-packing dataviz depicting hours worked color-coded by workaholic-status.
Day 3 of #30daychartchallenge: circular.
Circles in a circle. Is it good dataviz? No. But it is circular. Canadians' self-reported workaholic status, each circle = 1 person, size of circle = hrs of work.
Basically, don't believe people who say they're workaholics.
Code: github.com/ivabrunec/30...
Today in "Toronto's consultation process needs reform": the city sent me an invitation by mail to a consultation about a retroactive approval for an *enclosed front porch* about 5 doors down. Which we can't even see from the front or back of our house. Why should I get to weigh in on that!
03.04.2025 16:51 — 👍 1 🔁 0 💬 0 📌 0Ah good catch, I forgot to include it here. The data is from the Canadian Time Use Survey: www150.statcan.gc.ca/n1/pub/45-25...
03.04.2025 13:39 — 👍 1 🔁 0 💬 0 📌 0Honestly, I haven't been able to figure out the raw text files, so I'm just using the SAS data files provided. Unfortunately just for 2022 and 2005, so those are the years I'll be looking at.
03.04.2025 00:45 — 👍 0 🔁 0 💬 0 📌 0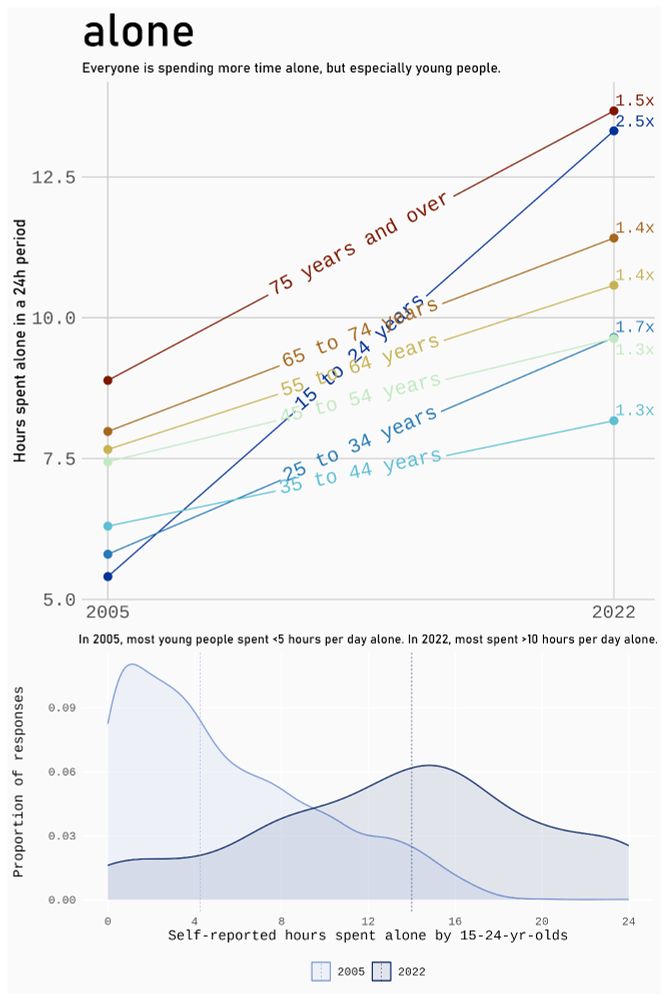
Data visualization depicting a stark increase in self-reported time spent alone in the canadian time use survey from 2005 to 2022. Density plot below depicts two distributions with very different peaks.
Day 2 of #30DayChartChallenge: Slope.
Canadians spent a *lot* more time alone in 2022 compared to 2005. But that comparison is especially stark for young Canadians.
Code: github.com/ivabrunec/30...
So glad to hear! It was a bit experimental so entirely possible the code could be more efficient/organized.
02.04.2025 21:37 — 👍 1 🔁 0 💬 0 📌 0Planning on comparisons! Just warming up/getting acquainted today. It's such a rich source!
02.04.2025 00:46 — 👍 1 🔁 0 💬 1 📌 0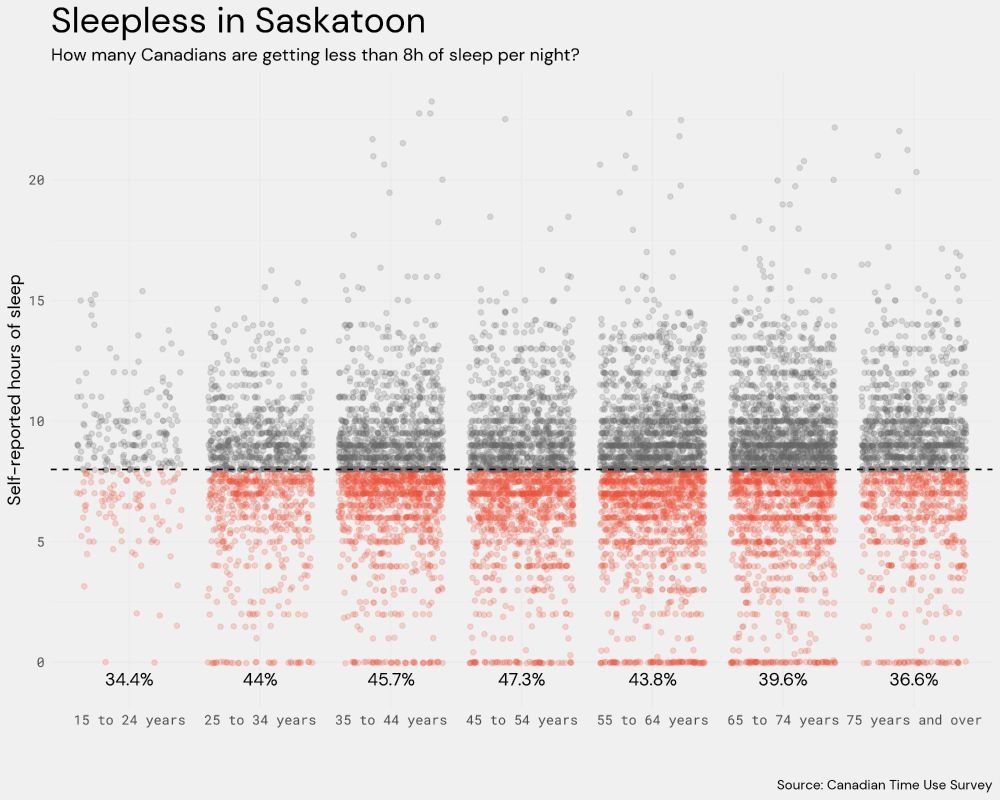
I decided I'll try to make all my charts for #30DayChartChallenge this year from a single data source - the Canadian Time Use Survey.
First up: Day 1 - Fractions. What % of Canadians don't get their 8h of sleep?
Code: github.com/ivabrunec/30...

Today's newsletter: www.readtpa.com/p/navigating...
31.03.2025 17:52 — 👍 348 🔁 98 💬 3 📌 10
NYU canceled a planned speech by the former president of Doctors Without Borders because she planned to discuss the humanitarian crisis in Gaza and cuts to US AID.
This is what actual campus censorship looks like.
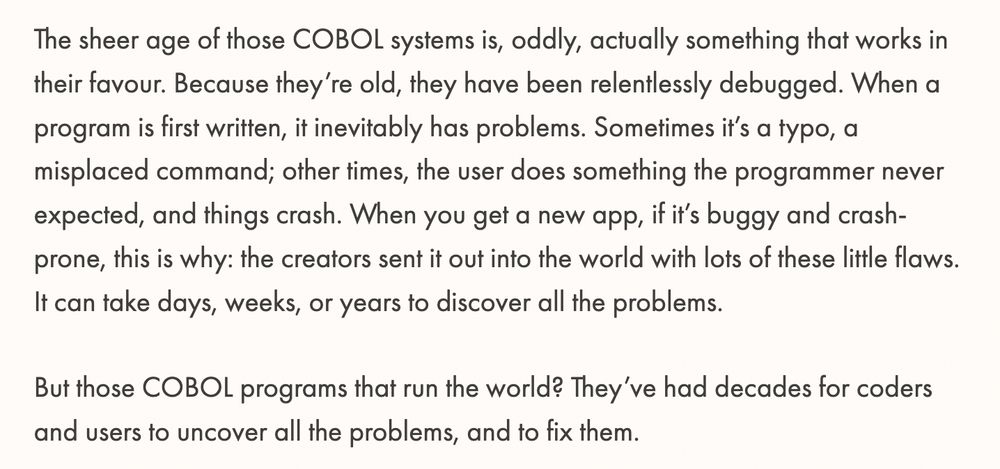
Screenshot reading: "The sheer age of those COBOL systems is, oddly, actually something that works in their favour. Because they’re old, they have been relentlessly debugged. When a program is first written, it inevitably has problems. Sometimes it’s a typo, a misplaced command; other times, the user does something the programmer never expected, and things crash. When you get a new app, if it’s buggy and crash-prone, this is why: the creators sent it out into the world with lots of these little flaws. It can take days, weeks, or years to discover all the problems."
Also, *because* these COBOL systems are old ...
... the code is *very* bug-free
The maintainers have had decades to find and fix all the flaws in the system
In contrast, as any developer will tell you, the newer a code base is ...
... the more bugs it's gonna have, the more it'll crash
3/9

My cat was fully grey when he was found about 5 months ago. Now he's getting patches of orange which fully tracks because he's always behaved like an orange cat, brain cells-wise.
29.03.2025 15:32 — 👍 4 🔁 0 💬 0 📌 0If you accept that non-citizens have no right to due process, you are accepting that citizens have no right to due process. All the government has to do is claim that you are not a citizen; without due process you have no chance to prove the contrary.
24.03.2025 22:18 — 👍 27968 🔁 10652 💬 329 📌 581the AI studio ghibli graphic the White House just tweeted mocking someone's deportation actually filled me with a level of despair that i can't even put to words
27.03.2025 20:01 — 👍 762 🔁 112 💬 0 📌 1I understand the purpose and utility of centering these incidents but it would be nice if people just cared because other people's lives were being ruined and not potentially their own
27.03.2025 14:27 — 👍 734 🔁 63 💬 9 📌 1Nice, excited to see it! And yeah, real exercise in font sizes/ggrepel for me.
27.03.2025 14:25 — 👍 0 🔁 0 💬 0 📌 0The logic here was to take the top 10 words in 2023 (most recent year) and then backwards-map their frequency across the years. One clear outlier.
27.03.2025 13:38 — 👍 0 🔁 0 💬 0 📌 0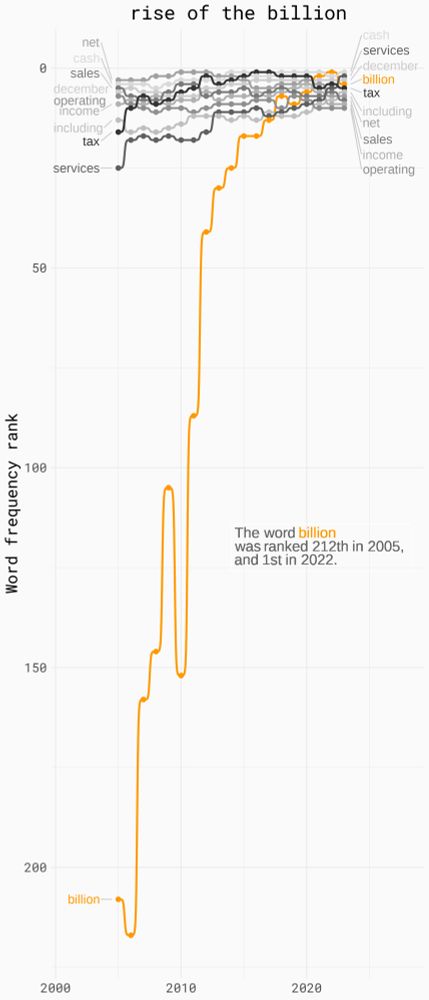
Text data from Amazon's annual reports for this week's #tidytuesday. A meteoric rise in how frequently the word 'billion' appears.
(It's a looong graph!)
Code: github.com/ivabrunec/ti...
Yeah they're definitely not, but how close are we to genuine machine reasoning? I was more thinking about how human behavior is changing in response to AI models generally
26.03.2025 14:22 — 👍 0 🔁 0 💬 1 📌 0With the rise of everyday LLM use, do we think people are getting better at describing things verbally, or just lazier and rely more on re-prompting? Or a third thing, purposeful and goal-driven alignment with LLM language to get the most out of prompts?
26.03.2025 14:17 — 👍 0 🔁 0 💬 1 📌 0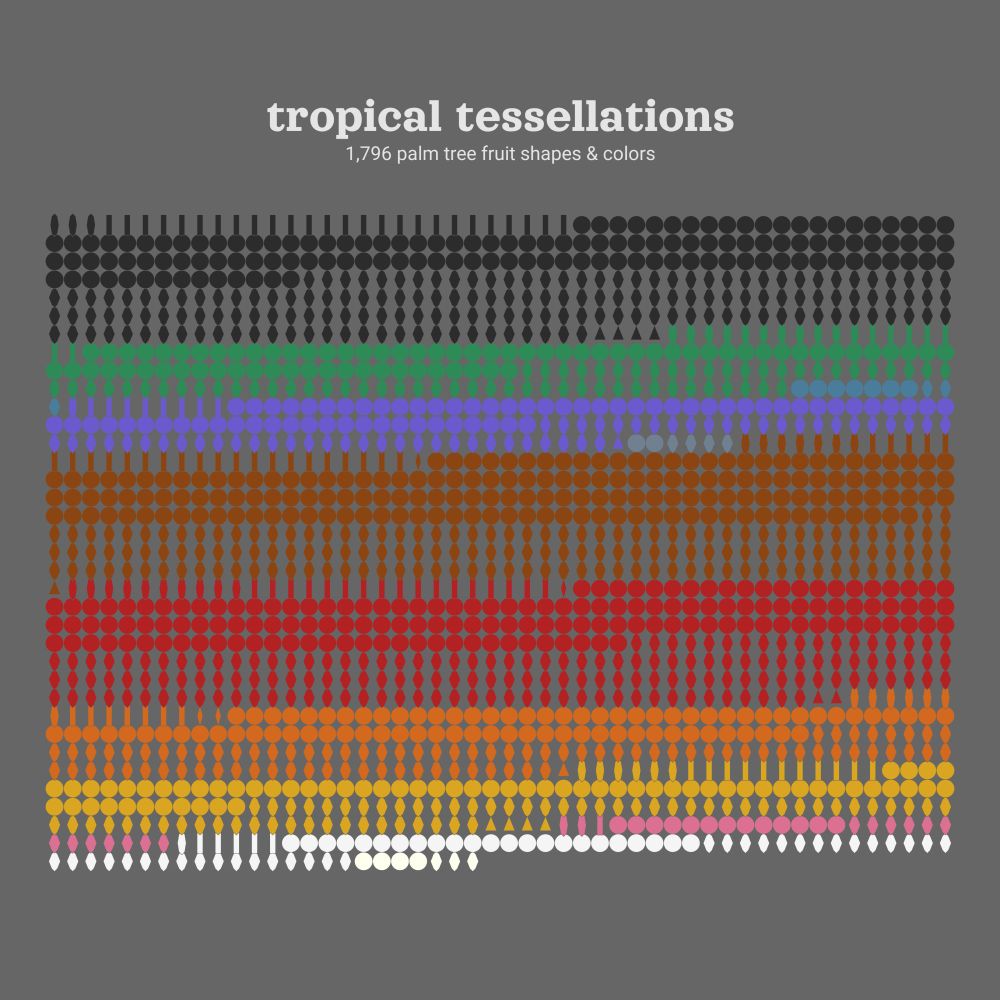
I'm a full week behind, but here's last week's #tidytuesday visualizing palm tree data: exploring a grid layout of many tiny polygons, each representing the shape and color of a fruit in the database.
Code: github.com/ivabrunec/ti...