S&P Composite 1500 – Advance Decline Line continuing to push to new highs
08.02.2026 15:12 — 👍 0 🔁 0 💬 0 📌 0

US Stocks Watchlist – 9 February 2026 - Stage Analysis
There are 20 stocks highlighted from the weekends US stocks watchlist scans...
New Blog Post: US Stocks Watchlist – 9 February 2026
There are 20 stocks highlighted from the weekends US stocks watchlist scans – $SNDK, $AZN, $DECK
www.stageanalysis.net/blog/1366195...
08.02.2026 00:50 — 👍 0 🔁 1 💬 0 📌 0

$QQQ Nasdaq 100 daily chart
05.02.2026 17:41 — 👍 0 🔁 0 💬 0 📌 0

UK Stocks – FTSE 100 Leaders:
LSE tickers – AAL, RIO, BEZ, VOD, LLOY, SSE, HSBA, NWG, PRU
Register your interest for the upcoming UK version of the Stage Analysis Screener at: uk.stageanalysis.net
04.02.2026 13:18 — 👍 0 🔁 0 💬 0 📌 0


Multiple stocks from the Commodity Chemicals group approaching or moving into early Stage 2
Commodity Chemicals stocks:
MEOH, DOW, TROX, WLK, BAK, OLN, KOP, LYB, KRO, CMT, SHECY, OEC, VVV, LOOP, ASIX, CBT, PCT, GURE, TSE, TANH, FMST, HWKN
04.02.2026 12:45 — 👍 0 🔁 0 💬 0 📌 0

Market Breadth: Advance Decline Line (S&P Composite 1500)
04.02.2026 01:20 — 👍 0 🔁 0 💬 0 📌 0

US Stocks Watchlist – 4 February 2026 - Stage Analysis
There were 16 stocks highlighted from the US stocks watchlist scans today...
New Blog Post: US Stocks Watchlist – 4 February 2026
There were 16 stocks highlighted from the US stocks watchlist scans today – $GOOGL, $URA, $UFO
www.stageanalysis.net/blog/1365238...
04.02.2026 01:17 — 👍 0 🔁 0 💬 0 📌 0

UK Stocks – RS Leaders:
FRES, ANTO, GLEN, AAF, AAL, STAN, RIO, BARC, LLOY
Register your interest for the upcoming UK version of the Stage Analysis Screener at: uk.stageanalysis.net
03.02.2026 01:21 — 👍 1 🔁 0 💬 0 📌 0

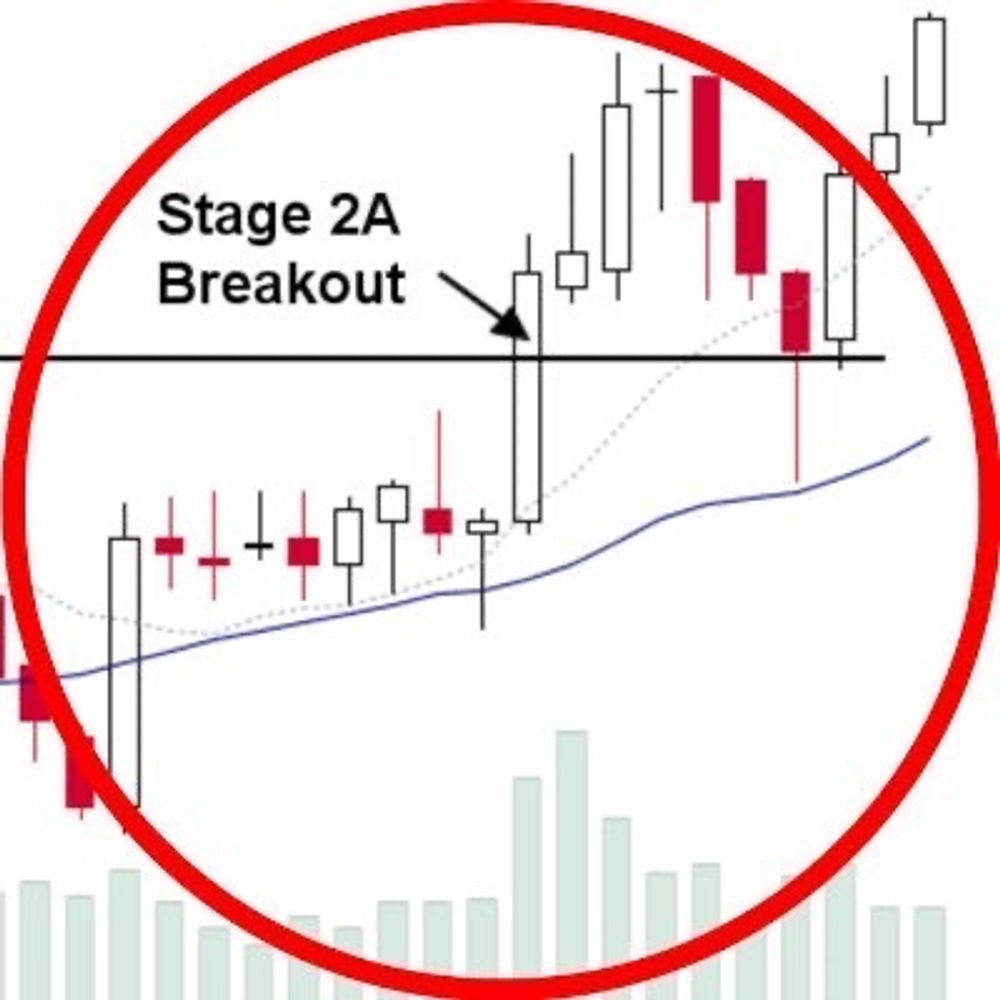
Stage 2 breakout attempts (Large Cap) – $VZ, $CMCSA, $PEP, $LIN, $DECK, $APD
02.02.2026 00:35 — 👍 0 🔁 0 💬 0 📌 0

Stage 4 breakdown attempts (Large Cap) – $PLTR, $APP, $CRM, $HOOD, $SOFI, $SHOP
02.02.2026 00:31 — 👍 0 🔁 0 💬 0 📌 0

US Stocks Watchlist – 1 February 2026 - Stage Analysis
There are 21 stocks highlighted from the weekends US stocks watchlist scans...
New Blog Post: US Stocks Watchlist – 1 February 2026
There are 21 stocks highlighted from the weekends US stocks watchlist scans – $AMD, $AMZN, $LLY
www.stageanalysis.net/blog/1364850...
01.02.2026 17:00 — 👍 1 🔁 0 💬 0 📌 0

US Stocks Watchlist – 30 January 2025 - Stage Analysis
There were 18 stocks highlighted from the US stocks watchlist scans today...
New Blog Post: US Stocks Watchlist – 30 January 2025
There were 18 stocks highlighted from the US stocks watchlist scans today – $RAL, $SFTBY, $VIK
www.stageanalysis.net/blog/1364147...
30.01.2026 01:31 — 👍 0 🔁 0 💬 0 📌 0

US Stocks Watchlist – 28 January 2025 - Stage Analysis
There were 22 stocks highlighted from the US stocks watchlist scans today...
New Blog Post: US Stocks Watchlist – 28 January 2025
There were 22 stocks highlighted from the US stocks watchlist scans today – $META, $NET, $BE
www.stageanalysis.net/blog/1363935...
28.01.2026 01:20 — 👍 0 🔁 0 💬 0 📌 0

$CRWD Spring attempt
27.01.2026 15:21 — 👍 0 🔁 0 💬 0 📌 0

Mag 7 stocks – ordered by Stage Analysis Technical Attributes (SATA) and Mansfield Relative Strength
$GOOGL, $NVDA, $AMZN, $TSLA, $META, $AAPL, $MSFT
27.01.2026 13:30 — 👍 0 🔁 0 💬 0 📌 0

$NET Spring attempt
26.01.2026 14:46 — 👍 0 🔁 0 💬 0 📌 0

US Stocks Watchlist – 26 January 2026 - Stage Analysis
There are 20 stocks highlighted from the weekends US stocks watchlist scans...
New Blog Post: US Stocks Watchlist – 26 January 2026
There are 20 stocks highlighted from the weekends US stocks watchlist scans – $MSFT, $IREN, $MP
www.stageanalysis.net/blog/1363664...
25.01.2026 01:10 — 👍 0 🔁 0 💬 0 📌 0

Technical health of the sub-industry groups via the % of stocks per group above their 30 week moving averages
$SPY $QQQ $IWM
24.01.2026 17:09 — 👍 0 🔁 0 💬 0 📌 0


Stage Analysis Screener – Stage 2 Breakouts & Continuation Breakouts
TMC, WM, HLN, OGN, PBR, WMB, PBA, MGY, CL, WDFC, FRPT, JBS, LTH, GT, BCE, KT
24.01.2026 01:06 — 👍 0 🔁 0 💬 0 📌 0

Rare Earth stocks among this weeks strongest group themes
UAMY, USAR, TMC, CRML, UUUU, NB, TMQ, TMRC, REMX, REEMF, PPTA, ARRNF, IDR, MP
23.01.2026 21:35 — 👍 0 🔁 0 💬 0 📌 0

$Q strong follow through from this recent IPO into early Stage 2
22.01.2026 12:38 — 👍 0 🔁 0 💬 0 📌 0

US Stocks Watchlist – 22 January 2025 - Stage Analysis
There were 20 stocks highlighted from the US stocks watchlist scans today...
New Blog Post: US Stocks Watchlist – 22 January 2025
There were 20 stocks highlighted from the US stocks watchlist scans today – $CRWV, $EOSE, $IBB
www.stageanalysis.net/blog/1362788...
22.01.2026 02:04 — 👍 0 🔁 0 💬 0 📌 0
A web-app framework that includes everything needed to create database-backed web applications according to the Model-View-Controller (MVC) pattern.
[bridged from https://rubyonrails.org/ on the web by https://fed.brid.gy/ ]
Systematic trader, dad and husband - no ranking ;-) Green, liberal and social mind.
I like trading, dogs and a good margarita. I publish a weekly market overview and stream live futures charts with commentary during US RTH. cordovatrades.com
I write a daily column for https://pro.thestreet.com/author/helene-meisler on the markets. Worked at Cowen, GS, Cargill. Former Asian Expat: S'pore & Shanghai. Tennis fan. Love to cook.
Not a Nazi... and not SPAM(Appealing).
I'm New Greg from The Good Place and I like stuff you probably like. I like to stand up to bullies. Again, not a Nazi. No way you say? ...WAY.
Joking aside... 95% of these posts are super cereal.
Craft CMS plugin developer, builder of shiny tools;
modern day drifter, adventurous fool.
Consulting, Branding, Design, and Development
Unlimited training for Craft CMS and modern web development.
Head honcho at @craftcms.com
📍 Bend, Oregon
🔗 https://brandonkelly.io
Build bespoke content experiences with Craft. https://craftcms.com
Decade of Swing & Momentum Trading expertise.Follow me for insights & trade ideas. Let's beat the market! Inspired by Mark Minervini & Qullamaggie. BS free zone