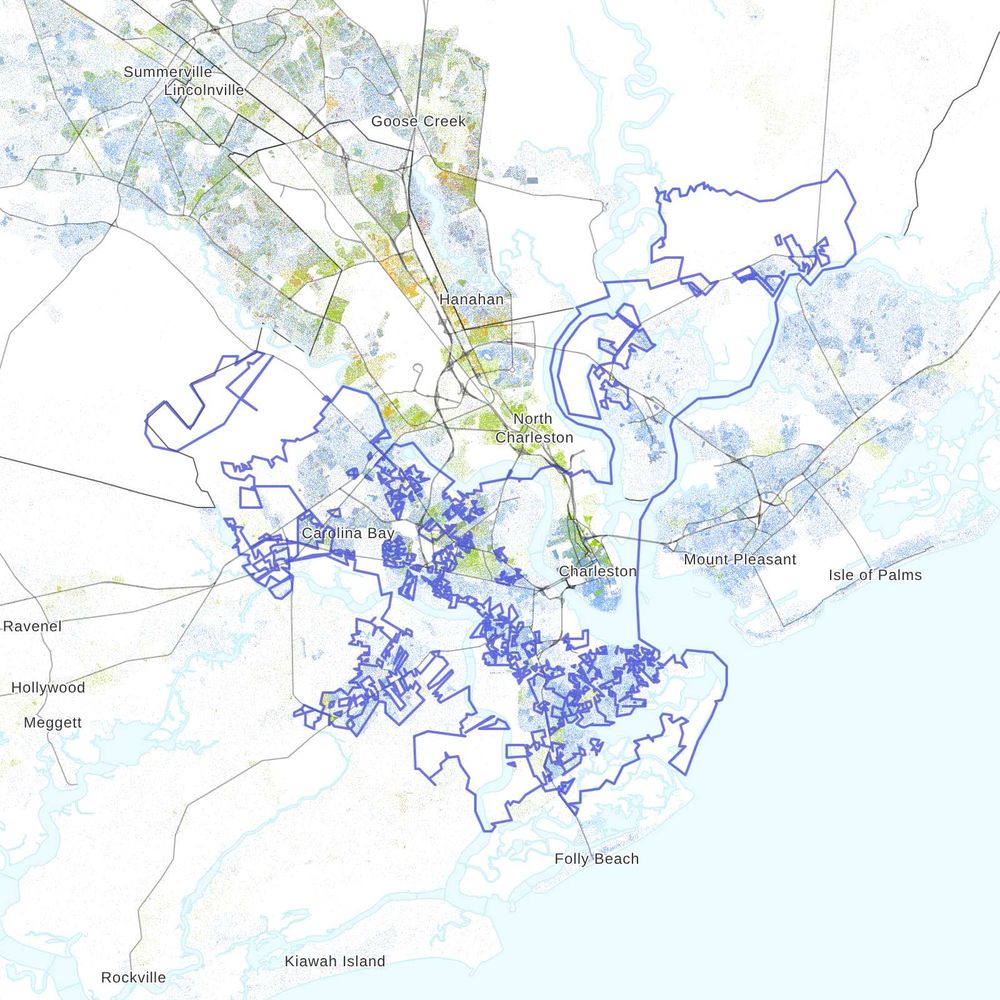
A dot map of Charleston, SC's population by race
A dot map of Charleston, SC's population by race, created using data from the 2020 US Census.
🔵 = White, 🟢 = Black, 🟠 = Hispanic, 🔴 = Asian, 🟤 = Native American/Other, 🟣 = Multiracial
Explore the map: https://www.censusdots.com/race/charleston-sc-demographics?src=bluesky
06.10.2025 18:00 — 👍 0 🔁 0 💬 0 📌 0

A dot map of Elgin, IL's population by race
A dot map of Elgin, IL's population by race, created using data from the 2020 US Census.
🔵 = White, 🟢 = Black, 🟠 = Hispanic, 🔴 = Asian, 🟤 = Native American/Other, 🟣 = Multiracial
Explore the map: https://www.censusdots.com/race/elgin-il-demographics?src=bluesky
05.10.2025 18:01 — 👍 0 🔁 0 💬 0 📌 0

A dot map of McKinney, TX's population by race
A dot map of McKinney, TX's population by race, created using data from the 2020 US Census.
🔵 = White, 🟢 = Black, 🟠 = Hispanic, 🔴 = Asian, 🟤 = Native American/Other, 🟣 = Multiracial
Explore the map: https://www.censusdots.com/race/mc-kinney-tx-demographics?src=bluesky
04.10.2025 18:01 — 👍 0 🔁 0 💬 0 📌 0

A dot map of Detroit, MI's population by race
A dot map of Detroit, MI's population by race, created using data from the 2020 US Census.
🔵 = White, 🟢 = Black, 🟠 = Hispanic, 🔴 = Asian, 🟤 = Native American/Other, 🟣 = Multiracial
Explore the map: https://www.censusdots.com/race/detroit-mi-demographics?src=bluesky
03.10.2025 18:00 — 👍 0 🔁 1 💬 0 📌 0

A dot map of Huntington Beach, CA's population by race
A dot map of Huntington Beach, CA's population by race, created using data from the 2020 US Census.
🔵 = White, 🟢 = Black, 🟠 = Hispanic, 🔴 = Asian, 🟤 = Native American/Other, 🟣 = Multiracial
Explore the map: https://www.censusdots.com/race/huntington-beach-ca-demographics?src=bluesky
02.10.2025 18:01 — 👍 0 🔁 0 💬 0 📌 0

A dot map of Raleigh, NC's population by race
A dot map of Raleigh, NC's population by race, created using data from the 2020 US Census.
🔵 = White, 🟢 = Black, 🟠 = Hispanic, 🔴 = Asian, 🟤 = Native American/Other, 🟣 = Multiracial
Explore the map: https://www.censusdots.com/race/raleigh-nc-demographics?src=bluesky
01.10.2025 18:00 — 👍 0 🔁 0 💬 0 📌 0
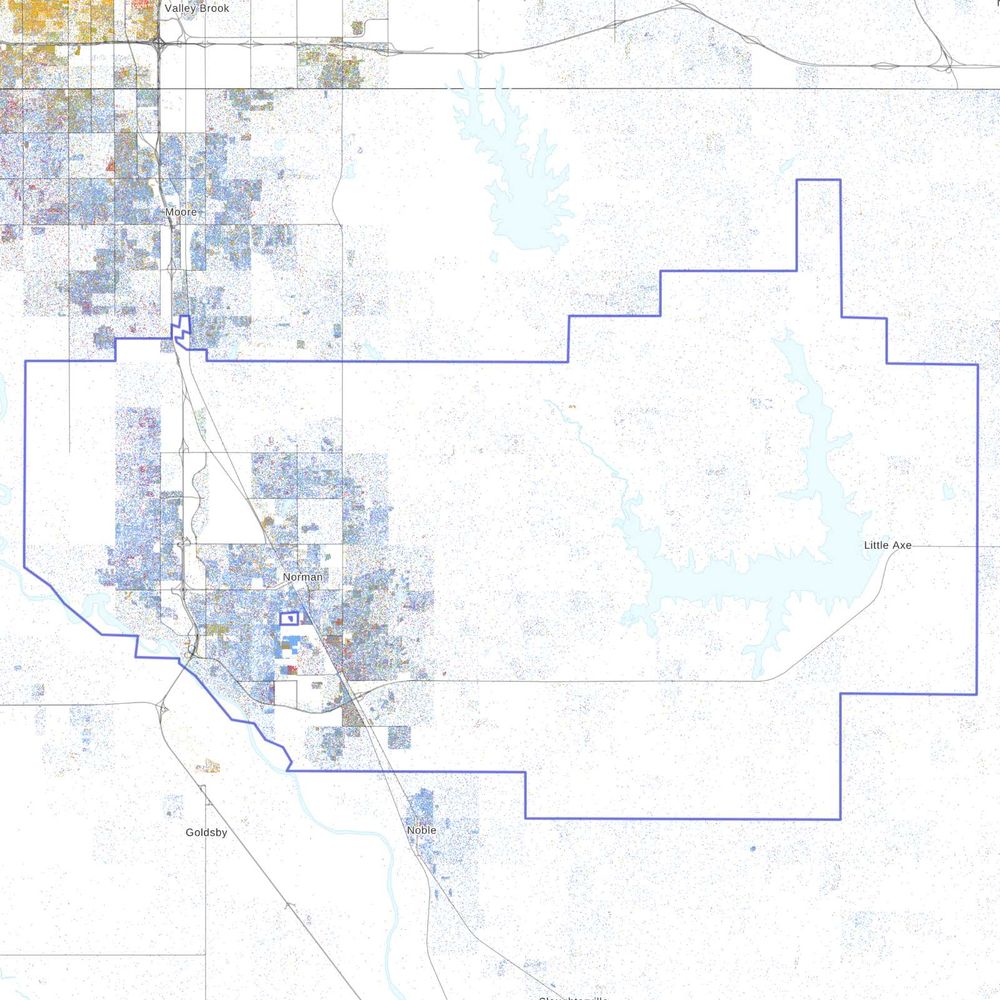
A dot map of Norman, OK's population by race
A dot map of Norman, OK's population by race, created using data from the 2020 US Census.
🔵 = White, 🟢 = Black, 🟠 = Hispanic, 🔴 = Asian, 🟤 = Native American/Other, 🟣 = Multiracial
Explore the map: https://www.censusdots.com/race/norman-ok-demographics?src=bluesky
30.09.2025 18:00 — 👍 0 🔁 0 💬 0 📌 0

A dot map of Hartford, CT's population by race
A dot map of Hartford, CT's population by race, created using data from the 2020 US Census.
🔵 = White, 🟢 = Black, 🟠 = Hispanic, 🔴 = Asian, 🟤 = Native American/Other, 🟣 = Multiracial
Explore the map: https://www.censusdots.com/race/hartford-ct-demographics?src=bluesky
29.09.2025 18:00 — 👍 1 🔁 0 💬 0 📌 0

A dot map of Savannah, GA's population by race
A dot map of Savannah, GA's population by race, created using data from the 2020 US Census.
🔵 = White, 🟢 = Black, 🟠 = Hispanic, 🔴 = Asian, 🟤 = Native American/Other, 🟣 = Multiracial
Explore the map: https://www.censusdots.com/race/savannah-ga-demographics?src=bluesky
28.09.2025 18:01 — 👍 0 🔁 0 💬 0 📌 0

A dot map of Sunnyvale, CA's population by race
A dot map of Sunnyvale, CA's population by race, created using data from the 2020 US Census.
🔵 = White, 🟢 = Black, 🟠 = Hispanic, 🔴 = Asian, 🟤 = Native American/Other, 🟣 = Multiracial
Explore the map: https://www.censusdots.com/race/sunnyvale-ca-demographics?src=bluesky
27.09.2025 18:01 — 👍 1 🔁 1 💬 0 📌 0

A dot map of Modesto, CA's population by race
A dot map of Modesto, CA's population by race, created using data from the 2020 US Census.
🔵 = White, 🟢 = Black, 🟠 = Hispanic, 🔴 = Asian, 🟤 = Native American/Other, 🟣 = Multiracial
Explore the map: https://www.censusdots.com/race/modesto-ca-demographics?src=bluesky
26.09.2025 18:00 — 👍 0 🔁 0 💬 0 📌 0

A dot map of Visalia, CA's population by race
A dot map of Visalia, CA's population by race, created using data from the 2020 US Census.
🔵 = White, 🟢 = Black, 🟠 = Hispanic, 🔴 = Asian, 🟤 = Native American/Other, 🟣 = Multiracial
Explore the map: https://www.censusdots.com/race/visalia-ca-demographics?src=bluesky
25.09.2025 18:00 — 👍 0 🔁 0 💬 0 📌 0

A dot map of Fort Lauderdale, FL's population by race
A dot map of Fort Lauderdale, FL's population by race, created using data from the 2020 US Census.
🔵 = White, 🟢 = Black, 🟠 = Hispanic, 🔴 = Asian, 🟤 = Native American/Other, 🟣 = Multiracial
Explore the map: https://www.censusdots.com/race/fort-lauderdale-fl-demographics?src=bluesky
24.09.2025 18:00 — 👍 0 🔁 0 💬 0 📌 0

A dot map of Yonkers, NY's population by race
A dot map of Yonkers, NY's population by race, created using data from the 2020 US Census.
🔵 = White, 🟢 = Black, 🟠 = Hispanic, 🔴 = Asian, 🟤 = Native American/Other, 🟣 = Multiracial
Explore the map: https://www.censusdots.com/race/yonkers-ny-demographics?src=bluesky
23.09.2025 18:01 — 👍 0 🔁 0 💬 0 📌 0
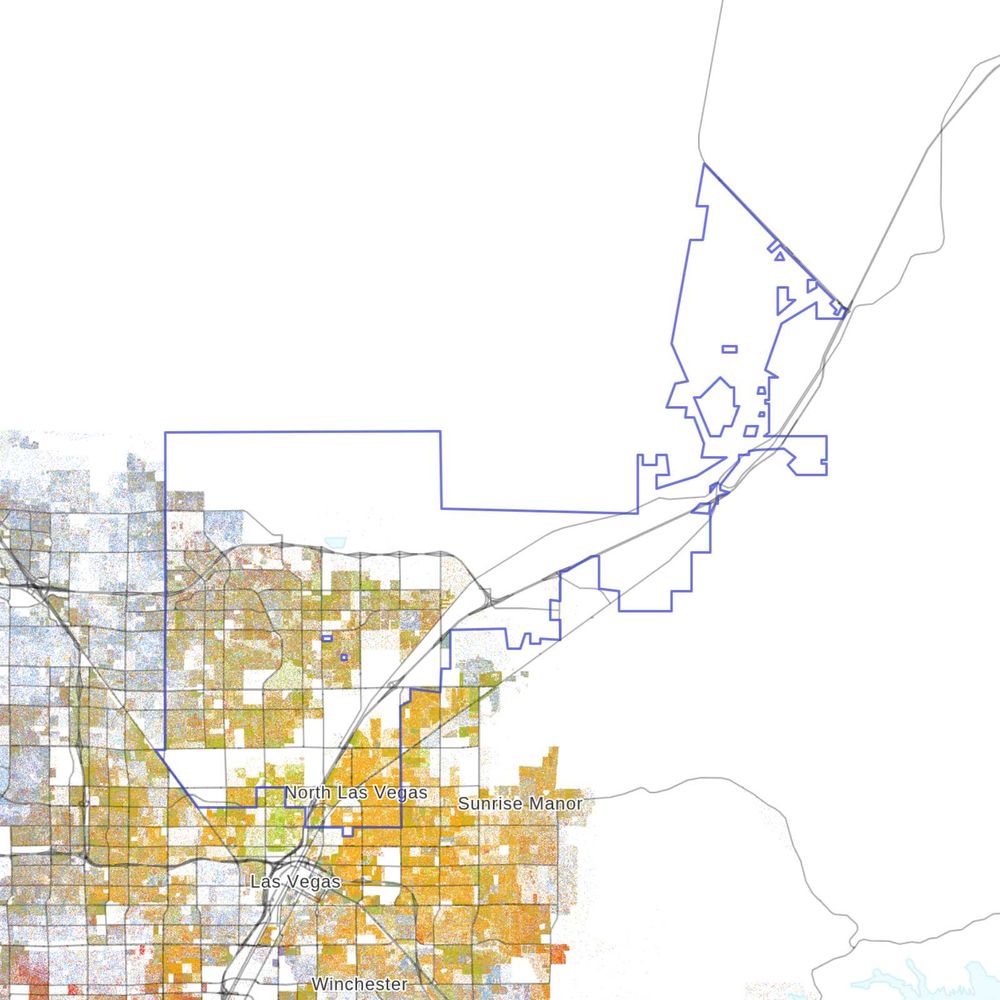
A dot map of North Las Vegas, NV's population by race
A dot map of North Las Vegas, NV's population by race, created using data from the 2020 US Census.
🔵 = White, 🟢 = Black, 🟠 = Hispanic, 🔴 = Asian, 🟤 = Native American/Other, 🟣 = Multiracial
Explore the map: https://www.censusdots.com/race/north-las-vegas-nv-demographics?src=bluesky
22.09.2025 18:00 — 👍 2 🔁 0 💬 0 📌 0
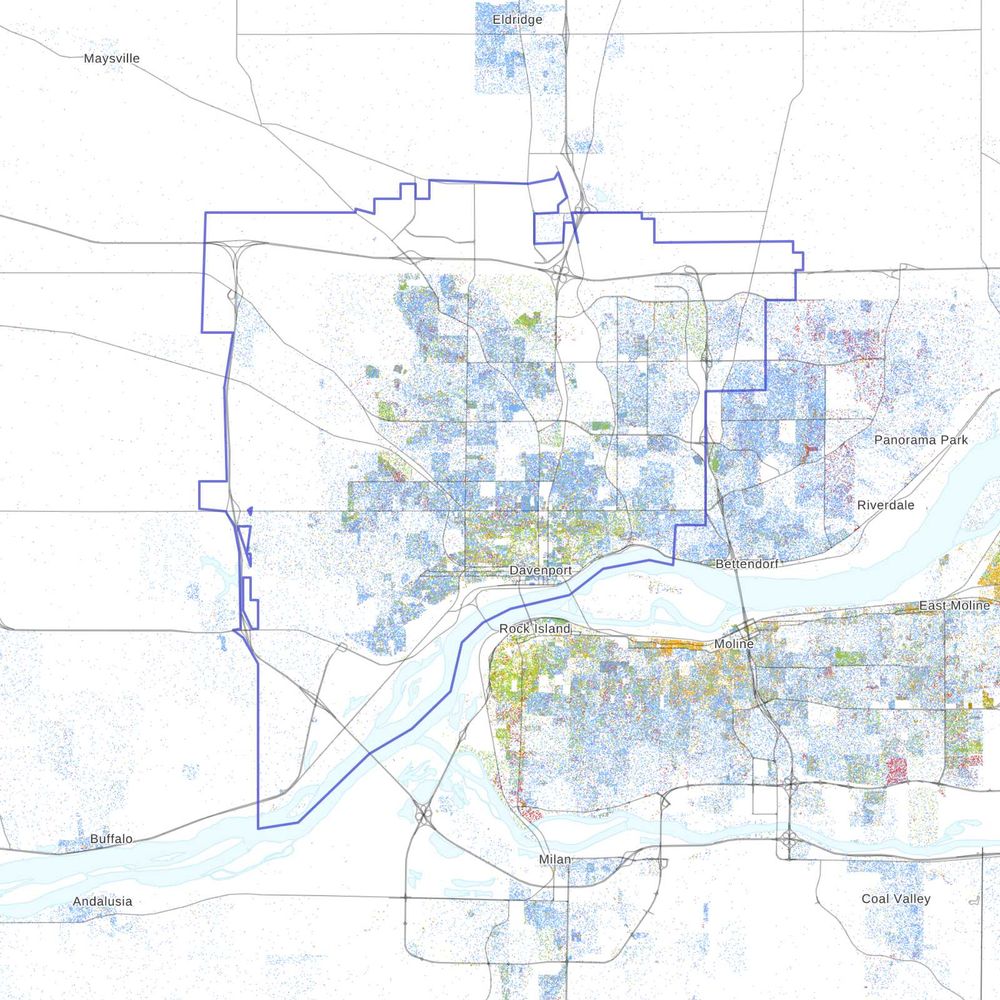
A dot map of Davenport, IA's population by race
A dot map of Davenport, IA's population by race, created using data from the 2020 US Census.
🔵 = White, 🟢 = Black, 🟠 = Hispanic, 🔴 = Asian, 🟤 = Native American/Other, 🟣 = Multiracial
Explore the map: https://www.censusdots.com/race/davenport-ia-demographics?src=bluesky
21.09.2025 18:01 — 👍 0 🔁 0 💬 0 📌 0

A dot map of Atlanta, GA's population by race
A dot map of Atlanta, GA's population by race, created using data from the 2020 US Census.
🔵 = White, 🟢 = Black, 🟠 = Hispanic, 🔴 = Asian, 🟤 = Native American/Other, 🟣 = Multiracial
Explore the map: https://www.censusdots.com/race/atlanta-ga-demographics?src=bluesky
20.09.2025 18:01 — 👍 1 🔁 0 💬 0 📌 0

A dot map of Pasadena, CA's population by race
A dot map of Pasadena, CA's population by race, created using data from the 2020 US Census.
🔵 = White, 🟢 = Black, 🟠 = Hispanic, 🔴 = Asian, 🟤 = Native American/Other, 🟣 = Multiracial
Explore the map: https://www.censusdots.com/race/pasadena-ca-demographics?src=bluesky
19.09.2025 18:00 — 👍 0 🔁 0 💬 0 📌 0

A dot map of Temecula, CA's population by race
A dot map of Temecula, CA's population by race, created using data from the 2020 US Census.
🔵 = White, 🟢 = Black, 🟠 = Hispanic, 🔴 = Asian, 🟤 = Native American/Other, 🟣 = Multiracial
Explore the map: https://www.censusdots.com/race/temecula-ca-demographics?src=bluesky
18.09.2025 18:00 — 👍 0 🔁 0 💬 0 📌 0
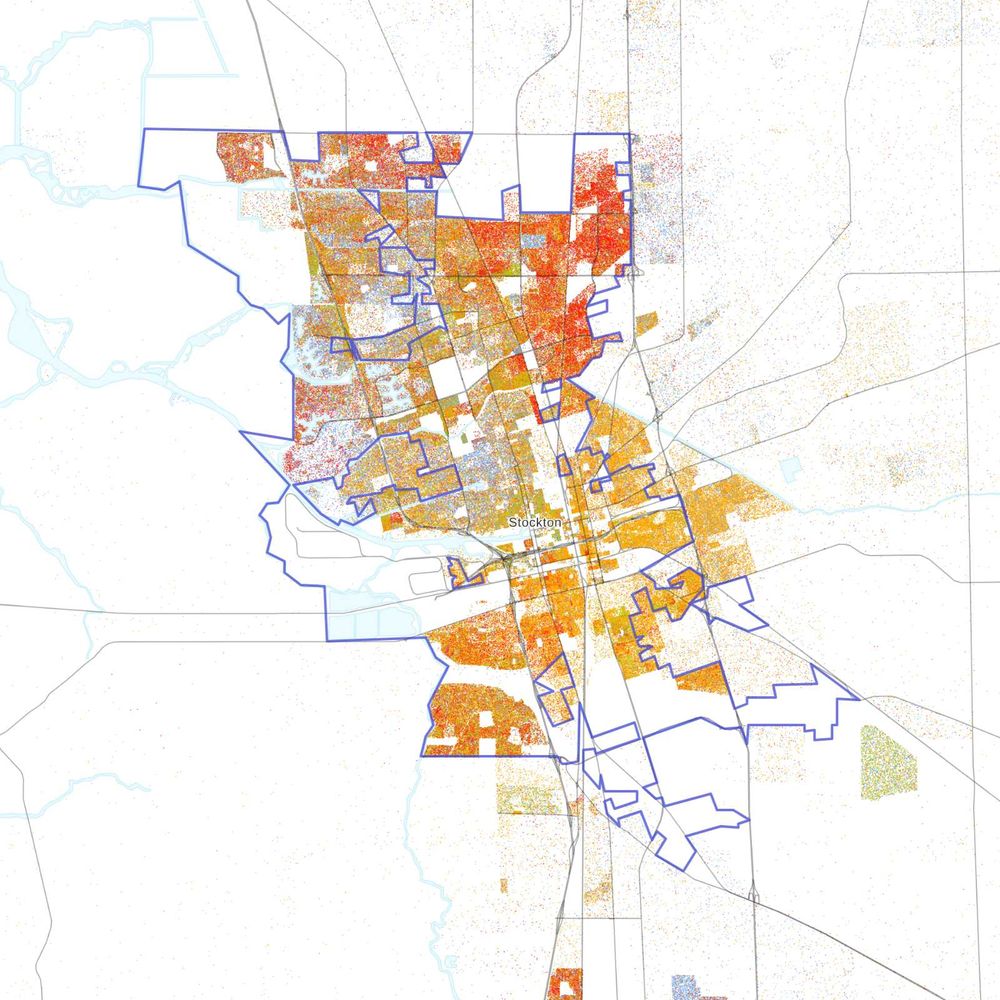
A dot map of Stockton, CA's population by race
A dot map of Stockton, CA's population by race, created using data from the 2020 US Census.
🔵 = White, 🟢 = Black, 🟠 = Hispanic, 🔴 = Asian, 🟤 = Native American/Other, 🟣 = Multiracial
Explore the map: https://www.censusdots.com/race/stockton-ca-demographics?src=bluesky
17.09.2025 18:00 — 👍 0 🔁 0 💬 0 📌 0

A dot map of Dayton, OH's population by race
A dot map of Dayton, OH's population by race, created using data from the 2020 US Census.
🔵 = White, 🟢 = Black, 🟠 = Hispanic, 🔴 = Asian, 🟤 = Native American/Other, 🟣 = Multiracial
Explore the map: https://www.censusdots.com/race/dayton-oh-demographics?src=bluesky
16.09.2025 18:01 — 👍 1 🔁 0 💬 0 📌 0

A dot map of High Point, NC's population by race
A dot map of High Point, NC's population by race, created using data from the 2020 US Census.
🔵 = White, 🟢 = Black, 🟠 = Hispanic, 🔴 = Asian, 🟤 = Native American/Other, 🟣 = Multiracial
Explore the map: https://www.censusdots.com/race/high-point-nc-demographics?src=bluesky
15.09.2025 18:00 — 👍 1 🔁 0 💬 0 📌 0

A dot map of Salt Lake City, UT's population by race
A dot map of Salt Lake City, UT's population by race, created using data from the 2020 US Census.
🔵 = White, 🟢 = Black, 🟠 = Hispanic, 🔴 = Asian, 🟤 = Native American/Other, 🟣 = Multiracial
Explore the map: https://www.censusdots.com/race/salt-lake-city-ut-demographics?src=bluesky
14.09.2025 18:00 — 👍 0 🔁 0 💬 0 📌 0

A dot map of Columbia, SC's population by race
A dot map of Columbia, SC's population by race, created using data from the 2020 US Census.
🔵 = White, 🟢 = Black, 🟠 = Hispanic, 🔴 = Asian, 🟤 = Native American/Other, 🟣 = Multiracial
Explore the map: https://www.censusdots.com/race/columbia-sc-demographics?src=bluesky
13.09.2025 18:00 — 👍 0 🔁 0 💬 0 📌 0

A dot map of League City, TX's population by race
A dot map of League City, TX's population by race, created using data from the 2020 US Census.
🔵 = White, 🟢 = Black, 🟠 = Hispanic, 🔴 = Asian, 🟤 = Native American/Other, 🟣 = Multiracial
Explore the map: https://www.censusdots.com/race/league-city-tx-demographics?src=bluesky
12.09.2025 18:00 — 👍 0 🔁 0 💬 0 📌 0
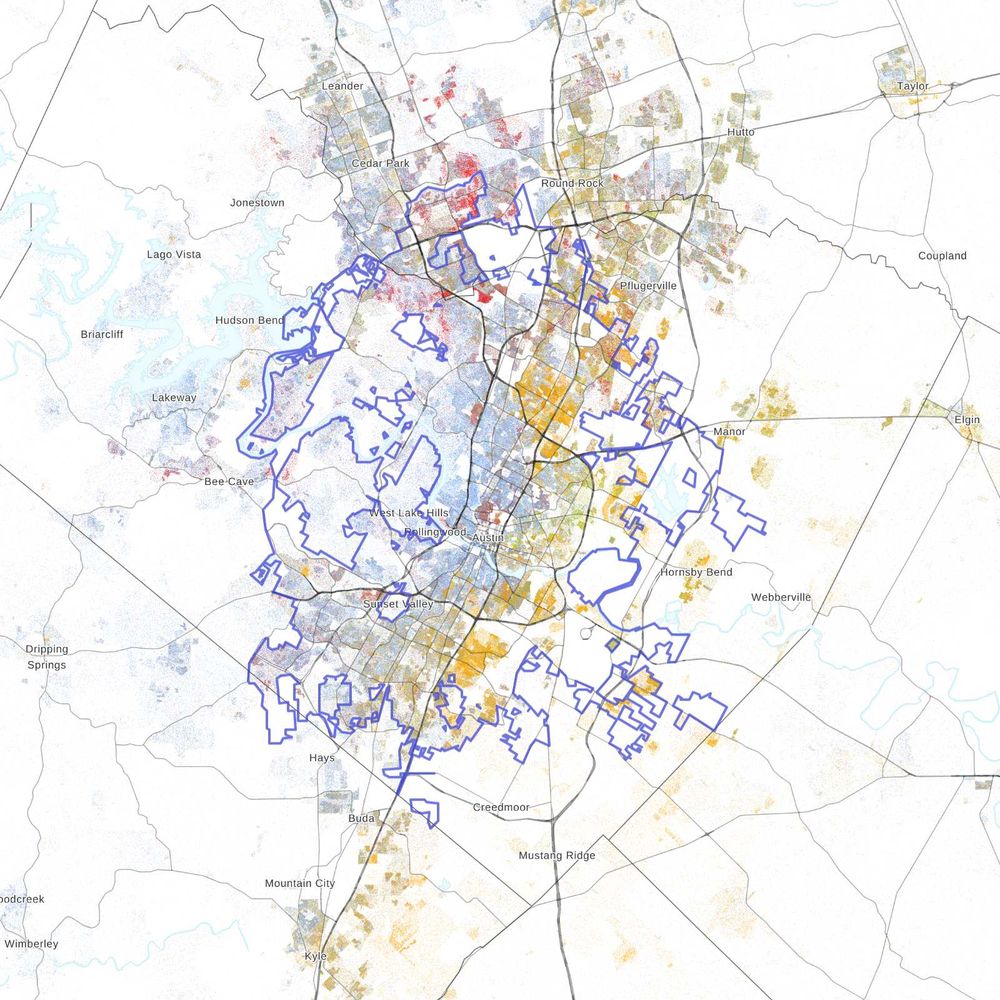
A dot map of Austin, TX's population by race
A dot map of Austin, TX's population by race, created using data from the 2020 US Census.
🔵 = White, 🟢 = Black, 🟠 = Hispanic, 🔴 = Asian, 🟤 = Native American/Other, 🟣 = Multiracial
Explore the map: https://www.censusdots.com/race/austin-tx-demographics?src=bluesky
11.09.2025 18:00 — 👍 0 🔁 0 💬 0 📌 0
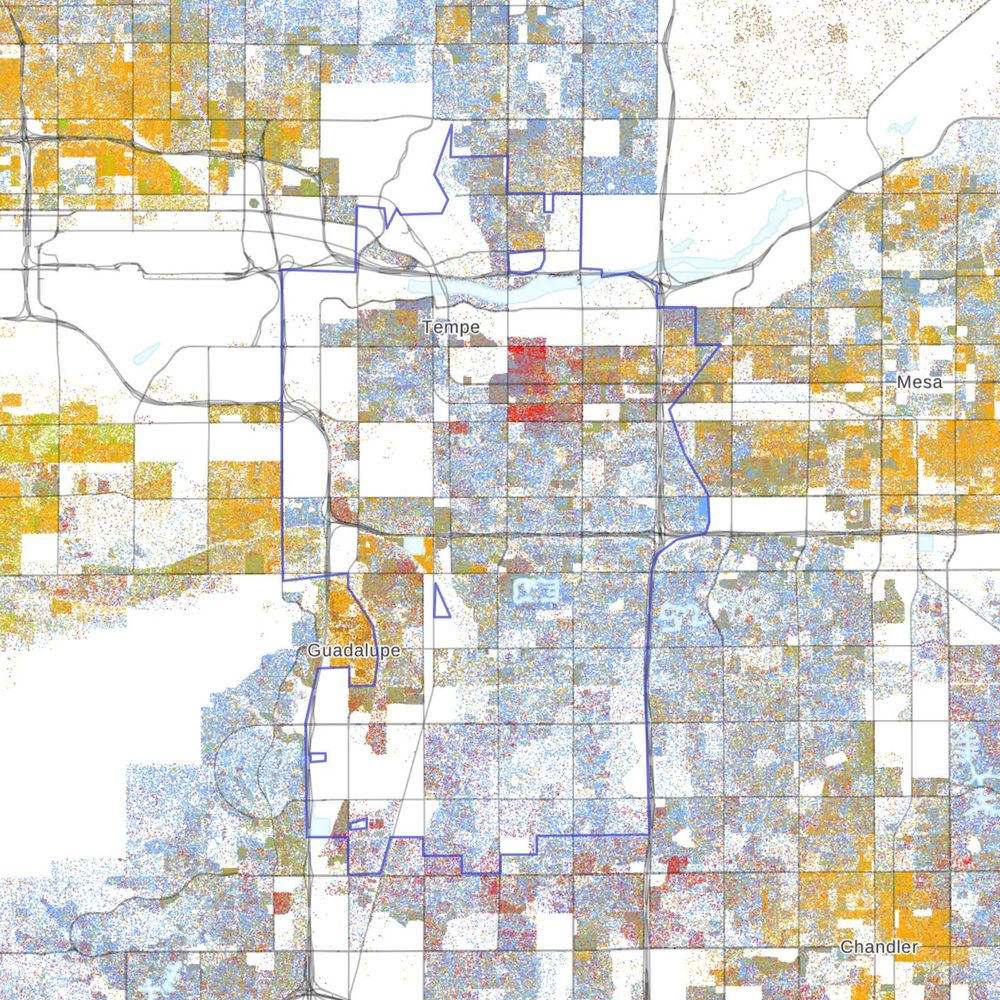
A dot map of Tempe, AZ's population by race
A dot map of Tempe, AZ's population by race, created using data from the 2020 US Census.
🔵 = White, 🟢 = Black, 🟠 = Hispanic, 🔴 = Asian, 🟤 = Native American/Other, 🟣 = Multiracial
Explore the map: https://www.censusdots.com/race/tempe-az-demographics?src=bluesky
10.09.2025 18:00 — 👍 0 🔁 0 💬 0 📌 0

A dot map of San Diego, CA's population by race
A dot map of San Diego, CA's population by race, created using data from the 2020 US Census.
🔵 = White, 🟢 = Black, 🟠 = Hispanic, 🔴 = Asian, 🟤 = Native American/Other, 🟣 = Multiracial
Explore the map: https://www.censusdots.com/race/san-diego-ca-demographics?src=bluesky
09.09.2025 18:00 — 👍 0 🔁 0 💬 0 📌 0

A dot map of Richmond, CA's population by race
A dot map of Richmond, CA's population by race, created using data from the 2020 US Census.
🔵 = White, 🟢 = Black, 🟠 = Hispanic, 🔴 = Asian, 🟤 = Native American/Other, 🟣 = Multiracial
Explore the map: https://www.censusdots.com/race/richmond-ca-demographics?src=bluesky
08.09.2025 18:00 — 👍 1 🔁 0 💬 0 📌 0

A dot map of Deltona, FL's population by race
A dot map of Deltona, FL's population by race, created using data from the 2020 US Census.
🔵 = White, 🟢 = Black, 🟠 = Hispanic, 🔴 = Asian, 🟤 = Native American/Other, 🟣 = Multiracial
Explore the map: https://www.censusdots.com/race/deltona-fl-demographics?src=bluesky
07.09.2025 18:00 — 👍 0 🔁 0 💬 0 📌 0
Developer of sorts at @firefox.com. No thought goes unpublished. He/him.
Pseudonymous osint.
Enjoy data, ships, planes, maps, simplicity, connectedness. Also, Baltics.
Judge me by my tweets.
http://mastodon.world/@auonsson backup 🇸🇪
'Peddler of Wheres,' job creator, Owner at The Map Center in Pawtucket RI- it's like a hip record store but for maps.
www.mapcenter.com
Cartographer, GIS specialist and educator
Linktr.ee/ecoandrewtrc
Investigator | Human Rights | Hybrid Wars
- Makes videos on maps, data & #OSINT
- Director of Investigations at @cen4infores.bsky.social
- Prev at BBC Africa Eye. Bellingcat contributor.
Penn State grad now Census employee. In my spare time I work on projects related to -- sociology, demography, geography, data science, simulation, religion, and health.
Retired regional transportation planner. #census #gis #progressive #SanFranciscoBayArea #ebicycling #hayward #eastbay #beer #wine #baseball
Data hobbyist. Political Geography. Progressive Politics. Urban Geography. Demographics. #AmericanCommunitySurvey
Data Science for Social Impact. Data justice. Climate justice. Emerging technology fellow U.S. Census Bureau
Demographer, survey methodologist, longitudinal surveys, Census Bureau data, public health, wellbeing, amateur blacksmith and weldor
PhD student in Computer Science & MA student in Education
Data Science Fellow at U.S. Census Bureau
CU Boulder | NSF GRFP | studying inequality in social systems and higher education | she/her | https://katiespoon.github.io/
Historical demographer | ISRDI Senior Research Scientist | IPUMS Full Count Census Data 1790-1950 | Kinship Networks | 10 gallon 🩸 donor
Former Data Analyst with the U.S. Census Bureau from New Albany, IN.
Previously worked for 3 local newspapers (2 in Indiana & 1 in Florida) in Photojournalism & Circulation Management.
Indiana University graduate.
A Blue dot 🔵 in a Red state 🔴.
i make maps and apps in nyc 🌃
Currently data-ing at US Census Bureau
Previously @beta.nyc
Graphics Journalist at Reuters Graphics (https://www.reuters.com/graphics/)
| Science Illustrator |
Formally doing infographics and dataviz at National Geographic
Side project: taiwandatastories.com
Made in Taiwan🇹🇼 legal Kiwi🇳🇿
Raleigh. How might we visualize people, fairly and equitably? Data / dataviz / design / psychology / research geek. He / him. Chaotic good. Follows Fizzlethorpe Bristlebane. Design / research / writing at https://3iap.com.
Dataviz designer & journalist at the Financial Times
Before: BBC News, UCB Biopharma, MIT Senseable City Lab | Northeastern alumni with Becarios Fundación La Caixa | In the past, 🇪🇸 in 🇺🇸 🇬🇧 🇩🇪
Website: https://irenedelatorrearenas.com
American 🇺🇸 Coloradan. Democracy enthusiast both domestically and abroad. Mostly post about Energy, demographics & Ukraine 🇺🇦
Demographics/post-Roman Britain historian.
Archives. Cats. Art. Writer.
Durham University
Contributor @the-downballot.com. Focusing on data, maps, and demographics. Find our data (and the CD hexmap template!) at https://the-db.co/data
Researcher at @harvard-jchs.bsky.social focused on housing, demographics, migration, inequality, and climate change.
Mostly tweeting about cities, climate change, demographics, land use, and housing econ on this account.
I post photos and facts about Jersey City, where I live.
Twitter:@jc_permits, @3_under_scores_
🇨🇴🇺🇲


