Screenshot of the abstract.
Citizen science projects are open to anyone contributing #data. Using a sample of 265 users, @dataandcrowd.bsky.social et al. statistically analyze edits to the mapping platform #OpenStreetMap to examine the impact of gender and age on spatial and temporal contribution patterns. buff.ly/G0TcE26
10.06.2025 21:02 — 👍 1 🔁 1 💬 0 📌 0
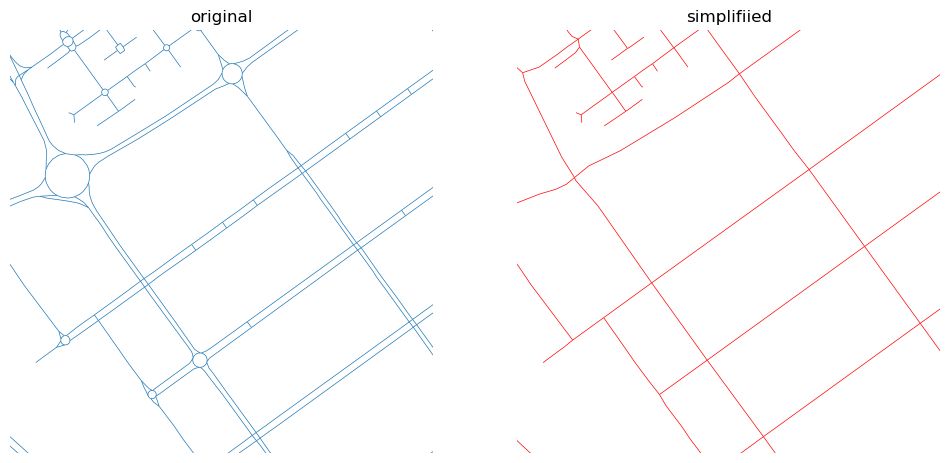
Original network on the left, simplified one on the right.
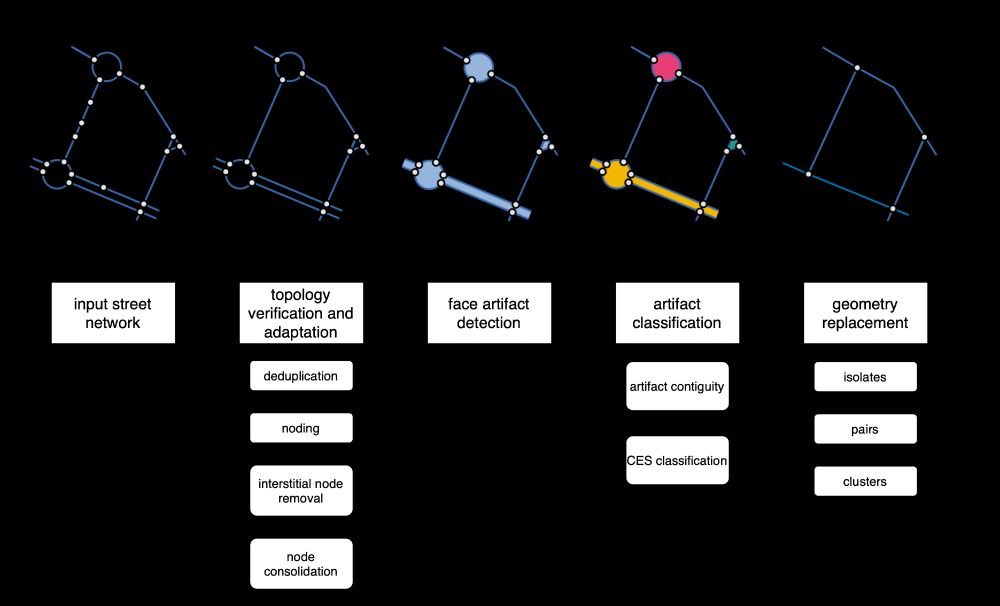
Diagram of the neatnet's workflow.

Image of face artifacts.
Ever needed to simplify street networks? I did. And it is a pain. So we wrote an algorithm that does that for us. And can do for you, as it is available as a Python package called `neatnet`.
Here's a short blog about it - martinfleischmann.net/simplificati... and package - uscuni.org/neatnet
28.04.2025 20:45 — 👍 80 🔁 19 💬 5 📌 0

Chart headed: Domestic transport emissions as proportion of all UK territorial greenhouse gas emissions, 1990-2023
Shows steady growth in proportion of GHG emissions that come from domestic transport over time. Driven largely by growth in proportion coming from domestic cars.
UK greenhouse gas emissions statistics for 2023 out today: www.gov.uk/government/s...
Graph shows proportion of territorial emissions from domestic transport, 1990-2023
In 1990 = c.16% (3rd highest emitting sector)
2023 = c.29% (1st)
Passenger cars = 16% of all emissions in 2023
06.02.2025 15:41 — 👍 8 🔁 7 💬 1 📌 1
Solving the challenges of interpolating NO 2 from SPRINT data and modelling population movements in agent-based modelling
| Socio-Environmental Systems Modelling
🚨Publication🚨
How can #agentbasedmodelling #ABM help generate dynamic air pollution fields from hourly fixed-site monitors and simulate population movement with OD matrices, including weekend activities?
Read our #SESMO paper to find out: doi.org/10.18174/ses...
28.12.2024 18:49 — 👍 0 🔁 0 💬 0 📌 0

Very interesting-looking new paper on whether and how much rail can reduce aviation emissions doi.org/10.1016/j.tr...
29.11.2024 13:59 — 👍 68 🔁 29 💬 3 📌 9

Very interesting-looking new article on car dependence led by an early-career researcher at our faculty doi.org/10.1080/0144...
25.11.2024 18:28 — 👍 44 🔁 10 💬 3 📌 3

Illustration showing rows in a dataframe getting grouped, then adding a new column

Illustration showing rows in a dataframe getting grouped, summarized, and ungrouped

Illustration showing rows in a dataframe getting grouped, summarized, and ungrouped

Note from the blog post showing links to download all these videos
More helpful (at least for me) resources from the blog archive: Seven (7!) tidyexplain-esque animations (downloadable and CC-licensed) showing how {dplyr}'s mutate(), summarize(), group_by(), and ungroup() all work together #rstats #dataskyence www.andrewheiss.com/blog/2024/04...
18.11.2024 17:26 — 👍 125 🔁 31 💬 8 📌 4

Title of a new peer-reviewed paper; The city-wide effects of tolling downtown drivers: Evidence from London’s congestion charge, Ian Herzog, November 2024, Journal of Urban Economics

Abstract: This paper studies effects of London’s Congestion Charge on regional traffic, commuting, and economic activity’s spatial distribution. London began tolling drivers into its central business district in 2003 and I find that the policy reduced traffic on untolled roads leading downtown. I build this effect into a quantitative model with heterogeneous skills, endogenous mode choice, and traffic externalities to examine effects on commuters. Simulations suggest that London’s Congestion Charge incentivizes driving to untolled workplaces and gives the region’s commuters positive net benefits. I also find that benefits are progressive because the policy reduces traffic where low-skill commuters live and work.
Congestion charging is good! 👇
www.sciencedirect.com/science/arti...
19.11.2024 11:00 — 👍 12 🔁 5 💬 1 📌 1
New arrival!
10.02.2024 20:34 — 👍 2 🔁 0 💬 0 📌 0
Outside compsci or engineering, it becomes harder to teach students new programming languages - so we stick with NetLogo and try to do good science.
10.02.2024 20:20 — 👍 1 🔁 0 💬 0 📌 0
This is the official Bluesky feed of the RGS-IBG Transport Geography Research Group.
✈️⛴️🚇🚆🚍🚘🚲🦽🚶
Posts about our work across all the modes.
Associate Prof at University of Nottingham. Quant health geographer. Spatial epi, infectious diseases, urban health equity. She/her👩🏻💻🗺️ 🇨🇦📍🇬🇧 sabrinalyli.com
r⁵py is an open-source Python package (wrapping R5) to compute multi-modal 🚲 🚃 🚗 🛼 travel time matrices, isochrones and other accessibility measures
By @christophfink.com, @htenkanen.bsky.social, @wklumpen.bsky.social, @urbandemog.bsky.social
GIScience Research UK (GISRUK) Conference. The largest academic GIS research conference in the UK!
www.gisruk.org
Interdisciplinary environmental research and education community at the University of Bristol. Food security, water, low carbon energy, city futures, environmental change, natural hazards & disaster risk, climate change & health. www.bristol.ac.uk/cabot
PhD student at Cornell Tech | he/him | cities + equity + spatial everything | fan of cats and Taylor Swift | gsagostini.github.io
assistant prof of city planning at SDSU- deeply affordable housing, zoning and land use, participation. Also a mom, wife, friend, cancer survivor, franco-américaine, NYC lover, pretty good cook, excellent eater, glasses enthusiast, and linen wearer.
Bringing you news and info about public transport and urban development projects around South Korea.
Managed by @kowiana.bsky.social and @nimedi.bsky.social
CEO of Bicycle Queensland 🚲 🚲 🚲 Transport and urban planning Prof from Brisbane, Australia. Cycling, walking, micro-mobility, public transport, urbanism, electrification, and more.
Full Prof, political science, UCLouvain | Chair of MethodsNET @methodsnet.bsky.social, global hub for #researchmethods #innovation & accessible #training | Into #QCA, comparison, #mixedmethods, multidata & cool collaborative projects | #methods pluralist
Understanding and supporting people in their spatial interactions through computational #spatial #data #science #giscience #melbourne 🛶🚵♂️🥾🏊♂️🐕
@unimelb, own views. support 🇺🇦 www.tomko.org
Background in geography, archaeology, & programming - agent-based evacuation models - high performance computing - geographic information systems - learning Bangla - interested in many things - UIUC CIGI Lab & CyberGIS Center - She/they
GIS and cartography @EU_eurostat (previously @ignfrance.bsky.social), geographical information, maps, orienteering, bike, nature, Europe, Luxembourg, Marseille, Haut-Doubs
https://jgaffuri.github.io/
GIScience conference series #giscience2025.
The 13th International Conference on Geographic Information Science, Christchurch, New Zealand August 26-29 2025.
https://giscience2025.org
▪︎ Texas A&M, Landscape Architecture and Urban Planning ▪︎ Cities, technology, analytics, etc. ▪︎ http://tomwsanchez.com/
Assistant Professor of Urban Technology at University of Michigan | Studying #race #equity #data #tech #housing | PhD at MIT | he/him.
I am an advocate in the United States for infrastructure & transportation improvements which will save lives, for not just for the drivers of motor vehicles, but also the most vulnerable road users such as bicyclists, pedestrians and the disabled.
Geographer, Lecturer in Urban Data Science at the University of Leeds, specialising in research at the intersection of giscience, epidemiology, public health, and urban studies. https://environment.leeds.ac.uk/staff/12888/dr-yuchen-li
Insights on 🧑🤝🧑 People, 🏡 Places and 🏭 Firms
🟢Website https://oe.cd/5Q6
🟠Newsletter http://oe.cd/CFEnews
🟣Blog http://oecdcogito.blog
🔵Director @lamiakamalchaoui.bsky.social