speed gauge chart in excel. it is actually two superimposed charts, a donut chart and a pie chart. they have an empty 100 filler series, the value series and a remainder series. the arrow is a 1% slice with black outline (rest of the pie is invisible)
I made a reusable speed gauge NPS chart in Excel
and now you have to see this abomination too 📊
12.03.2025 18:40 — 👍 13 🔁 1 💬 0 📌 1
THEY’RE CLIMBING THE POLES IN TOKYO GO BIRDS🦅🦅🦅
10.02.2025 03:27 — 👍 11462 🔁 2201 💬 108 📌 198
Huge spillover effects on the broader relish industry
21.11.2024 15:16 — 👍 0 🔁 0 💬 0 📌 0
Please check it out and let me know if anything breaks with it! This is version 1.0 and I wrote it in about two hours so I'm sure there will be problems that arise! I'll also likely add more functionality as time goes on.
20.11.2024 14:32 — 👍 0 🔁 0 💬 0 📌 0

And since this command is just a simple wrapper for the -twoway line- command, all other -twoway- options are available:
trendline gdp_percap if inlist(regnum,1,2), time(year) category(regnum) lpattern(dash)
20.11.2024 14:32 — 👍 0 🔁 0 💬 1 📌 0

Average GDP per Capita for East Asia and Europe, 1990-2022.
-if- statements are also allowed with the command:
trendline gdp_percap if inlist(regnum,1,2), time(year) category(regnum)
20.11.2024 14:32 — 👍 0 🔁 0 💬 1 📌 0

Median GDP per Capita by world region, 1990-2022.
You can also change the statistic (any statistic available in the -collapse- command):
trendline gdp_percap, time(year) category(regnum) statistic(median)
20.11.2024 14:32 — 👍 0 🔁 0 💬 1 📌 0

Average GDP per capita by region of the world, 1990-2022.
And you can plot by group:
trendline gdp_percap, time(year) category(regnum)
20.11.2024 14:32 — 👍 0 🔁 0 💬 1 📌 0

Trend line of average GDP per Capita for all the countries in the World Bank database, 1990-2022.
The simplest form of the command plots mean values over time for your entire dataset:
trendline gdp_percap, time(year)
20.11.2024 14:32 — 👍 0 🔁 0 💬 1 📌 0
You can download it using this command:
net install trendline, from("https://raw.githubusercontent.com/jdcols01/trendline/main/installation/") replace
And then just type -help trendline- for the documentation.
20.11.2024 14:32 — 👍 0 🔁 0 💬 1 📌 0
I used to use -lgraph- but since it doesn't appear to have been updated in nearly a decade, the new -twoway- functions in Stata don't seem to work with it very well. This new package is a MUCH slimmer version purely for plotting aggregates over time. It is particularly useful for multi-level data.
20.11.2024 14:32 — 👍 0 🔁 0 💬 1 📌 0

GitHub - jdcols01/trendline: Stata package for aggregate trendlines while preserving data structure
Stata package for aggregate trendlines while preserving data structure - jdcols01/trendline
Hey folks! Wanted to share a 🧵 on a super slim Stata package I put together for making aggregate line graphs by group while preserving your data structure. It's called -trendline- and you can find it on my GitHub here: github.com/jdcols01/tre...
20.11.2024 14:32 — 👍 2 🔁 0 💬 2 📌 0
Louisville beating Clemson and then losing to Stanford. This is absurd. Why would UK do this to us
17.11.2024 00:16 — 👍 0 🔁 0 💬 0 📌 0

Stata graph tips for academic articles
Learn tips and tricks for optimizing Stata graphs for journal articles.
Reposting this #Stata guide I wrote a couple of years ago that discusses how to finetune #graphs for academic/journal articles.
The guide covers topics such as colors, legends, fonts, markers, focusing on certain elements etc.
medium.com/the-stata-gu...
16.11.2024 13:19 — 👍 53 🔁 15 💬 0 📌 1
Economics of funny
13.11.2024 12:36 — 👍 0 🔁 0 💬 0 📌 0
Regression is a tool for making comparisons
If you don't know / can't easily explain what comparisons you're trying to make, then you don't understand the regression you're running
13.11.2024 07:02 — 👍 282 🔁 46 💬 10 📌 1
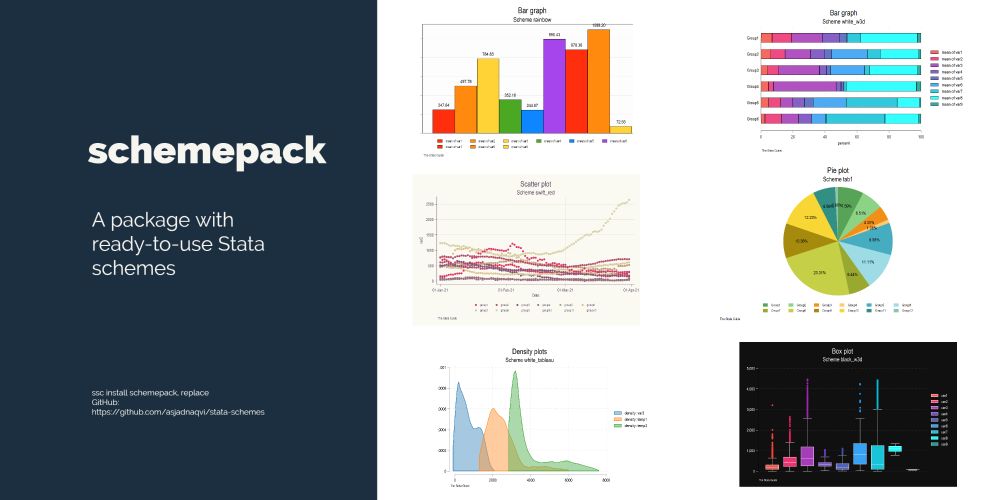
GitHub - asjadnaqvi/stata-schemepack: Here you will find various ready-to-use Stata schemes.
Here you will find various ready-to-use Stata schemes. - asjadnaqvi/stata-schemepack
A 🧵 to keep track of my #Stata #dataviz packages. Regularly updated! Check GitHub links for more info.
Listed in the order they were released 👇
1) 𝘀𝗰𝗵𝗲𝗺𝗲𝗽𝗮𝗰𝗸: A large collection of ready-to-use #Stata #schemes.
ssc install schemepack, replace
github.com/asjadnaqvi/s...
12.11.2024 21:07 — 👍 24 🔁 4 💬 1 📌 1

GitHub - asjadnaqvi/stata-spider: spider: A Stata package for spider plots.
spider: A Stata package for spider plots. Contribute to asjadnaqvi/stata-spider development by creating an account on GitHub.
#Stata #spider 🕷️is bumped to v1.4:
🕸️ Weights 🏋 are now allowed and users can also specify how they want to collapse the data.
🕸️ Users can now specify variable lists (wide form) making it easier to use.
🕸️ More options added.
More info and examples:
github.com/asjadnaqvi/s...
Up soon on SSC!
04.10.2024 15:19 — 👍 6 🔁 1 💬 0 📌 0

Too late to explore the world, too soon to explore the universe...
17.09.2024 02:50 — 👍 1 🔁 0 💬 0 📌 0
Why am I spending my Saturday wondering why Hoxby & Turner (2013) postcard intervention did not replicate when Gurantz and the College Board crew expanded it and what that means for information interventions in this post-sffa world?
07.09.2024 20:47 — 👍 7 🔁 1 💬 0 📌 0
"We conclude that racial and ethnic minorities are inadequately served by our large household surveys [from census] and that researchers should cautiously interpret survey-based estimates of racial and ethnic differences in [safety net] program receipt and post-benefit income."
26.08.2024 17:49 — 👍 15 🔁 9 💬 0 📌 0
Colston: You gotta go full onebag mode. Whatever doesn't fit in a backpack throw away
16.08.2024 17:30 — 👍 0 🔁 0 💬 0 📌 1
I tried making a starter pack for the U.S. higher ed folks on here (after looking for one and not finding it myself). Includes researchers, journos, and just people who talk about higher ed stuff. Let me know who I missed!
go.bsky.app/71aQ6gS
16.08.2024 16:37 — 👍 7 🔁 4 💬 1 📌 0
I haven't been a reviewer much, but the last review I did I was just sent another Word doc with a message that basically said "the authors have addressed your concerns". With no mention of how. I basically did a side-by-side word search after going back to my original comments!!
27.06.2024 02:27 — 👍 0 🔁 0 💬 1 📌 0
Excited to announce that I'm joining the SSTAR Lab at UW-Madison as Lead Data Scientist! Can't thank PNPI enough for the opportunity to be their Associate Director of Research. Looking forward to this next prof. chapter!
24.04.2024 20:53 — 👍 4 🔁 0 💬 0 📌 0
Excited to announce the new and greatly improved -waffle- package available currently on GitHub (and SSC soon)! From my first-ever Stata package using Asjad's waffle plot guide to collaborating on this massively improved version! Just in time for waffle day on the #30DayChartChallenge
04.04.2024 14:27 — 👍 7 🔁 0 💬 0 📌 0
PhD Candidate @Harvard Gov. Political Economist researching on the politics of opportunity. Credit Access, Education, and Labor Market policy in US, Germany, and Japan + affects on global financial stability. On the market.
https://www.danieltroberts.com/
Stand-Up 🎤
Comedy promoter/booker at Planet of the Tapes in Louisville, KY 📼
Photographer of vibes 📸🛸 (groovelyphoto.bsky.social)
https://www.planetofthetapes.biz/events
GESIS @gesis.org | Dept. DiCoDe, MPIDR @mpidr.bsky.social | DemoSocUPF @demosocupf.bsky.social #FirstGen
Democratic Socialists of America chapter for the Louisville metropolitan area @demsocialists.bsky.social
🌹 dsalouisville.org
We are a progressive grassroots political party building a multiracial, feminist movement of working people. Text WFP to 30403 to join us.
linktr.ee/workingfamilies
The original and only WomensArt....
Real art...real artists
Images © to respective owners
ding ding
https://linktr.ee/howelldawdy
Professor. Sociologist. NYTimes Opinion Columnist. Books: THICK, LowerEd. Forthcoming: 1)Black Mothering & Daughtering and 2)Mama Bears.
Beliefs: C.R.E.A.M. + the internet ruined everything good + bring back shame.
“I’m just here so I don’t get fined.”
The Bluesky account of the American Sociological Association's Inequality, Poverty, and Mobility section
https://www.asanet.org/asa_sections/inequality-poverty-and-mobility/
Executive Director @arrc.bsky.social | Professor of Higher Ed @appalachianstate.bsky.social | PI @ruraltalentlabs.bsky.social | Studying rural higher ed | Rescue dog dad | National Parks enthusiast | Amateur chef | Proud Appalachian | 🏳️🌈
Senior economist and deputy director of research at the @upjohninstitute. My research focuses on the transition between education and career and how employers hire and compensate workers. Creator of New Hires Quality Index. #NHQI
Executive Director, @KyPolicy
Budding Rural Queer Scholar🌱. Middle School English, Creative Writing, & Theatre Teacher. Advocate. Traveler. he/him. Learning Everyday💛
classically trained artist.
theartofpants.com
The Kentucky Lantern is a nonpartisan, nonprofit, free news service. We provide factual, fair, independent journalism.
Education policy researcher, DC sports lover, Duke Delta, and reality tv watcher. Working behind enemy lines
https://linktr.ee/drconstance
The Hamilton Project at @brookings.edu produces research and policy proposals on how to create a growing economy that benefits more Americans. www.hamiltonproject.org