Interested in getting a short overview of the latest geospatial papers and datasets each week?
Subscribe to the Spatial Edge newsletter: yohan.so

@yohan.so.bsky.social
Sharing insights from the intersection of geospatial data science and economics | PhD in Economic Geography from LSE | Data Scientist at ADB. Views are my own. Newsletter: http://spatialedge.co
Interested in getting a short overview of the latest geospatial papers and datasets each week?
Subscribe to the Spatial Edge newsletter: yohan.so
𝘁𝗹;𝗱𝗿
1. nightlights can capture certain elements of consumption and production
2. the level of granularity when using nightlights really matters
𝗧𝗵𝗲 𝗸𝗲𝘆 𝘁𝗮𝗸𝗲𝗮𝘄𝗮𝘆:
The more you zoom in, the bigger these spatial mismatches between daytime and nighttime economic activity become.
This underrepresentation occurs even if:
• these areas generate a lot more economic activity (e.g. financial districts), compared to
• areas bustling with bars and restaurants
These nightlife areas tend to be overestimated in nightlights data.
As a result, it's likely that I:
• work during the day in one 500m2 pixel and
• spend money in a different pixel at night.
This implies that pixels with higher daytime economic activity will be systematically underrepresented in nightlights data.
This creates a discrepancy between areas where economic activity is generated during the day (London) vs at night (Essex).
With nightlights we can zoom into areas as small as 500m2.
In this example, the economic activity from my job in London doesn't get picked up by nightlights.
However, the places where I spend money at night in Essex, like restaurants, do light up and are visible from space.
2. Spatial Mismatches
Imagine I work in London but live in Essex, an hour away.
My work (i.e. production) contributes to London's economy.
But when I spend time in Essex, like eating out at night, that's where my consumption mainly happens.
The bottom line:
Nightlights can capture certain elements of consumption AND production.
So when doing an analysis using nightlights, we need to know the composition of production and consumption.
This is important to avoid double counting.
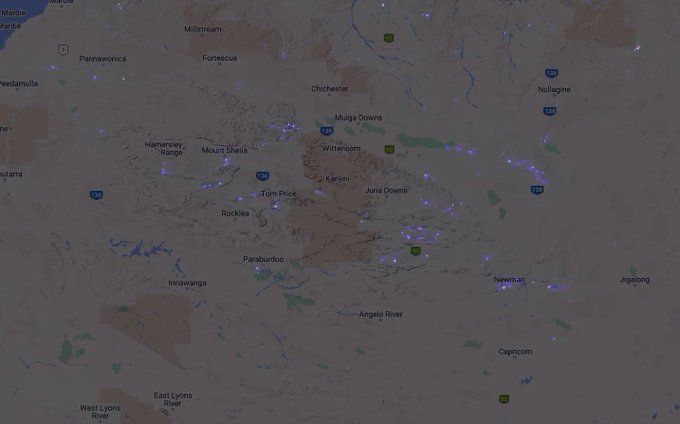
See this image of the Pilbara region in Australia
Here we see:
1. lights generated from mines being lit up at night (i.e. production-based economic activity), AND
2. lights generated by mining staff who are eating out at night (e.g. consumption-based economic activity).
But the reality is a bit more complex.
Nightlights can capture some production-related activities.
E.g. nighttime construction and nighttime mining.
However, we need to be careful about double counting.
E.g. combining production values with income and consumption figures without accounting for overlaps could distort things.
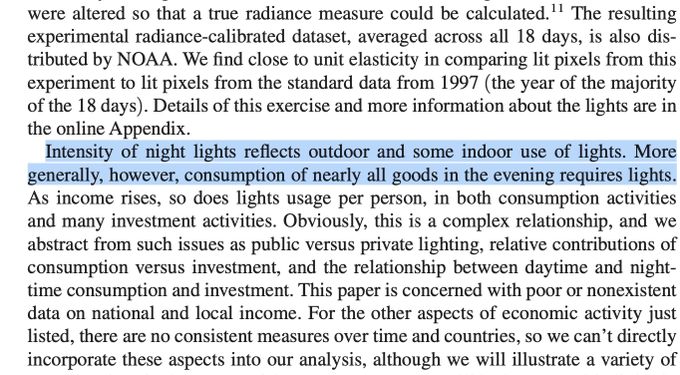
Henderson et al., essentially view nightlights as a measure of nighttime consumption:
However, GDP is typically measured in three ways:
1. Adding up all of the consumption in an economy
2. Adding up all of the income earned in an economy
3. Adding up the value of all things produced in an economy
For an entire country, these should equal one another.
1. Economic Activity
It’s vague to say nightlights capture ‘economic activity’.
What 𝙚𝙭𝙖𝙘𝙩𝙡𝙮 do we mean by economic activity?
The most popular paper on nightlights and economic activity is Henderson et al. (2012).
It uses nightlights as a proxy for real GDP growth.

If you're using nightlights you need to know about two things:
1. What 𝙩𝙮𝙥𝙚 of economic activity it captures, and
2. 𝙎𝙥𝙖𝙩𝙞𝙖𝙡 𝙢𝙞𝙨𝙢𝙖𝙩𝙘𝙝𝙚𝙨
Here's the breakdown (in simple terms):
Interested in getting a short overview of the latest geospatial papers and datasets each week?
Subscribe to the Spatial Edge newsletter: yohan.so
So: while AI is clearly going to play a massive role in geospatial analysis going forward, could it actually be overhyped?
28.04.2025 11:29 — 👍 0 🔁 0 💬 1 📌 0𝗪𝗵𝘆 𝘁𝗵𝗶𝘀 𝗮𝗹𝗹 𝗺𝗮𝘁𝘁𝗲𝗿𝘀
At the end of the day, autonomous GIS could make spatial analysis:
• More accessible to non-experts.
• Faster and more scalable.
• Capable of generating new insights.
It also forces GIScience to rethink education, ethics, and what it means to “know” geography
• Modeling: Automating complex analysis like disease spread or flood risk still requires human judgment.
• Trust and ethics: Who is responsible if a model makes a bad call? How do we ensure fairness?
However, several big hurdles remain:
• LLMs lack of GIS-specific knowledge (e.g., projections, spatial joins).
• Skills gap: LLMs don’t always know what tools to use or how to handle large files.
• Continuous learning: Most models can’t improve themselves after deployment.
• 𝗟𝗟𝗠-𝗖𝗮𝘁: Makes maps iteratively and improves them based on its own visual critique.
• 𝗚𝗜𝗦 𝗖𝗼𝗽𝗶𝗹𝗼𝘁: Helps QGIS users do analysis more efficiently.
𝗪𝗵𝗮𝘁 𝗖𝗮𝗻 𝗜𝘁 𝗗𝗼 𝗧𝗼𝗱𝗮𝘆?
The authors provide working examples:
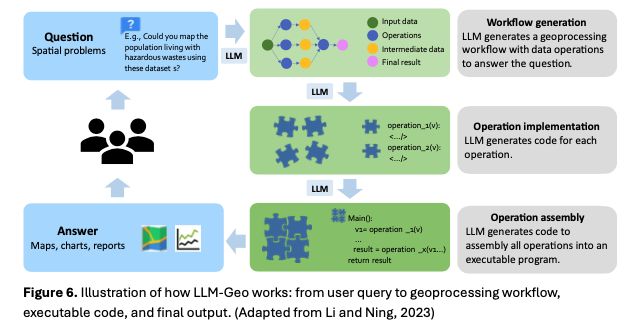
• 𝗟𝗟𝗠-𝗙𝗶𝗻𝗱: Automatically finds and downloads the right geospatial data.
• 𝗟𝗟𝗠-𝗚𝗲𝗼: Runs a complete spatial analysis—e.g., walkability around schools—by creating code and visualizing results.
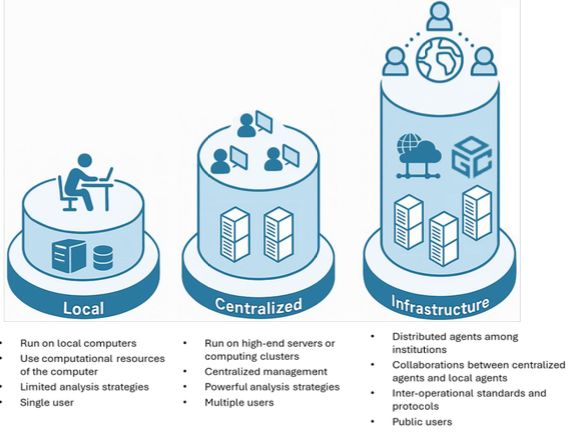
𝗦𝗰𝗮𝗹𝗲𝘀 𝗼𝗳 𝗢𝗽𝗲𝗿𝗮𝘁𝗶𝗼𝗻
There are three technical scales:
1. Local: Runs on a single machine
2. Centralized: Uses cloud computing to handle larger tasks.
3. Infrastructure-scale: Distributed systems for massive analysis, possibly run by governments or research institutions.
𝗛𝗼𝘄 𝗜𝘀 𝗜𝘁 𝗕𝗲𝗶𝗻𝗴 𝗕𝘂𝗶𝗹𝘁?
The core of an autonomous GIS is the “decision core”. This is typically an LLM that:
• Reads your question.
• Plans a solution.
• Finds and cleans the data.
• Runs the analysis (e.g., in Python or GIS software).
• Presents results (maps, stats, reports).
Most current prototypes are at Level 2.
I.e. they can follow instructions, create workflows, and run them, but need help getting the right data or interpreting results.
𝗟𝗲𝘃𝗲𝗹 𝟮: Generates and runs workflows, but still needs human-provided data.
𝗟𝗲𝘃𝗲𝗹 𝟯: Selects and prepares its own data.
𝗟𝗲𝘃𝗲𝗹 𝟰: Understands and refines results without help.
𝗟𝗲𝘃𝗲𝗹 𝟱: Fully independent, learns from experience, and adapts over time.
𝗟𝗲𝘃𝗲𝗹𝘀 𝗼𝗳 𝗔𝘂𝘁𝗼𝗻𝗼𝗺𝘆
Autonomous GIS can be built gradually. The authors define five levels:
𝗟𝗲𝘃𝗲𝗹 𝟬: Everything is manual – traditional GIS.
𝗟𝗲𝘃𝗲𝗹 𝟭: Automates repetitive tasks, but a human sets them up.
𝟯. 𝗦𝗲𝗹𝗳-𝘃𝗲𝗿𝗶𝗳𝘆𝗶𝗻𝗴 – It checks its own work step by step and ensures results are reasonable.
𝟰. 𝗦𝗲𝗹𝗳-𝗼𝗿𝗴𝗮𝗻𝗶𝘇𝗶𝗻𝗴 – It manages time, data, compute power, and even collaborates with other agents.
𝟱. 𝗦𝗲𝗹𝗳-𝗴𝗿𝗼𝘄𝗶𝗻𝗴 – It learns from experience and gets better.
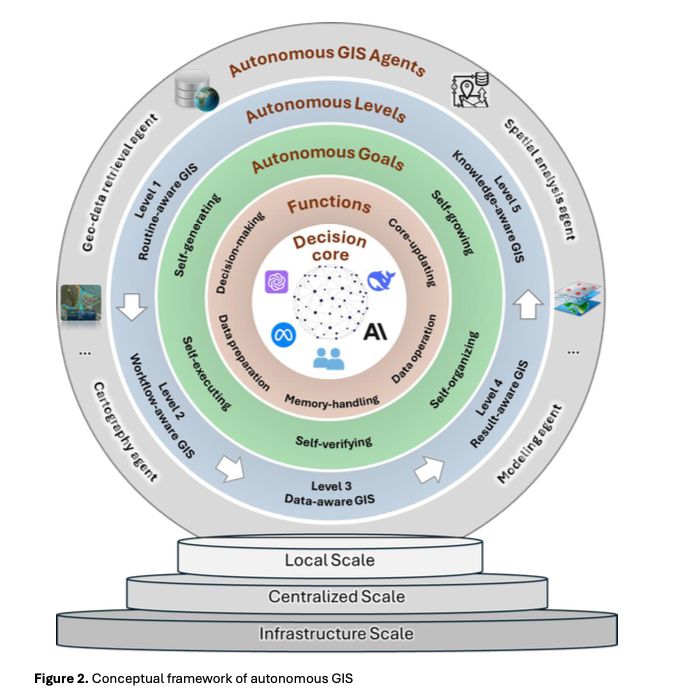
There are 5 goals for autonomous GIS:
𝟭. 𝗦𝗲𝗹𝗳-𝗴𝗲𝗻𝗲𝗿𝗮𝘁𝗶𝗻𝗴 – It creates ideas, workflows, code, and insights on its own.
𝟮. 𝗦𝗲𝗹𝗳-𝗲𝘅𝗲𝗰𝘂𝘁𝗶𝗻𝗴 – It can run the tasks (e.g., calculating distances, drawing maps).
The emergence of LLMs, has made this possible. These models can:
• Interpret instructions in natural language.
• Generate workflows and code.
• Work iteratively to refine outputs.
This opens the door to GIS reasons and adapts.