*reasonably
06.11.2025 16:47 — 👍 0 🔁 0 💬 2 📌 0
Do you have a chart of the GHG emissions profile out to 2100? I am guessing this is unreasonable consistent with the latest UN gap report conditional NDCs +all net zero pledges. The amount of removals needed makes me sceptical regarding the actual feasibility.
06.11.2025 15:29 — 👍 0 🔁 0 💬 2 📌 0
Just clicked the link - the answer is yes!
06.11.2025 15:07 — 👍 1 🔁 0 💬 1 📌 0
To clarify, are you referring to 1.5°C by 2100 and therefore an overshoot scenario?
06.11.2025 15:05 — 👍 0 🔁 0 💬 2 📌 0
Incredible opportunity to undertake vital research on UK drought projections with an amazing supervisory team!
24.10.2025 09:42 — 👍 1 🔁 0 💬 0 📌 0

Letter: CCC letter to Minister Hardy - advice on the UK's adaptation objectives - Climate Change Committee
It's good news that the Government are taking the impacts of climate change seriously and have sought our advice to strengthen adaptation objectives.
Read the letter published today from Baroness Brown, Chair of the Adaptation Committee, to Emma Hardy MP 👇
www.theccc.org.uk/publication/...
15.10.2025 08:24 — 👍 29 🔁 10 💬 1 📌 2

The people I work with are not stupid people and our climate predictions of 30 years ago of global warming have proved to be accurate. Just saying. www.bbc.co.uk/news/live/cp...
23.09.2025 15:24 — 👍 183 🔁 65 💬 2 📌 3
Thanks Zeke! This is very helpful.
16.09.2025 10:55 — 👍 0 🔁 0 💬 0 📌 0
Amazing! I have sent you an email.
16.09.2025 10:49 — 👍 0 🔁 0 💬 0 📌 0
@climateflavors.bsky.social @climateofgavin.bsky.social @hausfath.bsky.social
@drlaurasuarez.bsky.social
15.09.2025 09:17 — 👍 0 🔁 0 💬 2 📌 0
Hey Bluesky hivemind, climate modelling data question. Does anyone know where I could find CESM2 and MPI large ensemble annual global mean surface temperature timeseries?
15.09.2025 09:14 — 👍 2 🔁 1 💬 1 📌 1
Third heatwave of the summer and it is only the start of July!
08.07.2025 11:33 — 👍 3 🔁 1 💬 0 📌 0
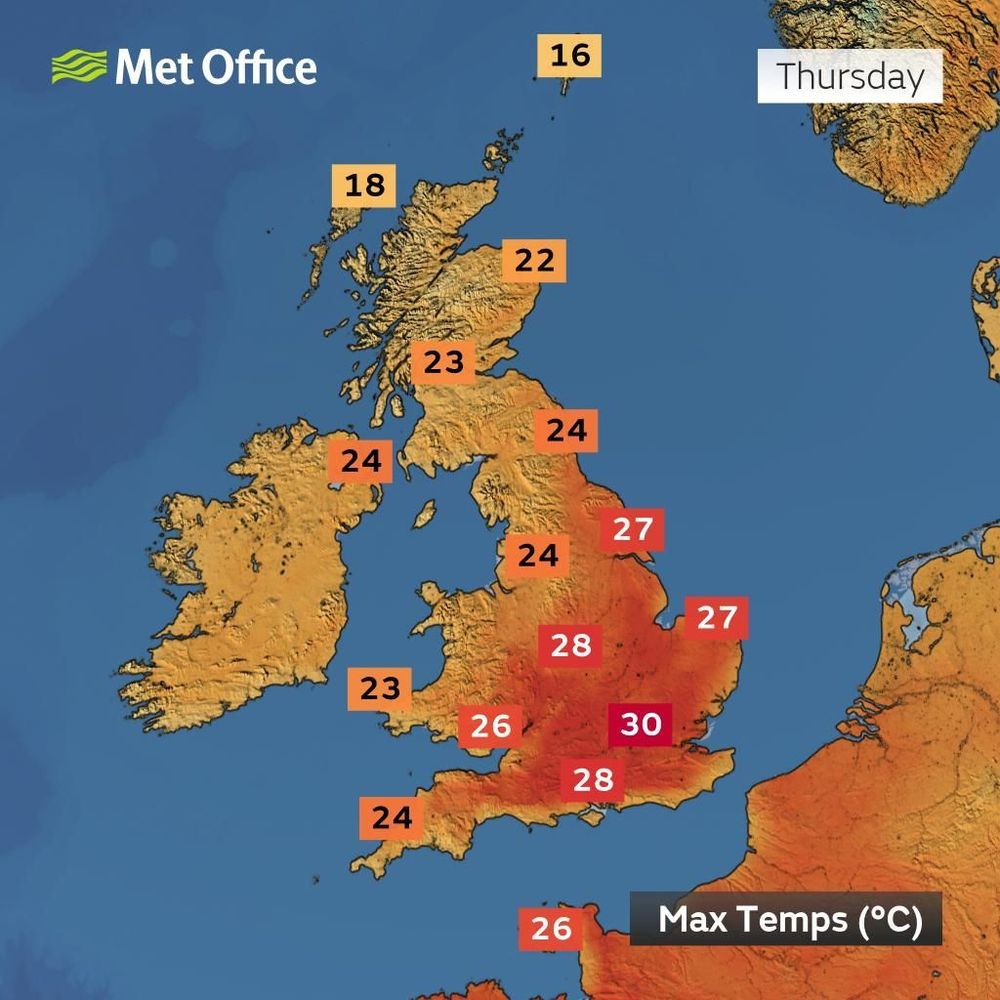
Met Office weather map showing maximum temperatures across the UK and Ireland for Thursday. Temperatures range from 16°C in northern Scotland to 30°C in central England, with most regions in the mid to high 20s
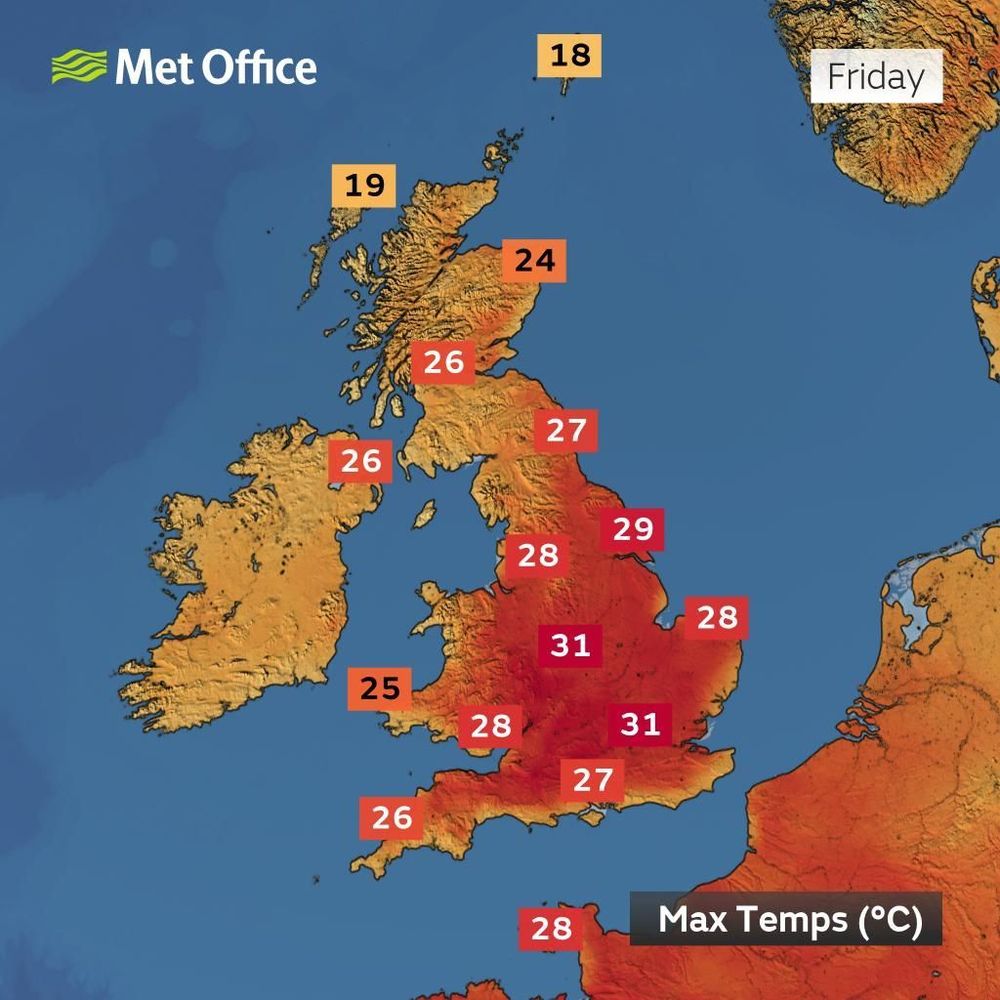
Met Office weather map showing maximum temperatures across the UK for Friday. Temperatures range from 18°C in northern Scotland to 31°C near Cardiff, with most areas in Wales and central England in the high 20s
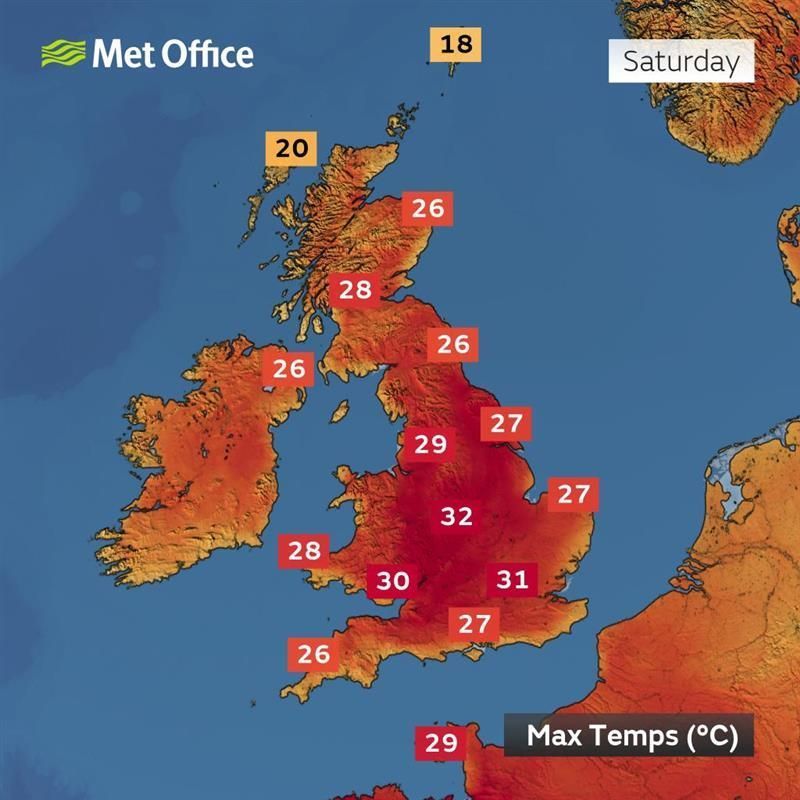
Met Office weather map showing maximum temperatures across the UK and parts of Europe for Saturday. Temperatures range from 20°C in northern Scotland to 32°C in central-southern England, with much of the UK in the mid to high 20s
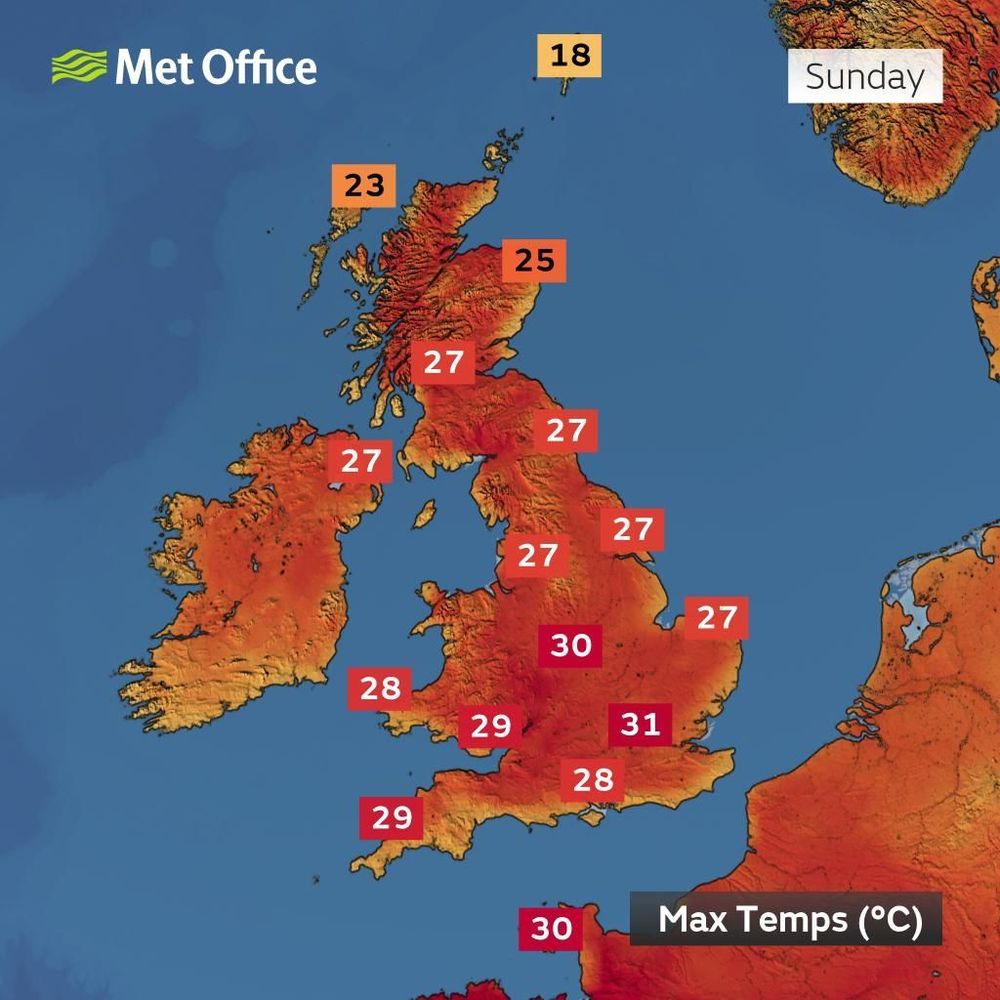
Met Office weather map showing maximum temperatures across the UK and parts of Europe for Sunday. Temperatures range from 18°C in northern Scotland to 31°C in southern England, with most regions in the mid to high 20s.
🌡️ Heat is building across the UK this week, temperatures could reach 32-33°C during the weekend 👇
08.07.2025 11:30 — 👍 72 🔁 23 💬 3 📌 43
The UK hasn't experienced a severe drought since the '90s or an extreme one since the '70s. This has led to complacency in drought preparedness. With climate change, future droughts could be worse than anything previously experienced.
08.07.2025 07:13 — 👍 5 🔁 2 💬 1 📌 0
High warming rate fuels record-breaking weather
The longer our measurements, the fewer record-breaking events we should observe.
The opposite is the case - many more records and higher record margins
I summarise the key takeaways of our @natrevearthenviron.nature.com article in a guest post.
13.06.2025 10:40 — 👍 14 🔁 7 💬 1 📌 0
New paper in ERL! We study the importance of resolution for the representation of climate extremes.
We use a new generation of km-scale models to show that many important details about temperature and precipitation extremes are hidden at CMIP6-like resolutions.
doi.org/10.1088/1748...
17.06.2025 10:56 — 👍 59 🔁 22 💬 3 📌 8
Found the quote, thanks. It references this paper using the median of the UN gap report scenario set to define future rates if warning. Having looked at that dataset the median won't include uncertainties in aerosol forcing or ECS.
iopscience.iop.org/article/10.1...
28.06.2025 09:54 — 👍 1 🔁 0 💬 0 📌 0
Did you share the wrong paper? I couldn't find the quote and the paper doesn't look at global climate models.
I agree the place to look is a comparison between observed and modelled ocean heat content. Struggled to find recent work on this but I assume it exists.
28.06.2025 09:12 — 👍 0 🔁 0 💬 1 📌 0
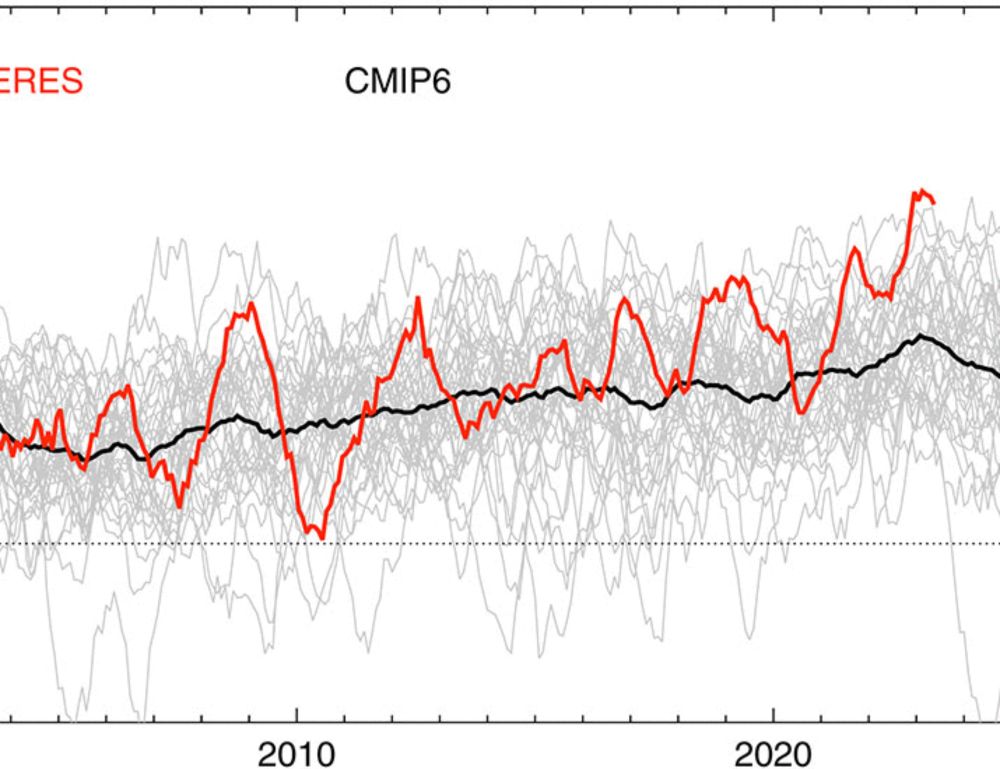
If the recent surface temperature warming is broadly inline with model projections but the models don't project the large change in energy imbalance does that not suggest the climate model sensitivity is too high? Or that sensitivity estimates based on surface temperatures is the wrong metric?
28.06.2025 07:55 — 👍 6 🔁 2 💬 2 📌 0
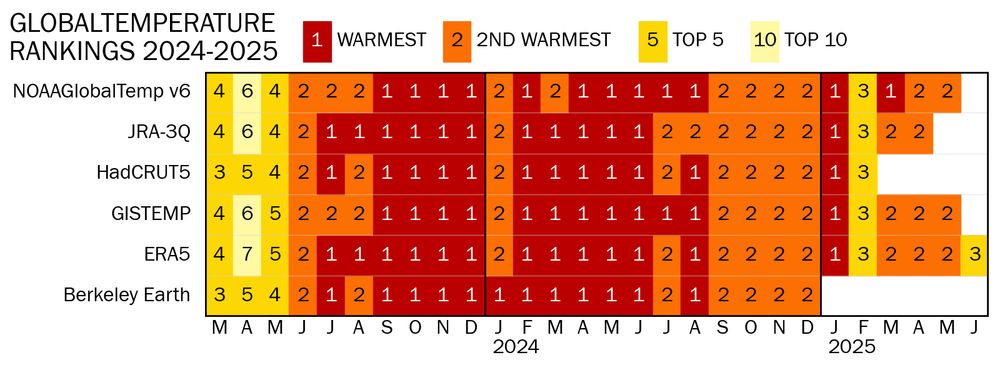
Graph showing the ranking for monthly global mean temperature from six data sets between March 2023 and June 2024. Rankings are shown as coloured squares. Red is warmest on record (for that month and dataset), orange is second warmest, deep yellow (a beautiful shade that I want to call cadmium yellow but it's not toxic) means a top five month and pale yellow (the colour of sun faded straw) is top ten. Nothing is outside that range. Every single warmest month in all datasets happened since July 2023.
Updated updated notes on the recent acceleration in the argument about the recent acceleration in warming which may or may not be happening or may only appear to be happening (or not, you idiot). Either way it appeared in the New York Times.
diagrammonkey.wordpress.com/2025/02/16/a...
27.06.2025 16:30 — 👍 34 🔁 15 💬 5 📌 4
Thanks, John! I really appreciate these summaries. I expect moderate acceleration from increasing forcing, but also a wider range of internal variability as the climate warms - making 23/24 tricky to unpack.
28.06.2025 07:46 — 👍 2 🔁 0 💬 1 📌 0
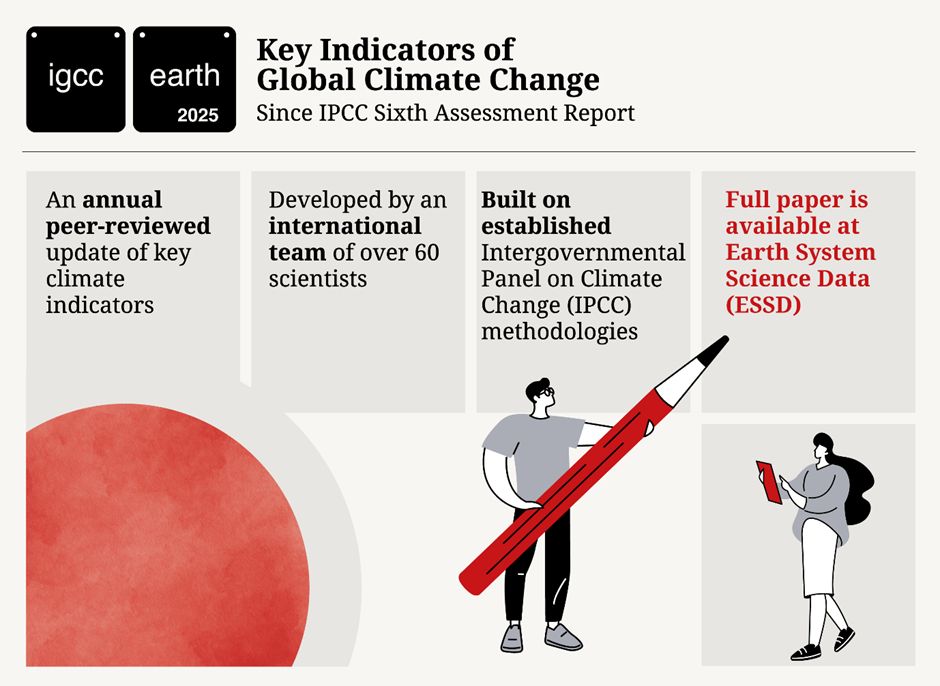
⚠️Global warming caused by humans is advancing at 0.27°C per decade – the highest rate since records began.
This is one of the indicators updated every year by over 60 international scientists in the annual Indicators of Global Climate Change report – published today. doi.org/10.5194/essd... /1
19.06.2025 08:21 — 👍 328 🔁 191 💬 8 📌 9
New infrastructure should be climate resilient from the Inception. HS2 and Sizewell are reasonable examples for flood risk. There are embedded processes that are starting to address this but they are often superficial and don't go far enough. Certainly more needs to be done.
19.06.2025 17:26 — 👍 0 🔁 0 💬 1 📌 0
evidence suggests it does little to manage large floods in big catchments. We need a combination of engineered and natural solutions thinking holistically at catchment scales. Unfortunately flooding is extremely complex - every catchment and every flood event is different with no simple solutions.
19.06.2025 17:19 — 👍 0 🔁 0 💬 0 📌 0
There is a strict requirement that government funded flood schemes must not increase risks elsewhere. This is generally done by making space for water and providing large storage areas. Yes, natural flood management and upland reforestation is important to provide resilience but
19.06.2025 17:19 — 👍 0 🔁 0 💬 1 📌 0
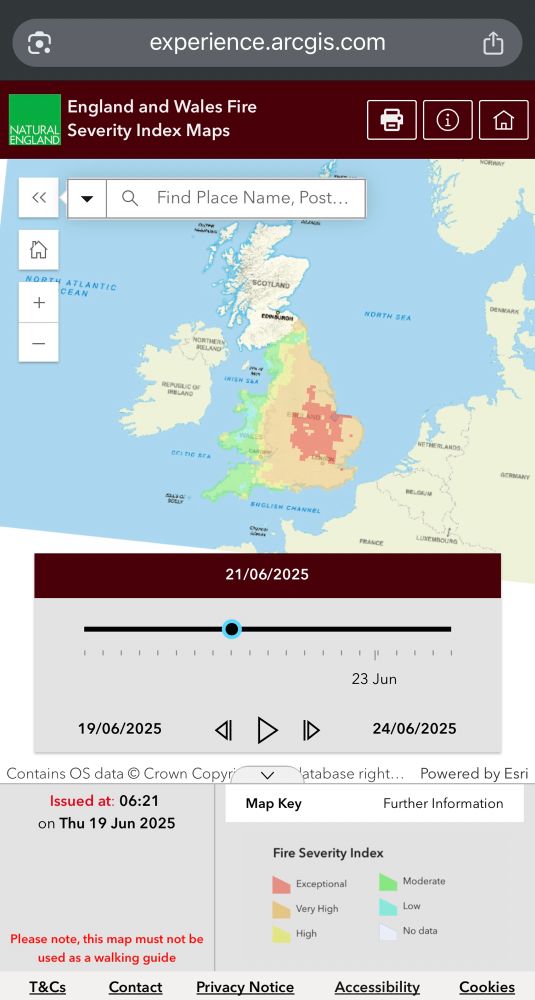
England & Wales Fire Severity Index maps
Map showing red blotches (exceptional risk) across the Midlands - from London heading up to Doncaster. Most of the rest of England is orange (very high risk).
Natural England produce a Fire Severity Index (FSI) but this needs to be promoted more widely across the media.
FSI models potential fire severity *should they occur*, and rises widely across England to *exceptional* levels by next Monday.
19.06.2025 06:52 — 👍 5 🔁 4 💬 0 📌 0
Finally! I would like to think my relentless nagging was the gentle nudge that made this happen.
16.06.2025 08:00 — 👍 2 🔁 0 💬 1 📌 0
Energy & Climate | Senior Climate Policy Analyst | Climate Analytics
Climate science journalist at @carbonbrief.org
Green Party Leader (England & Wales)
London Assembly Member.
Chair of London's Fire Committee.
🏳️🌈
https://podcasts.apple.com/podcast/id1837201724?i=1000724643828
Climate Scientist at University of Melbourne. Interested in climate change and weather extremes. 🏳️🌈
Climate Scientist @metoffice 🌍🌊 |
Exploring AMOC and global ocean circulation |
Views are my own | https://linktr.ee/jonbakerocean
Météo-France sous le « ciel bleu », logique non ? Bienvenue sur notre compte officiel ! Retrouvez ici toutes nos actualités météo, climat et Vigilance.
A Yorkshireman in Devon, growing trees. Retired filmmaker. GS heat pump, solar thermal, PV, MVHR and EV user. Prioritising climate change, energy, sustainability, woodland, eco-building. Born at 311ppm CO₂.
Climate science PhD | Aerosols, SRM | Senior Research Fellow | University of Exeter | Based in Leeds | 🇬🇧/🇫🇷
https://matthewjhenry.github.io/
Climate researcher at CICERO
Ocean/climate. Research scientist #CNRM @meteofrance working on observations from #satellites (marine heatwaves, ocean color). Cyclist enthusiastic from the Pyrénées, climate refugee in Brittany back in Toulouse
Scientist bridging #Climate and #Biodiversity...
Scientia Prof. of Ocean & Climate Dynamics UNSW Australia | Fellow Australian Academy of Science | CMSI / BEES | Deputy Director ARC Australian Centre for Excellence in Antarctic Science | I study our oceans ice atmosphere and climate 🌊🌎🧊🌍🌤
climate *zeitgeist* reporter for @washingtonpost.com. DM for Signal.
🚨 Helping climate science break through to many more people - and unlock action. Brainchild of climate comms lab @utopiabureau.bsky.social and campaigner @nickoldridge.bsky.social https://www.climatesciencebreakthrough.com
https://climate-advisory-board.europa.eu/
I speak about climate futures, mitigation and adaptation in the face of the climate crisis. 🇿🇦
I am a huge fan of ephemeral social media, so my posts delete after 60 days. Content that I want around longer will be on my blog.
https://peterdutoit.com
Deputy Chief Meteorologist @metoffice. FRMetS, CMet, Roostmaster. @RMetS 'Weather' News co-editor. World famous speedcuber. Personal account, views my own.
Freelance science and technology journalist. 11+ years experience. Irish/Polish. I write for the BBC, Wired, the BMJ, The Guardian, and others!
Newsletter: thereengineer.pro
Portfolio: chrisbaraniuk.com
HQ: Belfast, Northern Ireland
Former German Nazi concentration & extermination camp Auschwitz. Official account. We commemorate victims, educate about history & preserve the authentic site.
www.auschwitz.org | lesson.auschwitz.org | podcast.auschwitz.org


