Everything is ready for the Perspectives on Scientific Error conference that starts tomorrow in Leiden! I look forward to hanging out with the mix of metascientists, philosophers of science, and statisticians! So many old friends will be there (and hopefully some new ones)! #PSE8
10.02.2026 17:10 — 👍 51 🔁 9 💬 0 📌 2
Come to Amsterdam or join online for the full week of JASP workshops (24th-28th of August)! If you can't do the full week or you are only interested in meta-analysis, I will be giving the Meta-Analysis workshop on 25th of August.
jasp-stats.org/2026/02/05/h...
06.02.2026 09:23 — 👍 4 🔁 1 💬 0 📌 0

Diagram showing four phases of methodological research (Theory, Exploration, Systematic Comparison, Evidence Synthesis) with an arrow indicating that preregistration usefulness increases from early to late phases. Each phase lists its aim, elements, outcome, and an example from factor retention research.
Does it make sense to preregister simulation studies?
This question has sparked a lot of debate.
▶️We* work through the why, when, and how
▶️We discuss different phases of methodological research to clarify where preregistration might (or might not) add value
📝 Preprint: doi.org/10.31234/osf...
04.02.2026 10:40 — 👍 37 🔁 13 💬 1 📌 0
Does it mean that AI/LLMs do not help at education? I personally don't think so. I'm using the AI every day and find it incredibly useful. It would be odd if they didn't help at learning at all. However, the current empirical base does not substantiate strong claims.
28.01.2026 20:41 — 👍 1 🔁 1 💬 0 📌 0

Meta-analysis level re-analysis then further highlights the issue of publication bias. Extremely overstated evidence (left) and mean effect size estimates (middle) due to a large degree of publication bias (right).
28.01.2026 20:41 — 👍 1 🔁 0 💬 1 📌 0

We explored several moderators and compared results of studies published before and after 2023 (to assess older AI systems and modern LLMs) but we did not find any meaningful difference.
28.01.2026 20:41 — 👍 0 🔁 0 💬 1 📌 0
Publication bias-adjusted estimates decrease the average effect from d = 0.63 to d = 0.20. More importantly, the between-study heterogeneity is so large that the distribution of effects can range from -1.52 to 1.91! This is a ridiculous variance making the mean meaningless.
28.01.2026 20:41 — 👍 1 🔁 0 💬 1 📌 0

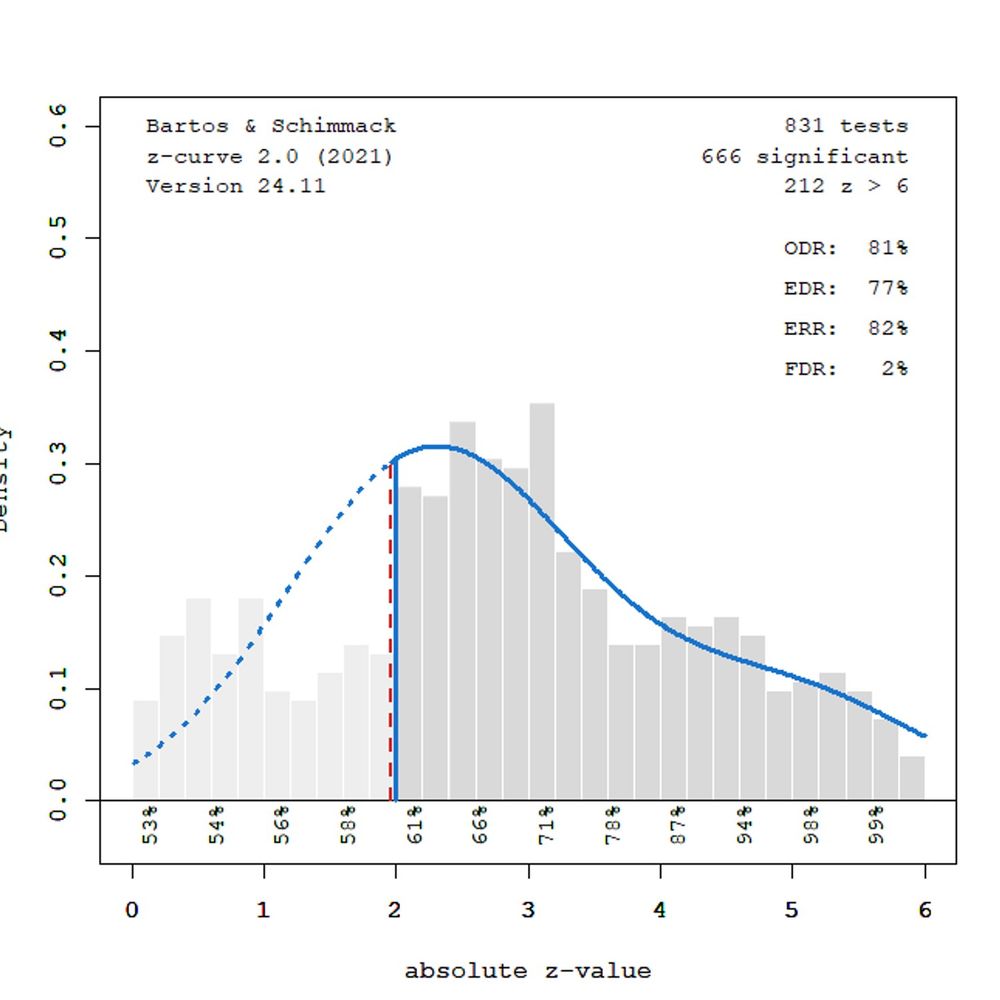
We managed to collect 1,840 effect size estimates from 67 meta-analyses. The distribution of study-level effect sizes shows both a notable skew (funnel plot on the left) and clear selection for positive effects (z-curve plots on the right).
28.01.2026 20:41 — 👍 0 🔁 0 💬 1 📌 0
We recently criticized one meta-analysis on the effect if ChatGPT on learning for failing to adjust for publication bias (bsky.app/profile/fbar...). In a response, the original authors argued that many other meta-analyses find the same effects. So we examined them all.
28.01.2026 20:41 — 👍 0 🔁 0 💬 1 📌 0

We just posted a preprint with a comprehensive meta-meta-analysis of the effects of AI/LLMs on learning.
TLDR:
- 1,840 effect sizes
- extreme between-study heterogeneity
- extreme publication bias
- small average effects (three times lower than usually reported)
(osf.io/preprints/ps...)
28.01.2026 20:41 — 👍 8 🔁 1 💬 1 📌 0
Surprisingly never in the case of publication bias tests :D
23.12.2025 20:01 — 👍 3 🔁 0 💬 1 📌 0


"we did not find any evidence for publication bias (p=0.077)"
23.12.2025 19:49 — 👍 3 🔁 0 💬 1 📌 0
This is also likely to be the last update of this version of the package. Next year, I will introduce breaking changes to the interface with the 4.0 major release, which will make the interface much more similar to metafor.
23.12.2025 10:11 — 👍 1 🔁 0 💬 1 📌 0
Guide to RoBMA Vignettes
As such, it provides an easy-to-apply state-of-the-art Bayesian meta-analytic methodology for most meta-analytic settings!
See an overview of the current functionality with a brief description of all vignettes fbartos.github.io/RoBMA/articl...
23.12.2025 10:11 — 👍 2 🔁 0 💬 1 📌 0
Multilevel Robust Bayesian Meta-Analysis
The Robust Bayesian Meta-Analysis package got updated with additional vignettes explaining how to perform Bayesian model-averaged publication bias-adjusted
- multilevel meta-analysis (cran.r-project.org/web/packages...)
- multilevel meta-regression (cran.r-project.org/web/packages...)
23.12.2025 10:11 — 👍 22 🔁 9 💬 1 📌 0
Yep, its ridiculous. Those studies should not be published...
Extracting the study-level data from existing meta-analyses is quite feasible, so, there is almost no excuse not to do so.
15.12.2025 14:09 — 👍 2 🔁 0 💬 1 📌 0
OSF
Also, you cannot really evaluate between-study heterogeneity, see e.g. our latest study-level meta-meta-analysis that shows the limitations of the previous meta-analysis-level meta-meta-analysis doi.org/10.31234/osf...
15.12.2025 13:52 — 👍 2 🔁 0 💬 1 📌 0
My main worry is that they might have synthesized the meta-analytic estimates rather than the study-level estimates? The manuscript wasn't super clear on that and the OSF had only meta-analysis level data?
If so, that makes the publication bias adjustment ineffective...
15.12.2025 13:49 — 👍 2 🔁 0 💬 1 📌 0
Also, this should not be a reason to stop exercising.
1) There are other benefits of exercise
2) Some populations/exercises show benefit
3) There might be wider effects on cognition; however, the literature is too heterogeneous and contaminated with publication bias to be certain
01.12.2025 16:19 — 👍 13 🔁 0 💬 0 📌 0
I think that the field needs to clean up the published literature a bit. Additional small studies are not going to move the needle at this point; maybe a couple of large-scale, pre-registered studies might provide more insight?
01.12.2025 16:19 — 👍 11 🔁 2 💬 1 📌 0

We also re-analyzed all of the original meta-analyses individually. Many of them are consistent with publication bias: the evidence for and the degree of the pooled effects decrease once publication bias is adjusted for.
01.12.2025 16:19 — 👍 2 🔁 0 💬 1 📌 0

First, we found notable publication bias, especially in studies on general cognition and executive function. Importantly, there was extreme between-study heterogeneity (tau ~ 0.3-0.6!). This means that the results were consistent with both large benefit but also large harm.
01.12.2025 16:19 — 👍 3 🔁 0 💬 1 📌 0
We were not the only ones to notice, also see @matthewbjane.bsky.social commenting on this when the study came out:
x.com/MatthewBJane...
So, we manually extracted the study-level data from the included meta-analyses and re-evaluated the evidence.
01.12.2025 16:19 — 👍 1 🔁 0 💬 1 📌 0
Postdoc at LMU Munich | PhD in Psychology | Meta-science & Agent-based modelling
Interested in cognition and open science. Postdoc at Birkbeck on Making replications count project https://forrt.org/marco/
PhD Candidate in Statistics, Utrecht University
Creates fake data for a living.
thomvolker.github.io
Postdoctoral fellow at METRICS @stanford.edu
Interested in everything related to meta-research and evidence synthesis
https://sandovallentisco.github.io/
Researchers, practitioners, & open science advocates building a better system for research evaluation. Nonprofit. We commission public evaluation & rating of hosted work. To make rigorous research more impactful, & impactful research more rigorous.
Lecturer and Researcher at Department of Psychology, Princeton University.
Your friendly shitposting scientist, here to disappoint your biases. It's never personal. Topics: ITsec, psych, engineering, data science, coding, politics. German/English/Japanese/Dutch (in progress).
https://Roguehci.home.blog
Statistics, cognitive modelling, and other sundry things. Mastodon: @richarddmorey@tech.lgbt
[I deleted my twitter account]
MetaScience, MetaScientist, MetaPsycholog, UberScientist
Assistant Professor at UT-Austin.
Interested in meta-analysis, selective reporting and publication bias, single-case design, open science, and R.
Postdoctoral research associate at CONNECTS, @cimcyc.bsky.social, University of Granada | Psychological, meta- and contemplative research | INMINDS interview series | lcasedas.com
Systematic Reviews and Meta-Analysis. Researcher at The Danish Center for Social Science Research.
Author behind the AIscreenR package to screen titles and abstracts with GPT models. See https://osf.io/preprints/osf/yrhzm
Psychologist - Methodologist - Meta-Analyist. Assistant Professor at UNED (Spain)
Statistician, meta-analyst, “local mom” to my former students
Johns Hopkins BA/MA 1978
U of Chicago PhD 1985
Research Fellow, Adj. Associate Professor, Editor | Review of Education
#EvidenceSynthesis #AIEd #EdTech #StudentEngagement
Physicist Turned Psychologist | Senior Researcher in #STEMed | Meta-Analysis Nerd | https://d-miller.github.io/
Also posts about 🧪 science funding to focus my attention.
Personal account. I don’t speak for my employer or any other orgs.
Associate Professor in Biostatistics, Oslo Center for Biostatistics and Epidemiology @ocbe.bsky.social, University of Oslo | https://www.cer-methods.com/
Social Science Librarian in Amsterdam. Libraries, systematic reviews, knitting, sewing, photography
Campbell promotes evidence-based policy and practice. We publish social science evidence synthesis #research in our #OpenAccess journal. #SystematicReviews