Let's make @ecosistemas-aeet.bsky.social a fair and well-used journal!
15.11.2025 09:15 — 👍 27 🔁 6 💬 0 📌 0

A table showing profit margins of major publishers. A snippet of text related to this table is below.
1. The four-fold drain
1.1 Money
Currently, academic publishing is dominated by profit-oriented, multinational companies for
whom scientific knowledge is a commodity to be sold back to the academic community who
created it. The dominant four are Elsevier, Springer Nature, Wiley and Taylor & Francis,
which collectively generated over US$7.1 billion in revenue from journal publishing in 2024
alone, and over US$12 billion in profits between 2019 and 2024 (Table 1A). Their profit
margins have always been over 30% in the last five years, and for the largest publisher
(Elsevier) always over 37%.
Against many comparators, across many sectors, scientific publishing is one of the most
consistently profitable industries (Table S1). These financial arrangements make a substantial
difference to science budgets. In 2024, 46% of Elsevier revenues and 53% of Taylor &
Francis revenues were generated in North America, meaning that North American
researchers were charged over US$2.27 billion by just two for-profit publishers. The
Canadian research councils and the US National Science Foundation were allocated US$9.3
billion in that year.

A figure detailing the drain on researcher time.
1. The four-fold drain
1.2 Time
The number of papers published each year is growing faster than the scientific workforce,
with the number of papers per researcher almost doubling between 1996 and 2022 (Figure
1A). This reflects the fact that publishers’ commercial desire to publish (sell) more material
has aligned well with the competitive prestige culture in which publications help secure jobs,
grants, promotions, and awards. To the extent that this growth is driven by a pressure for
profit, rather than scholarly imperatives, it distorts the way researchers spend their time.
The publishing system depends on unpaid reviewer labour, estimated to be over 130 million
unpaid hours annually in 2020 alone (9). Researchers have complained about the demands of
peer-review for decades, but the scale of the problem is now worse, with editors reporting
widespread difficulties recruiting reviewers. The growth in publications involves not only the
authors’ time, but that of academic editors and reviewers who are dealing with so many
review demands.
Even more seriously, the imperative to produce ever more articles reshapes the nature of
scientific inquiry. Evidence across multiple fields shows that more papers result in
‘ossification’, not new ideas (10). It may seem paradoxical that more papers can slow
progress until one considers how it affects researchers’ time. While rewards remain tied to
volume, prestige, and impact of publications, researchers will be nudged away from riskier,
local, interdisciplinary, and long-term work. The result is a treadmill of constant activity with
limited progress whereas core scholarly practices – such as reading, reflecting and engaging
with others’ contributions – is de-prioritized. What looks like productivity often masks
intellectual exhaustion built on a demoralizing, narrowing scientific vision.

A table of profit margins across industries. The section of text related to this table is below:
1. The four-fold drain
1.1 Money
Currently, academic publishing is dominated by profit-oriented, multinational companies for
whom scientific knowledge is a commodity to be sold back to the academic community who
created it. The dominant four are Elsevier, Springer Nature, Wiley and Taylor & Francis,
which collectively generated over US$7.1 billion in revenue from journal publishing in 2024
alone, and over US$12 billion in profits between 2019 and 2024 (Table 1A). Their profit
margins have always been over 30% in the last five years, and for the largest publisher
(Elsevier) always over 37%.
Against many comparators, across many sectors, scientific publishing is one of the most
consistently profitable industries (Table S1). These financial arrangements make a substantial
difference to science budgets. In 2024, 46% of Elsevier revenues and 53% of Taylor &
Francis revenues were generated in North America, meaning that North American
researchers were charged over US$2.27 billion by just two for-profit publishers. The
Canadian research councils and the US National Science Foundation were allocated US$9.3
billion in that year.

The costs of inaction are plain: wasted public funds, lost researcher time, compromised
scientific integrity and eroded public trust. Today, the system rewards commercial publishers
first, and science second. Without bold action from the funders we risk continuing to pour
resources into a system that prioritizes profit over the advancement of scientific knowledge.
We wrote the Strain on scientific publishing to highlight the problems of time & trust. With a fantastic group of co-authors, we present The Drain of Scientific Publishing:
a 🧵 1/n
Drain: arxiv.org/abs/2511.04820
Strain: direct.mit.edu/qss/article/...
Oligopoly: direct.mit.edu/qss/article/...
11.11.2025 11:52 — 👍 608 🔁 435 💬 8 📌 62

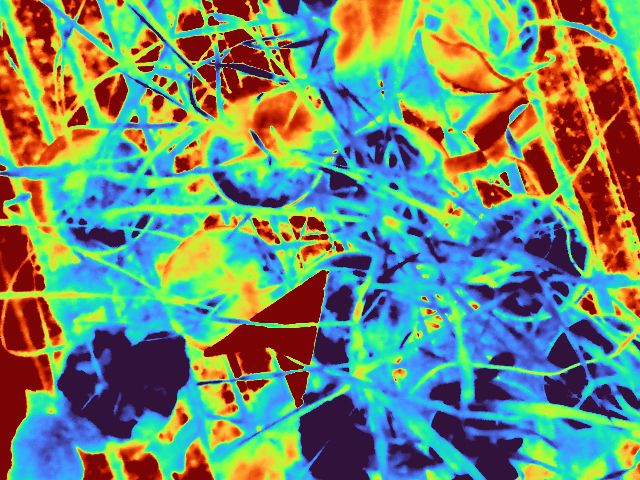
Biological performance across the tree of life collapses onto the Universal Thermal Performance Curve (UTPC). Shown are approx. 30,000 performance measurements derived from seven kingdoms, 39 phyla, and 2,710 experiments. Performance is represented by diverse rates including metabolism, individual growth, foraging intensity, voluntary activity, and population growth (see SI Appendix for data grouped by phylum and performance metric). Data are presented on both axes relative to the parameters (Topt, Tc and Pfmax ) estimated by fitting the UTPC equation to each of the 2,710 experiments; the UTPC is overlaid as a yellow line and fits the rescaled data extremely well. Data are colored by the relative density of neighboring points showing very high density of points close to the line and relatively few datapoints further from the line.

Data collapse, and models converge, onto a Universal Thermal Performance Curve (UTPC), which only requires optimal and critical temperatures as parameters. Top panels show empirical data on thermal performance encompassing (A) specific growth rate of proteobacteria (), (B) biochemical rates of photosynthesis in plants (), (C) running speeds of lizards (), and (D) population growth in insects (). Lower panels (E–H) showcase the rescaled data from the processes exposed on top, along with their corresponding alignment to the Universal Thermal Performance Curve (UTPC) equation. Datasets are from Kontopoulos et al. (21) for proteobacteria and from Rezende and Bozinovic (6) for other groups. The upper panels of the raw data show substantial variation in the shape and location of the thermal performance curves. The lower row shows that rescaling the data using the simple model results in the data conforming to a single underlying curve with very little variation from the model.
And our paper is out! One curve to rule them all: a simple universal thermal performance curve for ectotherms that explains at least 2700 datasets across 39 phyla and myriad measures of performance. www.pnas.org/doi/10.1073/...
23.10.2025 10:01 — 👍 16 🔁 5 💬 0 📌 0
Five 3-year Postdoc positions open at @ebdonana.bsky.social. I am happy to sponsor and mentor good candidates working in my field, but note that these are quite independent positions aimed at helping stabilize new researchers in the system. www.dropbox.com/scl/fi/4nqkq...
18.08.2025 15:27 — 👍 32 🔁 34 💬 0 📌 2

El suicidio de la ciencia en EE UU
Las agencias científicas más potentes del mundo están siendo desmanteladas por un Gobierno ignorante y fanatizado
Lo que ocurre en USA no es un suicidio de la Ciencia, es un asesinato.
En un mundo sumido en múltiples crisis, necesitamos más que nunca que se hagan políticas desde el conocimiento, respaldadas por Ciencia básica, y no desde la ignorancia. Y no sólo en USA...
elpais.com/opinion/2025...
11.08.2025 07:12 — 👍 5 🔁 2 💬 0 📌 0
🎓 ¡Quedan plazas libres!
📊 Gestión y visualización de datos con R: Convirtiendo datos en historias
📍 Modalidad online | 🕒 Plazas limitadas
¿Quieres aprender a transformar datos en narrativas visuales impactantes usando R?
🔗 Inscripciones: www.aeet.org/events/2025/...
03.07.2025 14:49 — 👍 1 🔁 2 💬 0 📌 0
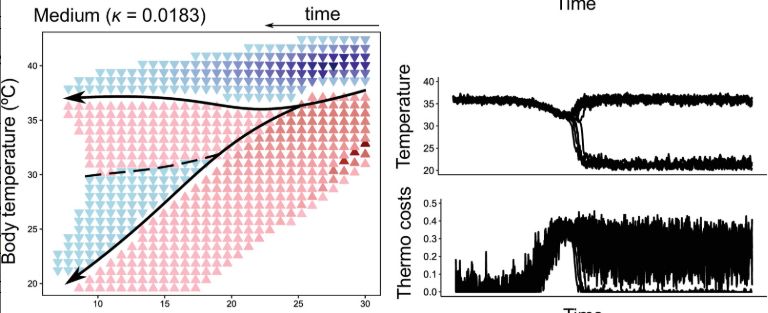
These two strategies likely produced bifurcations and abrupt evolutuionary transitions to endothermy. I speculate that declining temperatures n the mid Triassic triggered endothermy in early mammal and avian lineages
23.06.2025 08:57 — 👍 1 🔁 0 💬 0 📌 0
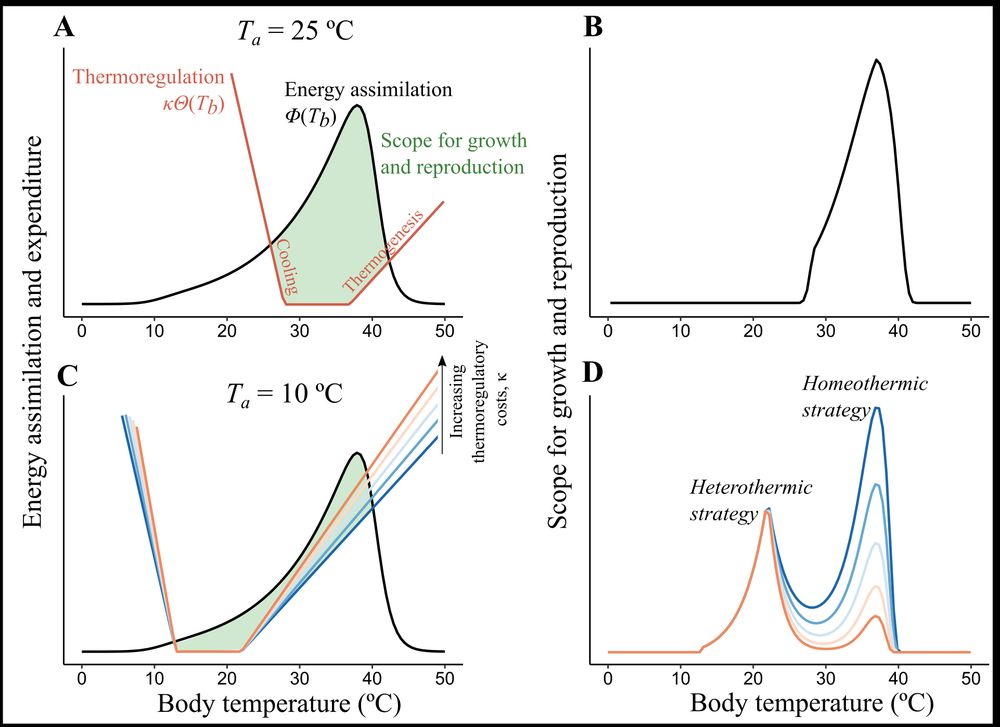
When the costs and benefits of high body temperatures are combined, two strategies emerge: 1) save energy and be an ecotherm OR 2) spend as much as you need as an endotherm
23.06.2025 08:57 — 👍 1 🔁 0 💬 1 📌 0
I used a theoretical, energy-balance model to explore how and why an energetically expensive trait such as endothermy evolved multiple times among both plants and animals
23.06.2025 08:57 — 👍 1 🔁 0 💬 1 📌 0
Postdoc in Mechanistic Biodiversity Modelling with temporary civil servant status (“Akademische*r Rätin*Rat)
100%, A 13, Reference number: 2025/49
Postdoc call in Mechanistic Biodiversity Modelling (up to 6 ya) at my lab @unibonn.bsky.social. We focus on modelling terrestrial plant communities, island biogeography, range dynamics, eco-evolutionary feedbacks, diversity gradients, tropical forests, vascular epiphytes. Pls rt! shorturl.at/CL1ny
29.05.2025 08:09 — 👍 34 🔁 36 💬 0 📌 2
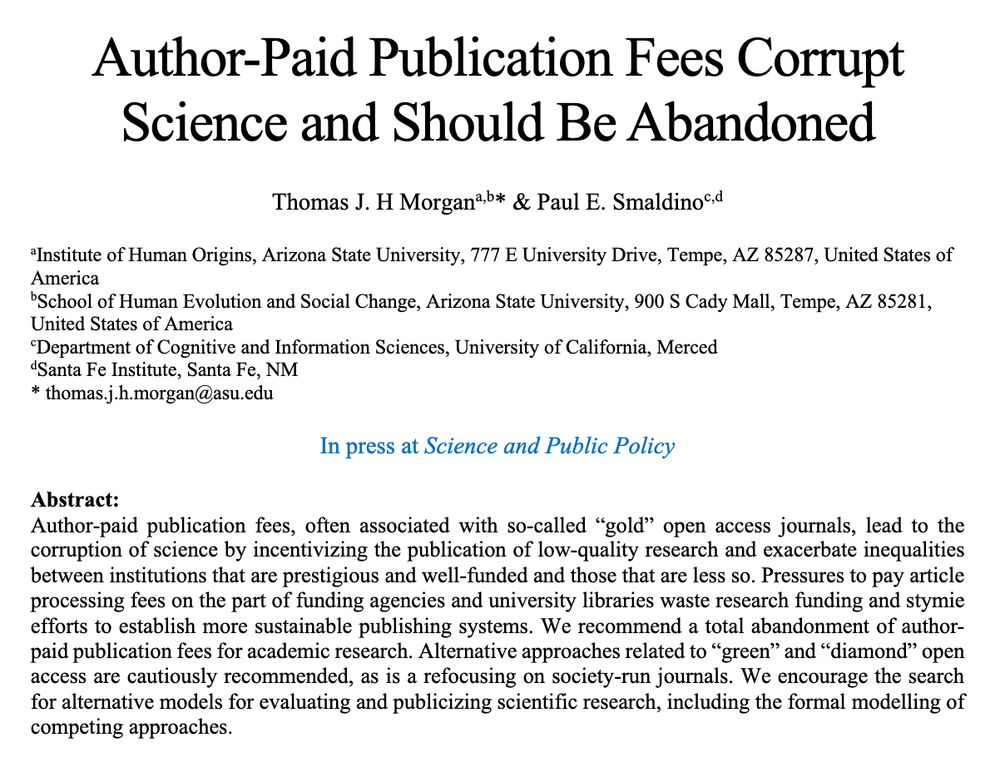
Author-Paid PublicationFees Corrupt Science and Should Be Abandoned
Thomas J. H Morgan & Paul E. Smaldino
As grant money starts drying up, it's more important than ever not to waste it on paying publishers' open access "article processing fees" when we can host PDFs for free. Tom Morgan and I wrote a paper on this, forthcoming at Science and Public Policy. Accepted draft here: osf.io/preprints/os...
09.05.2025 17:26 — 👍 397 🔁 134 💬 9 📌 18
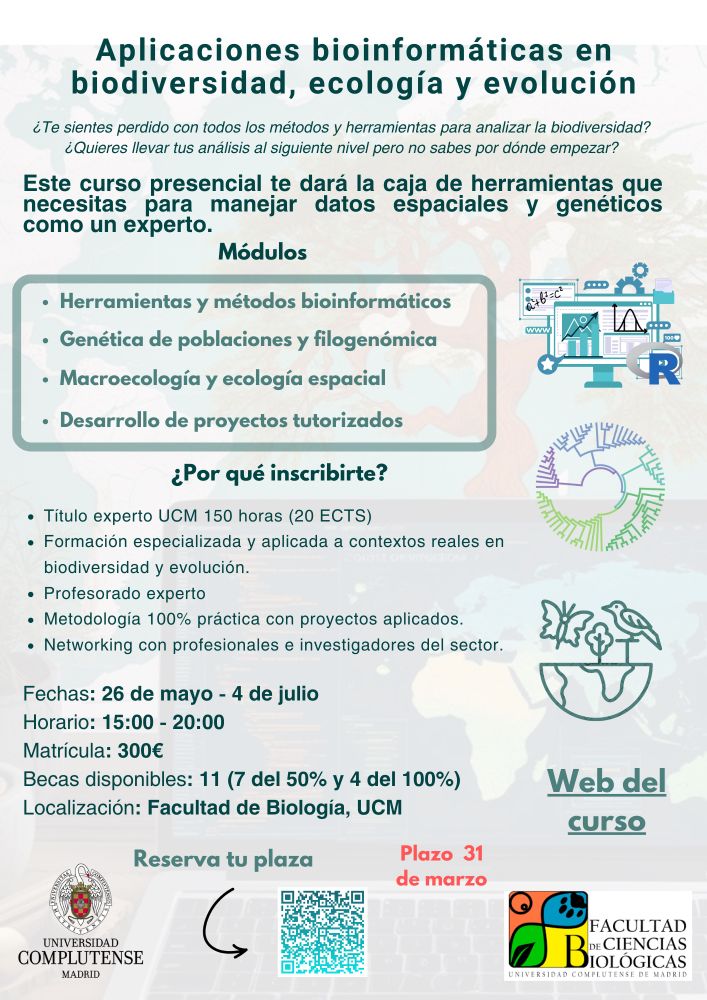
📢 Título de experto en Aplicaciones bioinformáticas en biodiversidad, ecología y evolución
📅 26 mayo - 4 julio | ⏰ 15:00 - 20:00
📍 Facultad de Biología, Universidad Complutense de Madrid
💰 300€
🎯 Metodología 100% práctica con proyectos y tutorización experta
📌 Inscríbete ya! ucm.es/formacion-pe...
28.03.2025 11:43 — 👍 7 🔁 5 💬 1 📌 0
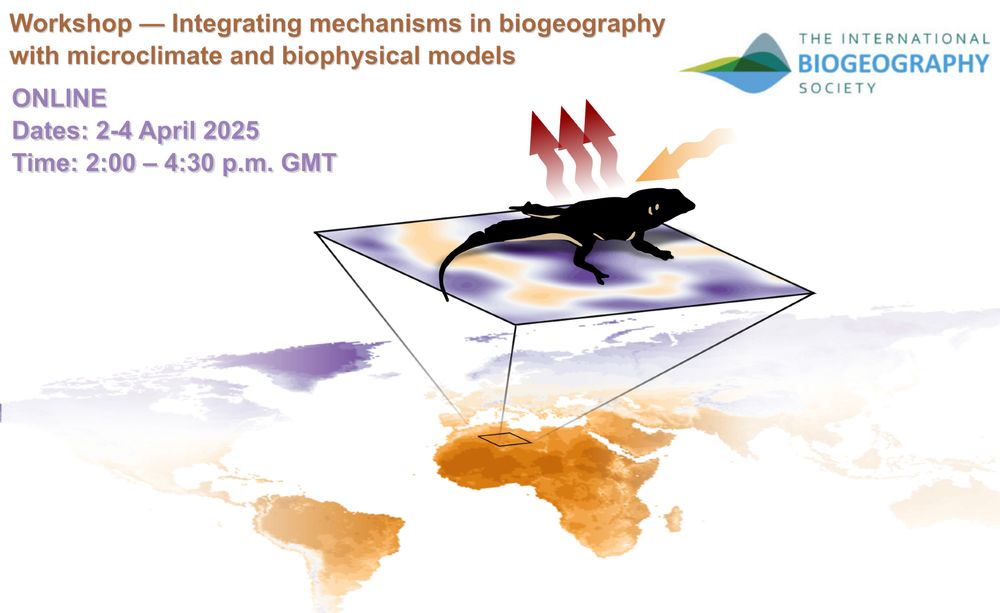
Next week (!!) we are presenting our workshop "integrating mechanisms into species distribution models" - don't miss it! Online 2-4 April www.biogeography.org/news/news/wo... @gfandos.bsky.social @biogeography.bsky.social
24.03.2025 16:40 — 👍 13 🔁 5 💬 0 📌 1
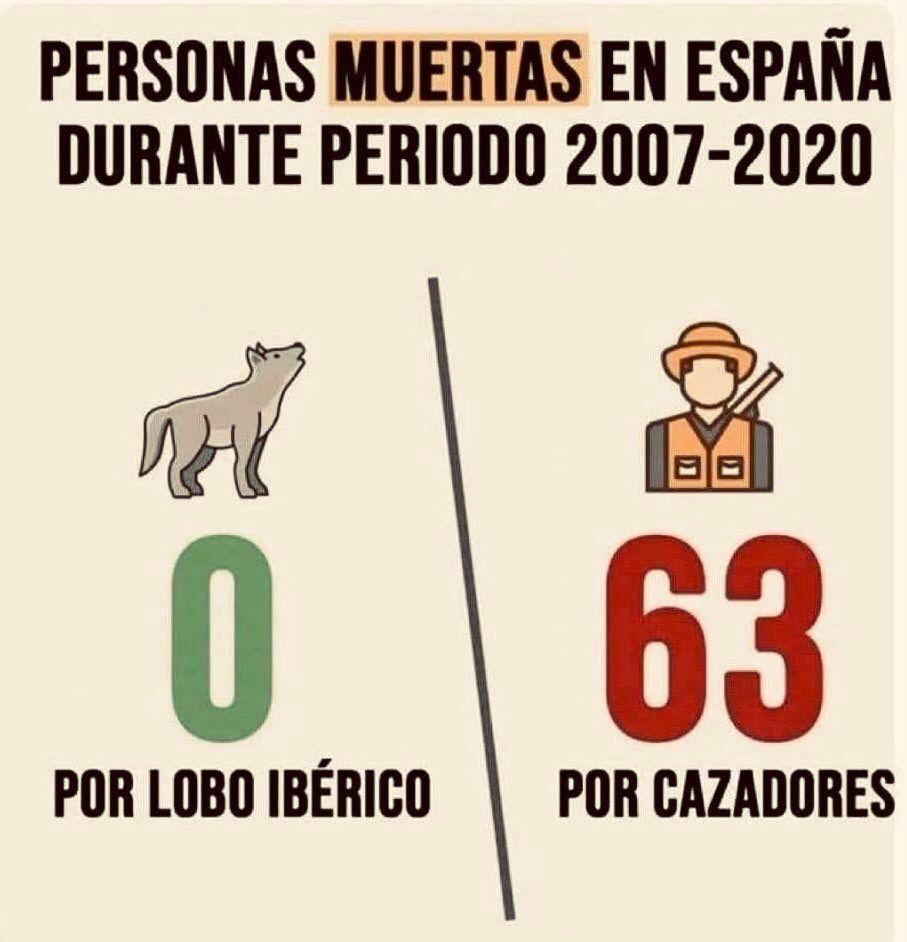
Dato mata relato
#lobovivo
#loboprotegido
22.03.2025 14:50 — 👍 3280 🔁 1814 💬 55 📌 27
Se ha filtrado el borrador de ley de universidades que está preparando la CAM. Si se aprueba, será la muerte de la universidad pública madrileña. Es escandaloso. No exagero. Se vienen tiempos oscuros como no espabilemos. Explico algunos puntos críticos. Va hilo. 👇
14.03.2025 20:49 — 👍 2199 🔁 2068 💬 73 📌 226
Real breakthroughs come from long-term investment in public research and then exploited by big tech companies
04.03.2025 13:24 — 👍 0 🔁 0 💬 0 📌 0
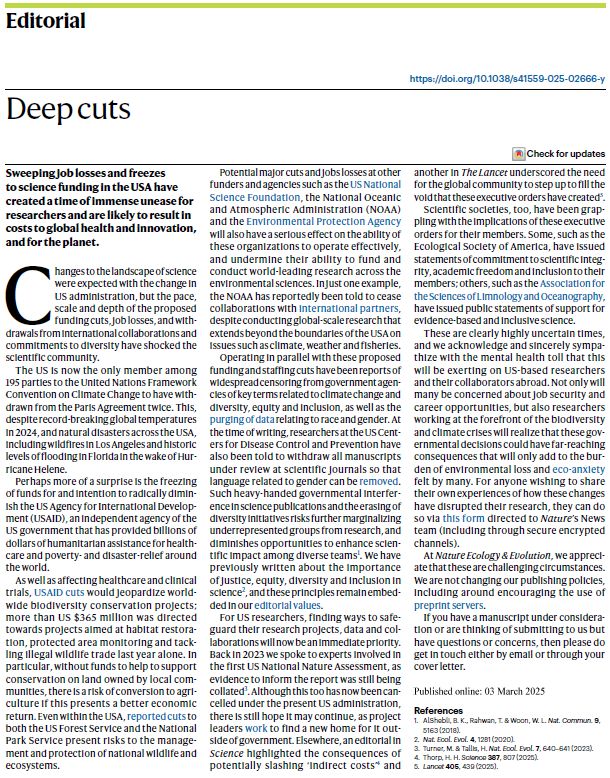
Screenshot of text from a Nature Ecology & Evolution Editorial entitled "Deep cuts"
In our latest Editorial we discuss the continuing damage being done to US science, and its impact on researchers and the environment 👇
Deep cuts: www.nature.com/articles/s41...
03.03.2025 14:34 — 👍 248 🔁 124 💬 3 📌 4
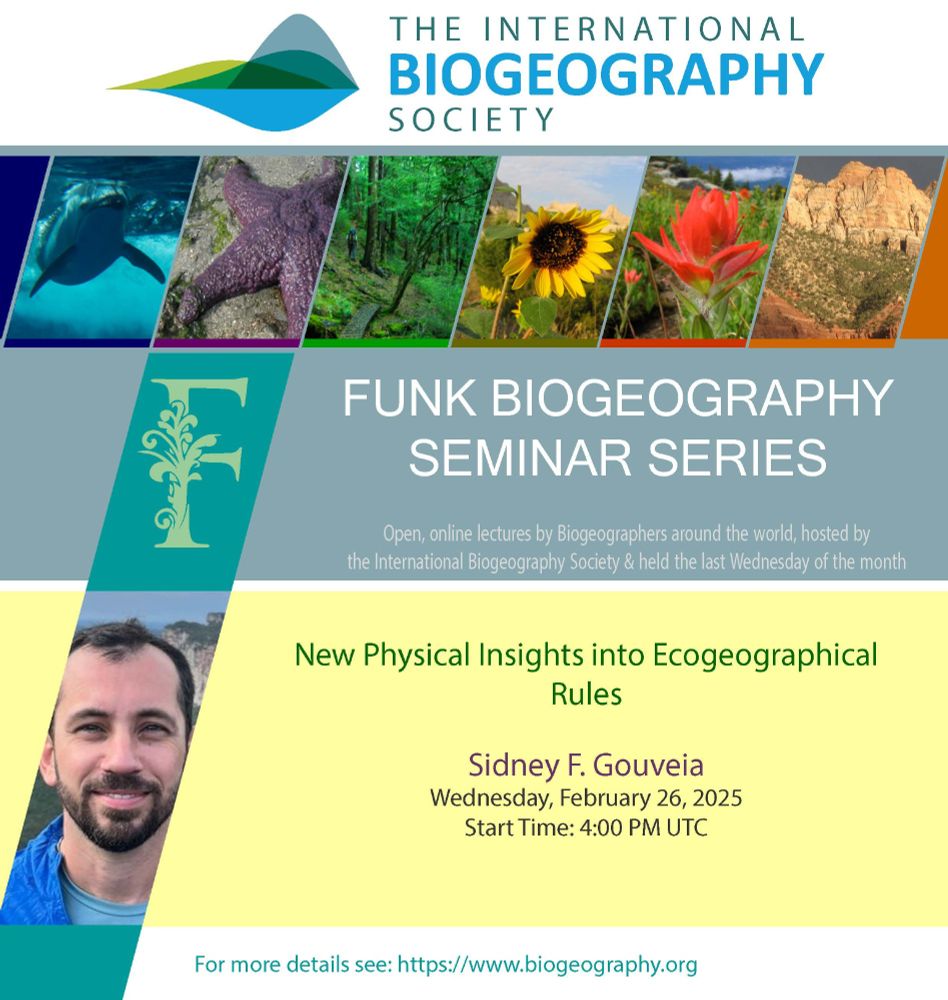
Join us this Wednesday for our monthly Funk lecture, presented by Dr. Sidney F. Gouveia! To register, please visit our website: www.biogeography.org/news/news/ne...
24.02.2025 20:16 — 👍 16 🔁 10 💬 0 📌 0
Interested in mechanistic & hybrid species distribution models? Don't miss our workshop! Online - 2-4 April @gfandos.bsky.social
REGISTER: www.biogeography.org/news/news/wo...
18.02.2025 09:22 — 👍 7 🔁 5 💬 0 📌 1
Coalition of authors, editors, reviewers and society members working to make scientific publishing more accessible, affordable, and equitable. https://peeer.net
Somos una fundación independiente que promueve una sociedad más democrática, justa y sostenible a través de la educación y el debate ecosocial. #EducaciónEcosocial #revistaPapeles
https://www.fuhem.es/
La actualidad del mañana.
PhD student in the Cognitive Zoology group at Lund University. Passionate about reptile cognition
Postdoc at Rey Juan Carlos University (Spain) | @biodiversosurjc.bsky.social & @iicg-urjc.bsky.social | Ecology | Body size, energy use & aquatic ecosystems 🐟🦐🦈🦠
A community-based, diamond open-access journal publishing only articles recommended by @peercommunityin.bsky.social. ISSN 2804-3871
https://peercommunityjournal.org/
Mirror de las publicaciones de tiempo.com - Revista divulgativa y gratuita de Meteored para aficionados y entusiastas
Pensado para promocionar el trabajo de RAM en Bluesky.
⚠️ Si tienes la titularidad de los contenidos, contacta para transferir la cuenta
Assistant Professor @uarizona – Biological data science and macroevolution – Website: https://datadiversitylab.github.io/
La Delegación del CSIC en Castilla y León está conformada por cinco centros de investigación, varias unidades asociadas y una bioincubadora de empresas 👩🔬🧪 Promueve la I+D+i, la transferencia de conocimiento y la cultura científica en la región.
Join the fast-growing ecological restoration movement and help drive positive change. We restore ecosystems through rewilding and capacity development. Together we can harness nature for climate resilience.
Computational Ecologist. Researcher @unisevilla.bsky.social. ecology, biogeography, statistics, rstats, GIS, science.
https://frodriguezsanchez.net
Bat enthusiast, thermal and muscle physiologist. Assistant Professor at Rice University: rummellab.com
I am a professor of tropical ecology at the University of York. I have a passion for Mountain ecosystems and cultures across the Global South, particularly in Kenya and Tanzania where I work with many Universities, NGOs and Government organisations.
We are the chair of global change ecology at @uniwuerzburg.bsky.social led by @christianhof.bsky.social. We study the variation and future of biodiversity under global change.
biozentrum.uni-wuerzburg.de/en/gce/
Ecology and Evolutionary Biology|Wildlife Photographer|Herping for Reptile|Breaking Dancing
Investigador en el Museo Nacional de Ciencias Naturales (MNCN-CSIC). Anfibios ibéricos: diversidad y conservación. Perfil personal
Geóloga, investigo los climas del pasado. Preocupada por la emergencia climática
Associate Professor at the University of Maine. Specializes in tenrecs, treeshrews, and energetics of small furry things. 🇨🇦 living in 🇺🇸. She/her.
PhD candidate at UoA exploring how land use and climate change affect Lepidoptera 🦋
Sometimes I can't tell if I'm chasing bugs in the field or in my scripts! 🐛💻
Associate professor and CRC Tier 2 in Integrative Ecology at the University of Alberta. She/her.