Here's the latest variant picture with a global scope, to mid-October.
XFG.* "Stratus" resumed growing, up to 77%.
NB.1.8.1 "Nimbus" fell slightly to 15%.
#COVID19 #SARSCoV2 #Global #NB_1_8_1 #Nimbus #XFG #Stratus
🧵

@ireneaus.bsky.social
Adelaide, South Australia 🇦🇺 I wear a N95 respirator in all indoor spaces, and busy outdoor areas. SARS-CoV-2 is airborne … i.e. floats in the air like invisible smoke … you breathe it in without knowing you are 😷😷😷 To my knowledge, I have not had Covid-19
Here's the latest variant picture with a global scope, to mid-October.
XFG.* "Stratus" resumed growing, up to 77%.
NB.1.8.1 "Nimbus" fell slightly to 15%.
#COVID19 #SARSCoV2 #Global #NB_1_8_1 #Nimbus #XFG #Stratus
🧵

Here's the latest variant picture for the United States, to mid-October.
The XFG.* "Stratus" variant continued it’s dominance, roughly flat at 83% frequency.
NB.1.8.1 "Nimbus" was also roughly flat at 10%.
#COVID19 #SARSCoV2 #USA #XFG #Stratus #NB_1_8_1 #Nimbus
🧵

Here's the latest variant picture for Canada, to mid-October.
XFG.* "Stratus" continued to dominate, and grew again to 82%.
NB.1.8.1 "Nimbus" fell to 14%.
#COVID19 #SARSCoV2 #Canada #XFG #Stratus #NB_1_8_1 #Nimbus #FLiRT
🧵

Here's the latest variant picture for the United Kingdom, to mid-October.
The XFG.* "Stratus" variant remained dominant, growing to 85%.
NB.1.8.1 "Nimbus" fell to 8%.
#COVID19 #SARSCoV2 #UK #XFG #Stratus #NB_1_8_1 #Nimbus
🧵

Here's the latest variant picture for Europe (excluding the UK), to mid-October.
The XFG.* "Stratus" variant continued to dominate, but fell to 77% frequency.
NB.1.8.1 "Nimbus" grew to 14%.
#COVID19 #SARSCoV2 #EUR #LP_8_1 #XFG #Stratus #NB_1_8_1 #Nimbus
🧵

Here's the latest variant picture for the "Global - Other" countries, to early October.
XFG.* "Stratus" grew strongly to 47%, just taking over dominance.
NB.1.8.1 "Nimbus" fell to 46%.
#COVID19 #SARSCoV2 #GlobalOther #NB_1_8_1 #Nimbus #XFG #Stratus
🧵

I’ve used WA Health’s COVID-19 wastewater surveillance page to estimate the number of infections of BA.3.2.
I estimate ~1,100 BA.3.2.* infections in Perth for the latest week, and ~5,700 over the 11 weeks since BA.3.2.* was first detected.
#COVID19 #SARSCoV2 #BA_3_2 #Australia #WA #Perth
🧵

Australian Influenza update:
Reported cases have been holding at a stubbornly high plateau. This wave has run much longer than in previous years.
#Influenza #Australia
🧵

NSW Respiratory Surveillance Report – week ending 1 November 2025 www.health.nsw.gov.au/coronavirus Influenza is at a moderate level of activity. COVID-19 is at a low level of activity. RSV is at a low level of activity. Summary While some influenza indicators have declined, overall activity is stable but still at a moderate level, which is unusual for this time of year. COVID-19 is stable at a low level of activity. RSV is at a low level of activity.

Notifications of COVID-19, influenza and RSV Notification data is obtained from laboratory tests for infections. This indicator provides information about community infection. Interpretation: In the past week there was an increase of 4.9% in COVID-19 notifications, an increase of 4.7% in influenza notifications, and a decrease of 15.8% in RSV notifications. Table 1: Notifications of COVID-19, influenza and RSV, NSW, tested in the week ending 1 November 2025

A bar chart titled “Figure 5. Weekly notifications of COVID-19*, Influenza and RSV, by date of test and type of test performed, NSW, 1 May 2024 to 1 November 2025.” The chart displays weekly COVID-19 case notifications in New South Wales. Cases rise sharply in June–July 2024 to around 5,000–6,000 per week, then decline through late 2024 to around 1,500–2,000 per week. A second rise occurs in May–July 2025, reaching about 4,000–5,000 weekly cases before slowly declining through late 2025. The x-axis shows dates from May 2024 to December 2025, and the y-axis shows weekly notifications from 0 to 8,000.

A report graphic from NSW health surveillance showing COVID-19 test positivity and positive test counts over time. The top interpretation text says: “In the last week COVID-19 test positivity decreased to 2.4%. Influenza test positivity decreased to 8.5%. RSV test positivity decreased to 1.2%.” Below is a line and bar chart labeled: “Figure 12. Number and proportion of tests positive for COVID-19 at NSW sentinel laboratories by week, 1 May 2024 to 2 November 2025.” Light blue bars show the weekly number of positive COVID tests, generally fluctuating between ~1,500 and ~4,500. A grey line shows percent positivity, ranging from around 3% to 10% throughout the period, with peaks around December 2024 (9.6%) and June 2025 (7.3%), and sitting at 2.4% in early November 2025. Below the graph is Table 2, showing four weekly periods ending 12 October, 19 October, 26 October, and 2 November 2025. The row for SARS-CoV-2 shows percent positivity values of 2.6%, 2.4%, 2.4%, and 2.4%. The number of PCR tests conducted each week ranges from ~6,600 to ~8,000. The number of laboratories reporting COVID results is 3 in all weeks except 26 October, where it is 2. Red circles highlight the 2.4% positivity and 3 laboratories reporting values.
🧵(1/3) NSW respiratory surveillance reports: Week ending 1 November 2025
🔸COVID positivity rate: 2.4% (-0.5%)
🔸Number of laboratories reporting COVID: 3 out of 4
🔹COVID: 628 (+4.9%)
🔹Influenza: 2,273 (+4.7%)
🔹RSV: 388 (-15.8%)
@NSWHealth
Source: health.nsw.gov.au/Infectious/c...

Weekly reporting for 2025 has ended The weekly report will start again in the autumn and winter months in 2026, when the ACT is likely to see an increase in respiratory illnesses again. An annual summary report for 2025 will be published in early 2026.
ACT Health has ended weekly reporting for 2025.
Will start back up in autumn/winter 2026.
Source: www.act.gov.au/open/respira...

A line and bar chart from Western Australia Health, titled “COVID-19 notifications and test positivity by notification week, WA, 2023 to 2025 YTD.” The blue bars show the number of PCR-confirmed COVID cases reported each week. The black line shows test positivity percentage over time. From early 2023 into 2024, cases and positivity rise and fall in waves, with several noticeable peaks — especially a large surge in mid-2023 and another in late 2024. After that, numbers decline through early 2025. The most recent week shows 81 reported cases, with low but persistent positivity, indicating ongoing community transmission rather than elimination. The chart highlights repeated year-round waves, not a single-season pattern.

A bar chart titled “7-day average of COVID-19 cases currently in hospital or in ICU, WA, 2023 to 2025 YTD.” Blue bars represent the average number of hospitalized COVID-19 patients. Orange bars represent the average number of ICU COVID-19 patients (a smaller subset). The chart shows repeating waves of hospitalizations across 2023, 2024, and early 2025 — rising and falling multiple times, not limited to winter months. Hospitalizations repeatedly climb to 100+ per day during peaks, with noticeable waves around mid-2023, late 2023, mid-2024, and late 2024. The most recent data shows an average of 18 people hospitalized per day and about 2 people in ICU per day. The visual clearly shows COVID hospital burden never goes to zero, demonstrating continuous year-round transmission, with periodic surges rather than a single “season.”

A line graph titled “SARS-CoV-2 concentration in wastewater and COVID-19 notification rate, Perth metropolitan area, WA, 2023 to 31 Oct 2025.” The dark blue line shows wastewater viral concentration (14-day average). The yellow line shows COVID-19 cases per 100,000 population (14-day average). The wastewater data shows multiple repeating peaks across 2023, 2024, and 2025 — clear year-round circulation, not confined to winter. The case rate line fluctuates at lower scale, but follows the same wave pattern. The most recent data shows slight decrease, but the virus never disappears, remaining present every month.

A set of two stacked bar charts showing the distribution of SARS-CoV-2 variants from July 2022 to November 2025 in Western Australia. The top chart shows variants detected in clinical samples. The bottom chart shows variants detected in wastewater (more representative of community spread). Over time, different Omicron sub-lineages rise and fall, with distinct waves of variant turnover. Recently, the XFG.X sub-lineage is dominant in wastewater, while recent clinical sequencing is sparse, making clinical proportions less reliable. The charts show constant variant evolution, with no period where COVID disappears — only shifts in which variant dominates.
WA weekly COVID update: Week ending 2 Nov 2025
🔸COVID positivity rate: 1.8% est. (+0.2%)
🔹PCR cases: 81 (+14.0%)
🔹Hospitalisation: Cases increased to an average of 18 per day (+20.0%)
🔹ICU: 7-day average increased to 2 cases (+100.0%)
Source: www.health.wa.gov.au/Articles/F_I...

A webpage displaying a weekly health surveillance update dated Friday 7 November 2025. It notes that data reflects the previous week and updates occur on Fridays around 12:00 pm. There are four blue tab buttons near the top labeled COVID-19, Flu, RSV, and Pertussis, with COVID-19 currently selected. Below is a table summarizing COVID-19 statistics: Metric Value New cases reported this week 110 Cases year to date 10,256 Cases in previous year to date 16,173 Deaths year to date 68 Deaths in previous year 230
SA Weekly Respiratory Update: 1 Nov to 7 Nov 2025
Reported cases:
🔹COVID: 110 (+13.4%)
🔹Flu: 501 (+12.0%)
🔹RSV: 133 (+4.7%)
🔹Pertussis: 77 (-8.3%)
Reported deaths in 2025:
🔸COVID: 68 (+4)
🔸Flu: 61 (+35)
🔸RSV: 12 (+7)
🔸Pertussis: 5 (+5)
@SAHealth
Source: www.sahealth.sa.gov.au/wps/wcm/conn...

Australian Respiratory Surveillance Report – 20 October to 2 November 2025
Australian Respiratory Surveillance Report – 20 October to 2 November 2025
In the last fortnight, COVID cases decreased (-3.0%), influenza decreased (+1.0%), and RSV decreased (-19.1%).
Reported cases:
🔸COVID: 3,118
🔸Influenza: 13,843
🔸RSV: 2,949
Source: www.health.gov.au/resources/pu...
More people died from influenza than COVID-19 in August, for the first time since the height of the pandemic, according to the ABS. 265 people died from or with influenza compared with 195 deaths associated with COVID-19.
02.11.2025 23:33 — 👍 20 🔁 7 💬 1 📌 0
Adelaide, South Australia
01.11.2025 09:53 — 👍 0 🔁 0 💬 0 📌 0
Here's the latest variant picture for Australia, to early October.
The flow of BA.3.2.2 samples from Western Australia has continued, at around 30% frequency.
#COVID19 #SARSCoV2 #Australia #BA_3_2
🧵

Here's the latest variant picture with a global scope, to early October.
XFG.* "Stratus" was up slightly to 75%.
NB.1.8.1 "Nimbus" fell slightly to 15%.
#COVID19 #SARSCoV2 #Global #NB_1_8_1 #Nimbus #XFG #Stratus
🧵

Australian COVID-19 weekly stats update:
The risk estimate fell to 0.1% “Currently Infectious”, or 1-in-1058. That’s an all-time low since I started this analysis 3 years ago.
That implies a 3% chance that someone is infectious in a group of 30.
#COVID19 #SARSCoV2 #Australia
🧵

With the NB.1.8.1.* "Nimbus" and XFG.* "Stratus" variants carving up dominance around the globe, it is time to ponder which variant might drive the next wave.
The leading contenders at this point are PY.1.1.1 and XFV.
#COVID19 #SARSCoV2 #PY_1_1_1 #XFV
🧵

This image shows a Health New Zealand Te Whatu Ora dashboard titled “COVID-19 Reporting,” dated Sunday, October 26, 2025. A large line graph displays COVID case trends from 2020 to 2025, highlighting major peaks in 2022 and 2023 with lower but ongoing activity in 2024–2025. Metrics show 2.7M reported cases since January 2020, 721 cases in the past 30 days, and 151 cases in the past 7 days. A sidebar offers filters such as Age, Ethnicity, District, and Deprivation.
New Zealand COVID weekly update:
20 Oct to 26 Oct 2025:
🔹Reported cases: 151 (-12.2%)
🔹Reported Deaths: 1 (-66.6%)
🔹Total deaths: 5,466 (+1)
7 Oct to 13 Oct 2025:
🔹Hospitalisations: 34 (+13.3%)
#COVID19NZ
Source: tewhatuora.govt.nz/for-health-p...

A chart from the Pandemic Mitigation Collaborative shows estimated U.S. daily COVID-19 infections from wastewater data between 2020 and October 27, 2025. The graph displays multiple sharp peaks over time, including a major surge in early 2022 and recurring waves through 2023–2025. The current level, marked Oct 27, 2025, is significantly lower than the peak 7 weeks earlier but still high, around 264,000 estimated new daily infections. Text notes that transmission is about 20% of the recent summer peak and emphasizes ongoing high absolute levels despite the decline.

A U.S. map titled “COVID-19 Heat Map, Based on CDC Wastewater Data and Levels (U.S.),” dated October 27, 2025. Most states are shown in gray, indicating a lack of available wastewater data, while only Puerto Rico is colored, showing high levels of COVID-19 activity. A note explains that CDC wastewater data remains largely offline, limiting national surveillance, and recommends using localized dashboards for more accurate information.

A data table titled “National COVID-19 Estimates (U.S.),” dated October 27, 2025. It reports that 1 in 185 people (0.5%) are actively infectious. Estimated new daily infections are 264,000, with 1.88 million infections in the past week and 194 million in 2025 so far. The average person has been infected about 4.7 times. Estimated long COVID cases from new daily infections range from 13,000 to 53,000, and from new weekly infections 94,000 to 380,000. Excess deaths from new daily infections are estimated at 80 to 130, and from new weekly infections 500 to 900. A note states that transmission is flat and unlikely to fall further soon.
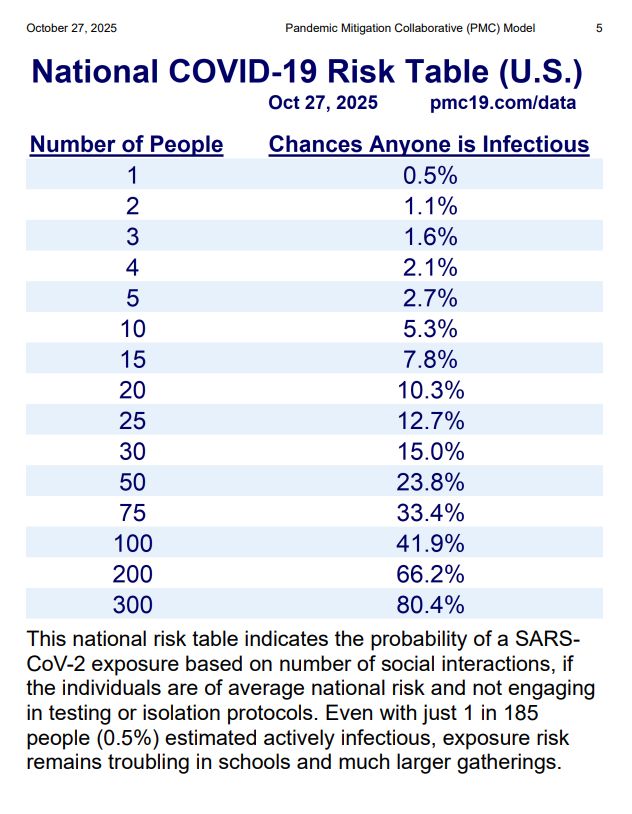
A table titled “National COVID-19 Risk Table (U.S.),” dated October 27, 2025. It lists the probability that at least one person in a group is infectious with COVID-19. Risk rises with group size: 0.5% for 1 person, 2.7% for 5 people, 10.3% for 20 people, 23.8% for 50 people, 41.9% for 100 people, 66.2% for 200 people, and 80.4% for 300 people. A note explains that even with an estimated 1 in 185 people infectious nationally, exposure risk remains high in schools and large gatherings.
US Weekly COVID update: Oct 27, 2025
🔸1 in 185 Actively Infectious
🔸264,000 New Daily Infections
🔸1,880,000 Infections In The Past Week
🔸194,000,000 Infections in 2025
🔸94,000 to 380,000 Weekly Long COVID Cases
🔸500 to 900 Weekly Deaths
Source: pmc19.com/data/

Data extracted on 27 October 2025 COVID-19 24 people were in hospital with COVID-19, six (25%) were aged 65–74 years and 10 (42%) were 75 years or more. 237 people diagnosed in the last week, 22 (9%) were aged 65–74 years and 39 (16%) were 75 years or more. Influenza 54 people were in hospital with Influenza, 34 (63%) were aged 65 years and above. 1,123 people diagnosed in the last week, 176 (16%) were aged 65 years or more. Respiratory Syncytial Virus (RSV) 27 people were in hospital with RSV, none were under 6 months of age and four (15%) were aged between 6 months to less than 2 years. 375 people diagnosed in the last week, 11 (3%) were aged under 6 months and 81 (22%) were between 6 months to under 2 years.
Queensland Weekly Respiratory Surveillance Report: 21 Oct to 27 Oct 2025
Reported cases:
🔹COVID: 237 (-8.4%)
🔹Influenza: 1,123 (-1.7%)
🔹RSV: 375 (-18.1%)
Hospitalisations:
🔸COVID: 24 (-4.0%)
🔸Influenza: 54 (-3.5%)
🔸RSV: 27 (+3.8%)
Source: www.health.qld.gov.au/clinical-pra...

able titled “AUSTRALIA Weekly COVID Update — 24 October 2025.” ACT up +11.1%. SA down -1.1%. WA down -2.1% (Avg 15/day in hospital, positivity 1.6%). NSW down -3.1% (positivity 2.4%). QLD down -14.5% (25 in hospital). TAS and VIC fortnightly, next update 31 Oct. NT no longer publishing data. Aged care down -29.8%, 3 deaths reported.
AUSTRALIA Weekly COVID Update — 24 October 2025
ACT cases up (+11.1%)
Other states down — SA (-1.1%), WA (-2.1%; Avg 15/day in hospital), NSW (-3.1%), QLD (-14.5%; 25 in hospital)
TAS & VIC fortnightly reporting, next update: 31 Oct.
Aged care down (-29.8%) and 3 deaths reported

COVID-19 outbreaks in Australian residential aged care homes National snapshot As at 8:00 am 23 October 2025, there are 190 active COVID-19 cases reported in 42 active outbreaks in residential aged care homes (RACHs) across Australia. There have been 26 new outbreaks, 3 new resident deaths and 254 combined new resident and staff cases reported since 16 October 2025.
COVID-19 outbreaks in Australian residential aged care facilities: 23 October 2025
🔹Active cases: 190 (-29.8%)
🔹Active outbreaks: 42 (-8.6%)
🔹Resident cases: 147 (-31.3%)
🔹Staff cases: 43 (-24.5%)
🔹Reported deaths in 2025: 398 (+3)
@SamRaeMP
www.health.gov.au/resources/pu...

Promotional graphic from whn.global showing a majestic lion in grayscale wearing a white N95 respirator mask. The background is dark, emphasizing the lion’s mane and the mask. Text reads: “The lion does not concern himself with cognitive decline. He wears a respirator.” The whn.global logo appears in the upper left corner.
#MaskUp #Respirator #CleanAir #LongCOVID #BrainHealth #TheLion
21.10.2025 20:25 — 👍 46 🔁 19 💬 0 📌 0
Promotional graphic from whn.global with a muted green-gray textured background and minimalist design featuring a small illustration of stacked stones in orange, green, pink, and peach colors in the lower right corner. Main heading in large white text: “Guided Meditation.” Supporting text: “We believe community health includes mental and emotional well-being. From the safety of our home, we can take time to reset and care for ourselves together.” Event details: “Join our virtual Guided Meditation every Wednesday at 2 PM ET in #general-meditations on Slack.” Smaller text at the bottom reads: “See caption for more information on how to join.” The whn.global logo appears at the top left, with a row of colorful dots in the top right corner.
At WHN, we believe community health includes mental and emotional well-being. Take time to reset with our Guided Meditation, Wednesdays at 2 PM ET in #general-meditations on Slack. A calmer mind supports better decisions, stronger relationships, and healthier communities.
22.10.2025 16:04 — 👍 5 🔁 4 💬 1 📌 0
Dark gray WHN graphic with large headline: “IS COVID-19 ‘AIRBORNE AIDS’?” Subtext: “New review article asks: provocative oversimplification, emerging science, or something in between?” Footer: World Health Network (WHN) • Open-access review (Oct 13, 2025).

Light-gray WHN slide with bold heading “What the paper is (and isn’t).” Body text: It is a scientific comparison of immune dysfunction in HIV and SARS-CoV-2 — looking at shared and distinct mechanisms. It isn’t claiming that COVID = HIV/AIDS. Boxed callout: Key point: HIV integrates into DNA and destroys CD4 T-cells over years. SARS-CoV-2 causes broader immune and vascular disruption — without DNA integration. Footer: World Health Network (WHN) • Open-access review (Oct 13, 2025).

Light-gray WHN slide titled “Parallels & Differences.” Subhead Parallels with bullets: • Chronic immune exhaustion and inflammation • Tissue persistence signals • Neurocognitive impacts (HAND vs. SAND) • Accelerated biological aging • Vulnerability to infections, including opportunistic Subhead Differences with bullets: • HIV: long-term immune collapse without treatment • SARS-CoV-2: vascular + multisystem effects, cumulative damage through reinfections • Over 40 years of data (AIDS) vs. 5 years of data known (COVID) • Availability of specific treatments (only for HIV) Footer: World Health Network (WHN) • Open-access review (Oct 13, 2025).

Clean, light-gray WHN graphic with large headline “What this means.” Bullet points read: • Prevention works: condoms reduce HIV; clean air & respirators reduce SARS-CoV-2. • Both pandemics expose global inequities and stigma — but also show what community action can achieve. • Read the open-access review (Oct 13, 2025) and share evidence-based prevention. Footer: World Health Network (WHN) • Link in bio/comments.
A new review article examines whether calling COVID-19 “Airborne AIDS” is an oversimplification—or a necessary warning about immune dysfunction and long-term risk. It doesn’t equate the two diseases—it compares shared outcomes (immune exhaustion, tissue persistence, neurocognitive effects) and (...)
23.10.2025 01:33 — 👍 48 🔁 24 💬 2 📌 3
Pull up a chair and say hello! The WHN Café Call is our virtual open space to meet others, welcome newcomers, and connect across teams. Join us Mondays and Thursdays at 1 PM ET in #1-general-dailycall on Slack. Community care starts with conversation.
24.10.2025 18:10 — 👍 7 🔁 5 💬 1 📌 0
Australian Respiratory Surveillance Report – 6 October to 19 October 2025 This fortnightly Australian Respiratory Surveillance Report (ARSR) includes information about acute respiratory illnesses including COVID-19, influenza and respiratory syncytial virus.
🇦🇺Australian Respiratory Surveillance Report – 6 October to 19 October 2025
In the last fortnight, COVID cases decreased (-22.2%), influenza decreased (-34.9%), and RSV decreased (-29.6%)
Reported cases:
🔸COVID: 3,196
🔸Influenza: 13,429
🔸RSV: 3,598
Source: www.health.gov.au/resources/pu...

In the past week, the number of COVID-19 notifications to the Department of Health remained stable at 91 notifications (Figure 15). Figure 15. COVID-19 notifications and test positivity by notification week, WA, 2023 to 2025 YTD

In the past week, currently hospitalised COVID-19 cases decreased to an average of 15 per day. The 7-day average for cases currently in intensive care units remained at zero (Figure 16). Figure 16. 7-day average of COVID-19 cases currently in hospital or in ICU, WA, 2023 to 2025 YTD

The SARS-CoV-2 concentration in wastewater from the Perth metropolitan area increased marginally in the past week (Figure 17). Figure 17. SARS-CoV-2 concentration in wastewater and COVID-19 notification rate, Perth metropolitan area, WA, 2023 to 17 Oct 2025.

Genomic sequencing indicated SARS-CoV-2 Omicron sub-lineage NB.1.8.X predominated in clinical samples, while XFG.X predominated in wastewater samples. (Figure 18). Figure 18. Distribution of SARS-CoV-2 variants in clinical samples (top) and metropolitan wastewater catchments (bottom), 03 July 2022 to 19 Oct 2025.
WA weekly COVID update: Week ending 19 Oct 2025
🔸COVID positivity rate: 1.6% est. (-0.2%)
🔹PCR cases: 91 (-2.1%)
🔹Hospitalisation: Decreased to an average of 15 per day (-40.0%)
🔹ICU: 7-day average remained at 0 (+0.0%)
Source: health.wa.gov.au/Articles/F_I...