Figure. A table is much closer to the concept of a "relation" in a relationam database. Your figure can looks like "tidy" os squared, but it is no a table
31.10.2025 06:01 — 👍 1 🔁 0 💬 0 📌 0

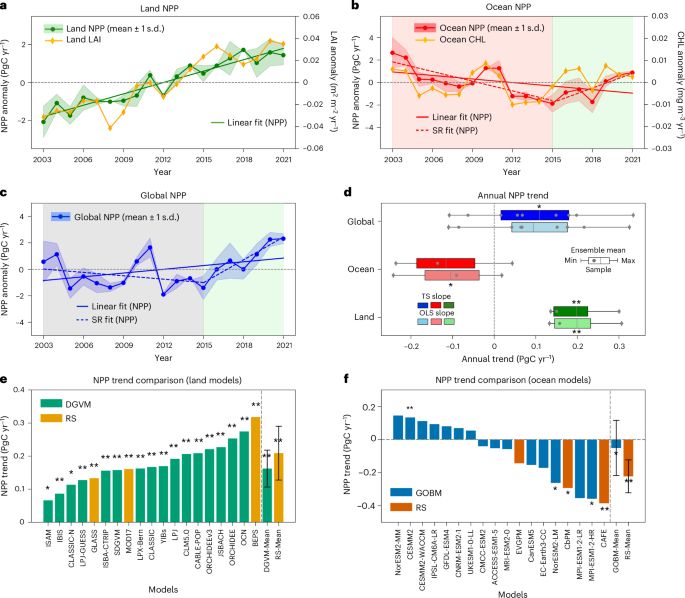
September 2025 Top 40 New CRAN Packages – R Works
Here are my picks of the best of the two hundred forty new packages that landed on CRAN in September, organized into thirteen categories: Computational Methods, Data, Decision Analysis, Ecology, Epide...
It's time for the Top 40 New #RStats Packages on CRAN for September 2025!
Learn about new packages for data, statistics, finance, and more. These great packages come complete with great documentation, images, references.
Read the post: rworks.dev/posts/septem...
29.10.2025 14:28 — 👍 11 🔁 4 💬 0 📌 0
What's wrong with GitHub?
I didn't know any issue on this and many long-term projects live in Github for R or Python or Java, etc.
Should I be worried about something that I don't even know?
28.10.2025 12:41 — 👍 1 🔁 0 💬 1 📌 0
In a different scale, but @rconsortium.bsky.social has also received a good economic support for the R #RStat community.
bsky.app/profile/rcon...
28.10.2025 12:32 — 👍 3 🔁 1 💬 0 📌 0
In a different scale, but @rconsortium.bsky.social has also received a good economic support for the R #RStat community.
bsky.app/profile/rcon...
28.10.2025 12:32 — 👍 2 🔁 0 💬 0 📌 0

Main image: R+AI 2025 · Nov 12–13 · online · low cost
Skip the hype. Deep dive on R + AI 🧠
R+AI 2025 · Nov 12–13 · online · low cost 💻
Keynote: Joe Cheng (CTO, Posit) — “Keeping LLMs in Their Lane” 🎯
Register: rconsortium.github.io/RplusAI_webs...
#rstats #AI #LLMs #Quarto #RConsortium
22.10.2025 22:38 — 👍 6 🔁 4 💬 0 📌 0
27.10.2025 16:42 — 👍 42 🔁 13 💬 3 📌 1
Hi, I'm Charlotte Wickham and I'm your @weare.rladies.org curator for this week!
I'm a developer educator at @posit.co where I work on the @quarto.org team. Before Posit, I worked at @oregonstate.edu where I taught stats, data science and, of course, #rstats.
20.10.2025 15:49 — 👍 36 🔁 5 💬 1 📌 0

🌍🐾 Este domingo 5/10 es el primer Global Mammal Big Day y Observation.org es la plataforma oficial.
Participa en el BioBlitz de mamíferos de tu país y suma tus observaciones desde cualquier lugar 🦇🦊🐘.
👉 Más info: globalmammalday.com #globalmammalbigday
01.10.2025 06:02 — 👍 3 🔁 2 💬 0 📌 1


🔬El #CSIC es la sexta institución pública de #ciencia más importante del mundo
🌍 Tiene vigentes 525 acuerdos internacionales en 73 países
💡"Somos inevitablemente internacionales", Eloísa del Pino, presidenta del CSIC, en el
#XEncuentroCSICInternacional
30.09.2025 12:04 — 👍 15 🔁 4 💬 0 📌 0

Heatmap with year on x-axis, and dates from Mar-May on y-axis. Colour shows number of cranes observed, showing increasing number of cranes and earlier in the year.
A quick heatmap for #TidyTuesday this week, where we're looking at data on crane sightings in Sweden! Here, I'm using annotations instead of a traditional legend 📊 Thanks to @jenrichmondphd.bsky.social for curating the data!
Code: github.com/nrennie/tidy...
#RStats #ggplot2 #DataViz
30.09.2025 05:50 — 👍 64 🔁 6 💬 2 📌 0
2) many methods includes a corresponding paper. If speed isn't a problem, you don't need to re-invent the wheel, just a propper citation...
27.09.2025 14:35 — 👍 2 🔁 0 💬 1 📌 0


{gm} - Create music with R: flujoo.github.io/gm/
#RStats bookmark from old twitter
25.09.2025 21:50 — 👍 32 🔁 14 💬 0 📌 1

Photo of field crew conducting electroshock sampling for fish as part of the US EPA National Rivers and Streams Assessment in Little Hunting Creek in Virginia, USA.
Photographer: Kevin Biallas
Changing water temperatures and human-driven introductions of fish have altered the composition of fish populations in streams and rivers across the USA over the past three decades, a study in Nature suggests. go.nature.com/47ZCcWH 🧪
24.09.2025 22:30 — 👍 50 🔁 24 💬 1 📌 0

plumber2 0.1.0
plumber2, a complete rewrite of plumber, has landed on CRAN, providing a modern, future proof solution for creating web servers in R. Read all about the new features here.
I am super hyped to finally share the first release of plumber2 with all of you. This has been the center of my attention for a big part of 2025 and I hope you'll find it a worthy update to the venerable plumber package.
The blog post will tell you more
#rstats
24.09.2025 06:51 — 👍 93 🔁 27 💬 2 📌 1
ggpacman is definitely magic! #rstats
13.08.2025 18:44 — 👍 16 🔁 2 💬 1 📌 0
#TidyTuesday Evolución del índice Gini.
Script: vhgauto.github.io/tidytuesday/...
#Rstats #dataviz #Datavisualization
12.08.2025 12:56 — 👍 5 🔁 3 💬 0 📌 0
WeRTogether-useR!2025Keynote
We R Together Yanina Bellini Saibene useR! 2025 Duke University How to learn, use and improve a programming language as a community
1/
I had the honor of giving a keynote at #useR2025 🎉 at Duke University: “We R Together – How to learn, use, and improve a programming language as a community” 💜
Slides here 👉 docs.google.com/presentation...
Video here: www.youtube.com/live/CTTvTQ-...
#rstats #useR2025
12.08.2025 12:26 — 👍 22 🔁 11 💬 1 📌 1

🚀 Arrancamos la semana con novedades y recursos del mundo #RStats
🔔 useR! 2025 → todo el contenido online, libre y gratuito
🧰 Paquetes: recipes, rsample, renv, sf, gt, targets
🎓 Tutorial: conexiones a bases remotas desde Quarto
🌟 Referente: Yanina Bellini (@yabellini)
+ estacion-r.com/newsletter
11.08.2025 12:16 — 👍 4 🔁 2 💬 0 📌 0

WOMBAT 2025 - Tutorial
Nicholas Tierney - Introduction to R packages
29-30 September 2025, Naarm/Melbourne
womabt2025.numbat.space
If you want to organise your own personal code collection or contribute to the broader #RStats ecosystem, you can write your R package!📦️
Nick Tierney will show how to use essential tools that make creating a package a breeze.
Read more and register here: wombat2025.numbat.space/program/tuto...
11.08.2025 02:43 — 👍 24 🔁 9 💬 0 📌 1


Pelotazo en el Desierto del Gobi. Primera observación mundial de la especie Deracanthina deracanthoides, de la que solo hay un registro en colección en GBIF.
Enhorabuena a José Ramón Correas por el registro y la identificación!
observation.org/observation/...
08.08.2025 18:12 — 👍 20 🔁 6 💬 0 📌 1

🏥 Xilin Chen shares how Quarto + R are used to create dynamic hospital reports that help lower unnecessary C-sections at The New York Data Science & AI Conference!
📍Catch her talk Aug 26–27 in NYC or online
🎟️Tix & more info: dataconf.ai/nyc
#HealthcareAnalytics #RStats #dataBS
07.08.2025 19:47 — 👍 7 🔁 3 💬 0 📌 0
Happy to say that 'mocapr' now supports import of joint center positions via .trc files from OpenCap.
github.com/steenharsted...
#rstats #mocap #opencap
07.08.2025 19:51 — 👍 5 🔁 2 💬 0 📌 0

WOMBAT 2025 - Keynote
Nicola Rennie - Designing for decision-making: How to build effective data visualisations
29-30 september 2025, Naarm/Melbourne
womabt2025.numbat.space
This year's keynote by #dataviz whizz Nicola Rennie will explore the creative and technical aspects of designing visualisations that clearly convey data stories.
#DataScience #OpenSource #BusinessAnalytics #DataDrivenDecisions #RStats
07.08.2025 23:43 — 👍 18 🔁 7 💬 0 📌 1

GPT-5: Key characteristics, pricing and model card
I’ve had preview access to the new GPT-5 model family for the past two weeks, and have been using GPT-5 as my daily-driver. It’s my new favorite model. It’s still …
I've had preview access to GPT-5 for a couple of weeks, so I have a lot to say about it. Here's my first post, focusing just on core characteristics, pricing (it's VERY competitively priced) and interesting details from the GPT-5 system card simonwillison.net/2025/Aug/7/g...
07.08.2025 17:44 — 👍 179 🔁 32 💬 13 📌 3

Small multiple area charts for different countries between 1963 and 2023. Darker areas show reduction in Gini coefficient due to tax, with Ireland having the highest reduction.
This week's #TidyTuesday looks at data from @ourworldindata.org on the Gini coefficient (a measure of income inequality) before and after tax 📊
#RStats #ggplot2 #DataViz
07.08.2025 10:04 — 👍 43 🔁 10 💬 2 📌 0

Best Practice for R :: Cheat Sheet #rstats
github.com/wurli/r-bes...
07.08.2025 13:45 — 👍 38 🔁 10 💬 0 📌 0
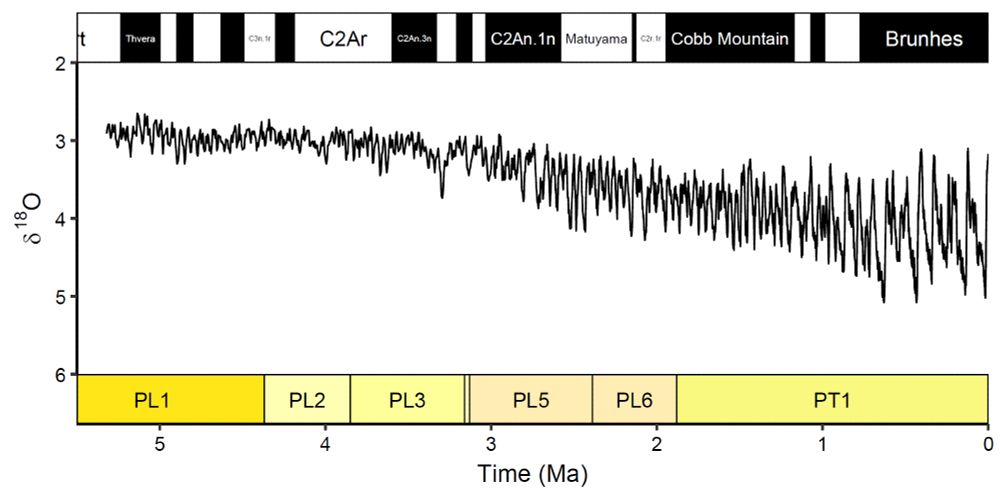
Plot of global benthic δ18O data for 0 – 5.3 Ma (Lisiecki & Raymo, 2005) with geomagnetic polarity subchrons displayed on the top x-axis and planktic foraminiferal primary biozones plotted on the bottom x-axis using the deeptime package.
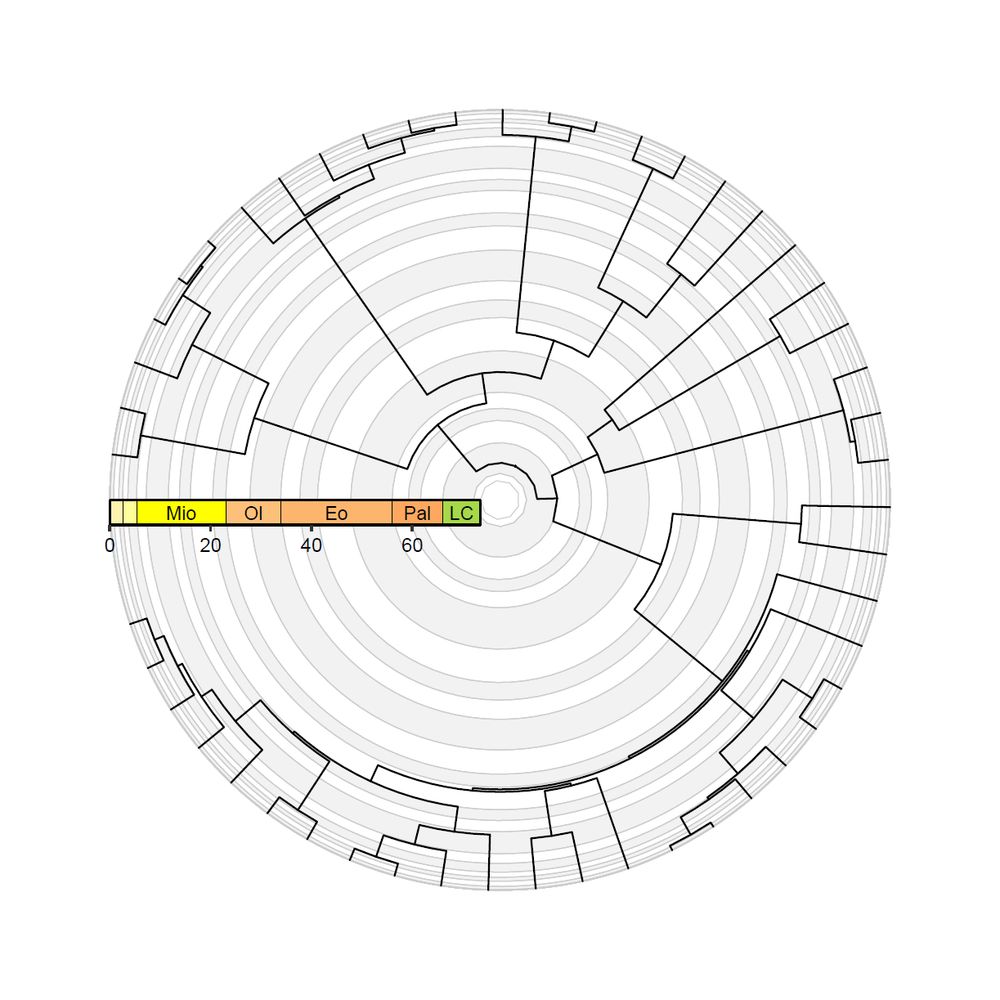
A mammal phylogeny (Garland et al., 1992) plotted in the fan layout using the ggtree and deeptime packages. The greyscale concentric circles in the background indicate geological stages, whereas the linear colored timescale indicates geological epochs.
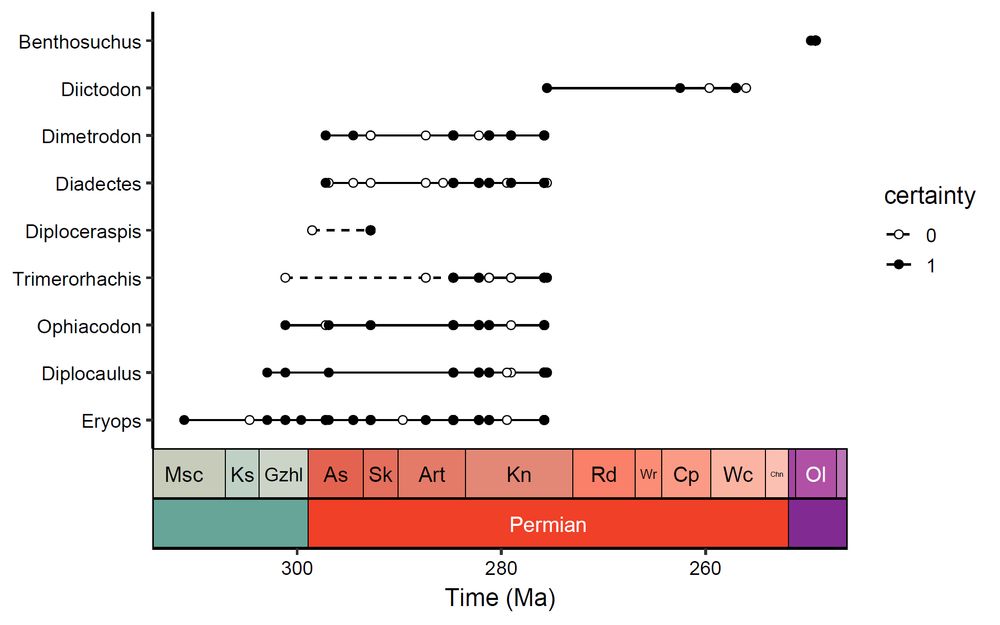
Early tetrapod occurrence data (Jones et al., 2023) plotted as a taxonomic/biostratigraphic range plot using the geom_points_range() function from the deeptime package.
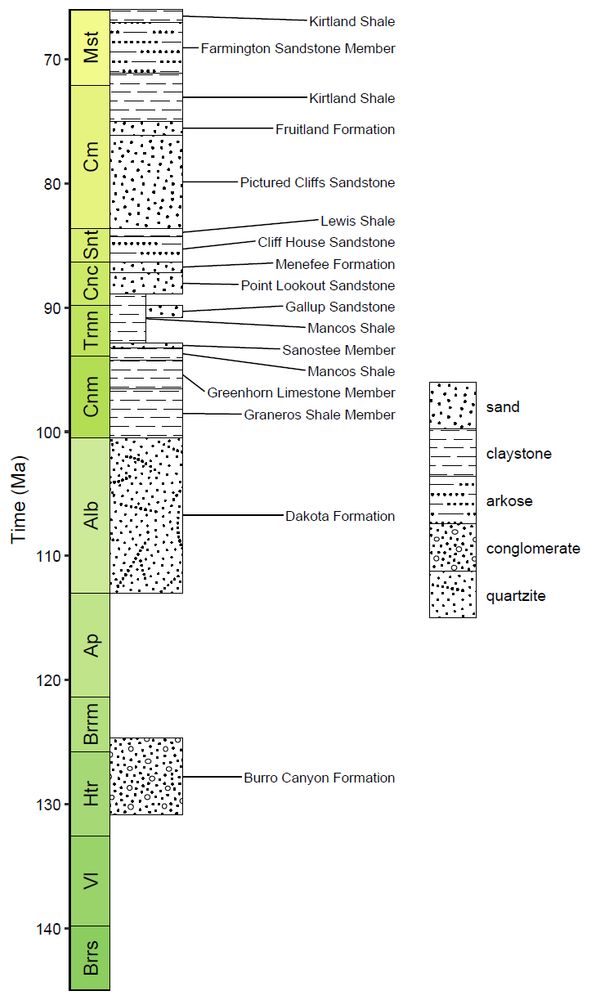
A stratigraphic column of Cretaceous lithostratigraphic units from the San Juan Basin, USA. The deeptime package has been used to add pattern fill which indicate the primary lithologies of the units as reported by the Macrostrat API (Peters et al., 2018) via the rmacrostrat R package (Jones et al., 2024).
📢 deeptime: an R package that facilitates highly customizable and reproducible visualizations of data over geological time intervals
🔗 doi.org/10.1080/2096...
Fully #openaccess in @bigearthdata1.bsky.social with insight about deeptime📦 development and code examples!
#rstats #geology #paleontology
06.08.2025 13:06 — 👍 117 🔁 46 💬 3 📌 3
you know what I blame this on the breakdown of? society
geospatial analysis | web development | project management
🧑💻 President @athlyticz.bsky.social
https://athlyticz.com
rstats, https://www.youtube.com/felixanalytix
R Shiny Consultant + Founder of Free State Analytics
I post about R Shiny, business, and economics
Open source #rstats + #python + data + web
Shiny dev at @posit.co
github.com/schloerke
schloerke.com
A computer scientist in love with #Statistics and #Linguistics doing #MachineLearning and #NLProc as consolation
https://felipebravom.com/
https://ingenieria.uchile.cl/
https://dcc.uchile.cl/
https://idia.uchile.cl/
https://cenia.cl/
https://imfd.cl/
We are the St. Louis, Missouri chapter of R-Ladies. Founded in 2017. 💜👩💻
Almost certainly one of the ecologists of all time.
AI/ML, biodiversity monitoring, viral emergence, open science, methodological anarchism
he/they
🧪 https://poisotlab.io/
📰 https://buttondown.email/ctrl-alt-tim
The central mission of the R Consortium is to support to the R Foundation and key organizations developing, maintaining, distributing R software through the identification, development and implementation of infrastructure projects.
The nonprofit organization behind the Python programming language. For help with Python code: http://python.org/about/help/
On Mastodon: @ThePSF@fosstodon.org
Nature Portfolio’s high-quality products and services across the life, physical, chemical and applied sciences is dedicated to serving the scientific community.
The Gene Ontology (GO, geneontology.org) knowledgebase is the world’s largest source of information on gene function. Our mission is to develop a comprehensive, computational model of biological systems, ranging from the molecular to organism level.
🔥 Free weekly link digests from the best independent writers and bloggers. Covering Gen AI, data science, machine learning, mathematics, and more! Powered by RSS 🤓 ❤️
Subscribe at https://blaze.email. Search blogs and posts: https://blognerd.app.
The Society for Open, Reliable, and Transparent Ecology and Evolutionary Biology. EcoEvoRxiv (https://ecoevorxiv.org) is our preprint server. Become a member at http://sortee.org/join
https://linktr.ee/sortecoevo
PhD Researcher @ Uni Belgrade LIRA Lab | #OpenScience mobilizer | #RStats nerd | distance runner (long enough to reflect on life choices) | #SocialPsyc #HealthPsychology #SciComm | Southeast Europe part of @abrir.bsky.social
orcid.org/0000-0002-0433-0483
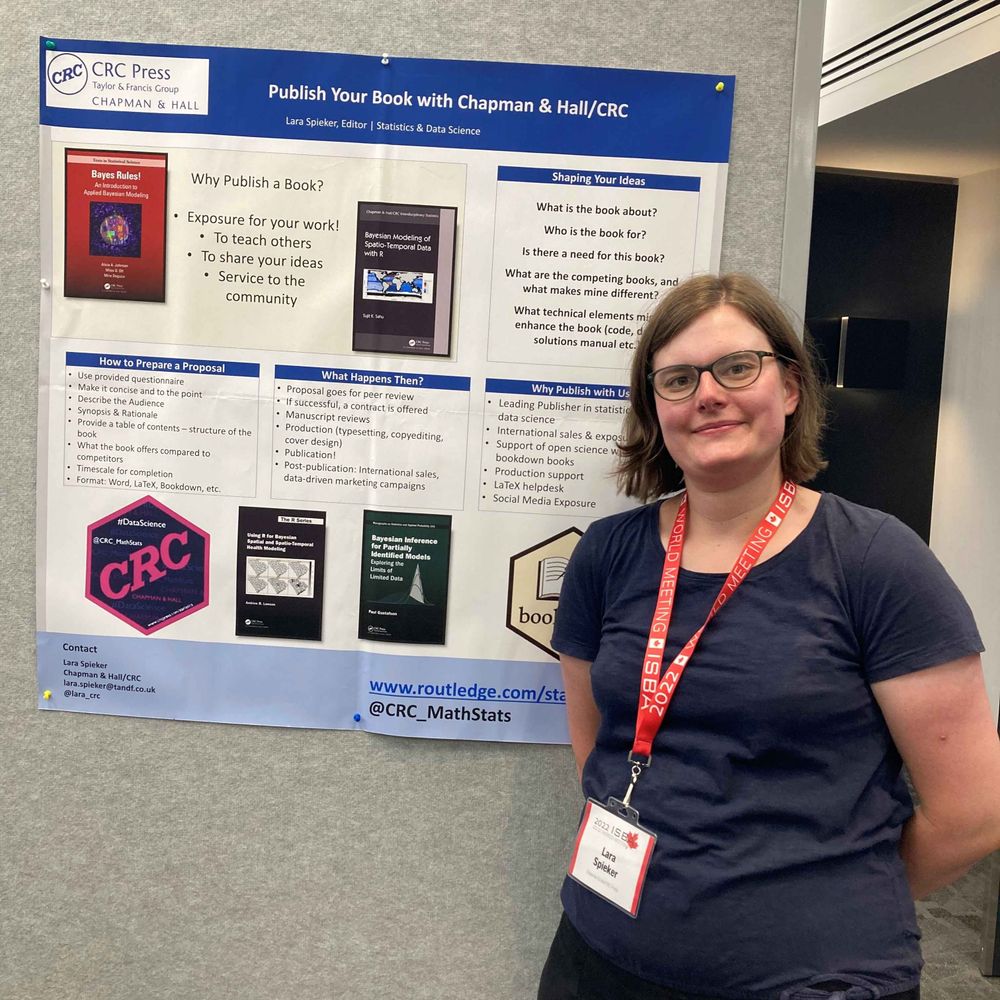
Editor for #Statistics, #RStats and #DataScience books at Chapman & Hall/CRC Press. The usual caveats apply, views are my own. https://www.routledge.com/statistics
Population geneticist and molecular epidemiologist 💻🧬| Post-doc at @wehi-research.bsky.social | @rladiesmelb.bsky.social President | Full time eurovision diva | she/her
About me: https://dionnecargy.github.io/about/
She/Ella | Sociologist & Data Analyst | @rladies.org Global Team | R en Buenos Aires co-organizer | @latinrconf.bsky.social organizing committee
Vienna chapter of R-Ladies Global. Promoting diversity in the #RStats community 🏳️🌈 🏳️⚧️
https://rladies-vienna.github.io
https://meetup.com/rladies-vienna/
https://linkedin.com/company/r-ladies-vienna/
https://mastodon.social/@RLadiesVienna