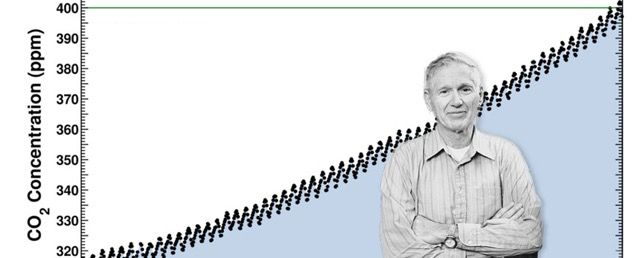
The Keeling Curve's Avatar

The Keeling Curve

@keelingcurve.bsky.social

Official daily update on atmospheric CO2 levels in the post-400 ppm era from Scripps Institution of Oceanography's iconic Keeling Curve.

3,370 Followers  |  286 Following  |  524 Posts  |  Joined: 04.04.2024  |  2.182

Latest posts by keelingcurve.bsky.social on Bluesky

Preview
The Keeling Curve The Keeling Curve is a daily record of global atmospheric carbon dioxide concentration maintained by Scripps Institution of Oceanography at UC San Diego.

Baseline reading not available, data too variable 08-Oct-2025
keelingcurve.ucsd.edu

09.10.2025 16:37 β€” πŸ‘ 4    πŸ” 1    πŸ’¬ 0    πŸ“Œ 0
Preview
The Keeling Curve The Keeling Curve is a daily record of global atmospheric carbon dioxide concentration maintained by Scripps Institution of Oceanography at UC San Diego.

424.06 parts per million (ppm) CO2 in air 07-Oct-2025
keelingcurve.ucsd.edu

08.10.2025 16:39 β€” πŸ‘ 11    πŸ” 7    πŸ’¬ 0    πŸ“Œ 0
Preview
Marine heatwaves modulate food webs and carbon transport processes - Nature Communications A decade of BGC-Argo and plankton records shows North Pacific heatwaves reshape food webs and trap small particles in midwater, slowing deep-ocean carbon export. Impacts vary by event, underscoring the need for sustained ocean monitoring.

🌊 Marine heatwaves and the carbon cycle

A new study shows that marine heatwaves can disrupt food webs and carbon transport in the NE Pacific.

πŸ”— www.nature.com/articles/s41...

#SciComm #ClimateCrisis πŸ§ͺ

07.10.2025 12:38 β€” πŸ‘ 37    πŸ” 19    πŸ’¬ 0    πŸ“Œ 2
Preview
The Keeling Curve The Keeling Curve is a daily record of global atmospheric carbon dioxide concentration maintained by Scripps Institution of Oceanography at UC San Diego.

424.09 parts per million (ppm) CO2 in air 06-Oct-2025
keelingcurve.ucsd.edu

07.10.2025 16:29 β€” πŸ‘ 15    πŸ” 8    πŸ’¬ 0    πŸ“Œ 0
Preview
The Keeling Curve The Keeling Curve is a daily record of global atmospheric carbon dioxide concentration maintained by Scripps Institution of Oceanography at UC San Diego.

423.20 parts per million (ppm) CO2 in air 04-Oct-2025 keelingcurve.ucsd.edu

05.10.2025 20:41 β€” πŸ‘ 14    πŸ” 6    πŸ’¬ 0    πŸ“Œ 1
Preview
The Keeling Curve The Keeling Curve is a daily record of global atmospheric carbon dioxide concentration maintained by Scripps Institution of Oceanography at UC San Diego.

423.04 parts per million (ppm) CO2 in air 03-Oct-2025
keelingcurve.ucsd.edu

04.10.2025 16:52 β€” πŸ‘ 16    πŸ” 7    πŸ’¬ 0    πŸ“Œ 0
Preview
The Keeling Curve The Keeling Curve is a daily record of global atmospheric carbon dioxide concentration maintained by Scripps Institution of Oceanography at UC San Diego.

Baseline reading not available, data too variable 01-Oct-2025
keelingcurve.ucsd.edu

02.10.2025 16:08 β€” πŸ‘ 5    πŸ” 2    πŸ’¬ 0    πŸ“Œ 0

424.15 parts per million (ppm) CO2 in air 29-Sep-2025

30.09.2025 16:23 β€” πŸ‘ 13    πŸ” 6    πŸ’¬ 1    πŸ“Œ 0
Preview
The Keeling Curve The Keeling Curve is a daily record of global atmospheric carbon dioxide concentration maintained by Scripps Institution of Oceanography at UC San Diego.

Communication down 28-Sep-2025 keelingcurve.ucsd.edu

29.09.2025 16:17 β€” πŸ‘ 6    πŸ” 5    πŸ’¬ 1    πŸ“Œ 0
Preview
The Keeling Curve The Keeling Curve is a daily record of global atmospheric carbon dioxide concentration maintained by Scripps Institution of Oceanography at UC San Diego.

Baseline reading not available, data too variable 27-Sep-2025
keelingcurve.ucsd.edu

28.09.2025 16:11 β€” πŸ‘ 6    πŸ” 3    πŸ’¬ 0    πŸ“Œ 0
Preview
The Keeling Curve The Keeling Curve is a daily record of global atmospheric carbon dioxide concentration maintained by Scripps Institution of Oceanography at UC San Diego.

423.91 parts per million (ppm) CO2 in air 26-Sep-2025
keelingcurve.ucsd.edu

27.09.2025 18:06 β€” πŸ‘ 14    πŸ” 8    πŸ’¬ 0    πŸ“Œ 0
Preview
The Keeling Curve The Keeling Curve is a daily record of global atmospheric carbon dioxide concentration maintained by Scripps Institution of Oceanography at UC San Diego.

423.18 parts per million (ppm) CO2 in air 25-Sep-2025
keelingcurve.ucsd.edu

27.09.2025 18:05 β€” πŸ‘ 5    πŸ” 2    πŸ’¬ 0    πŸ“Œ 0
Preview
The Keeling Curve The Keeling Curve is a daily record of global atmospheric carbon dioxide concentration maintained by Scripps Institution of Oceanography at UC San Diego.

423.85 parts per million (ppm) CO2 in air 24-Sep-2025
keelingcurve.ucsd.edu

25.09.2025 18:13 β€” πŸ‘ 7    πŸ” 8    πŸ’¬ 0    πŸ“Œ 0
Preview
The Keeling Curve The Keeling Curve is a daily record of global atmospheric carbon dioxide concentration maintained by Scripps Institution of Oceanography at UC San Diego.

423.62 parts per million (ppm) CO2 in air 23-Sep-2025
keelingcurve.ucsd.edu

24.09.2025 16:06 β€” πŸ‘ 14    πŸ” 6    πŸ’¬ 2    πŸ“Œ 0
Preview
The Keeling Curve The Keeling Curve is a daily record of global atmospheric carbon dioxide concentration maintained by Scripps Institution of Oceanography at UC San Diego.

423.72 parts per million (ppm) CO2 in air 22-Sep-2025
keelingcurve.ucsd.edu

23.09.2025 16:12 β€” πŸ‘ 17    πŸ” 5    πŸ’¬ 0    πŸ“Œ 0
Preview
The Keeling Curve The Keeling Curve is a daily record of global atmospheric carbon dioxide concentration maintained by Scripps Institution of Oceanography at UC San Diego.

423.72 parts per million (ppm) CO2 in air 21-Sep-2025
keelingcurve.ucsd.edu

22.09.2025 23:27 β€” πŸ‘ 13    πŸ” 8    πŸ’¬ 0    πŸ“Œ 0
Preview
The Keeling Curve The Keeling Curve is a daily record of global atmospheric carbon dioxide concentration maintained by Scripps Institution of Oceanography at UC San Diego.

423.58 parts per million (ppm) CO2 in air 20-Sep-2025
keelingcurve.ucsd.edu

21.09.2025 16:34 β€” πŸ‘ 14    πŸ” 11    πŸ’¬ 0    πŸ“Œ 0
Preview
The Keeling Curve The Keeling Curve is a daily record of global atmospheric carbon dioxide concentration maintained by Scripps Institution of Oceanography at UC San Diego.

424.06 parts per million (ppm) CO2 in air 19-Sep-2025
keelingcurve.ucsd.edu

20.09.2025 17:48 β€” πŸ‘ 36    πŸ” 13    πŸ’¬ 0    πŸ“Œ 0
Preview
The Keeling Curve The Keeling Curve is a daily record of global atmospheric carbon dioxide concentration maintained by Scripps Institution of Oceanography at UC San Diego.

423.05 parts per million (ppm) CO2 in air 17-Sep-2025
keelingcurve.ucsd.edu

18.09.2025 16:28 β€” πŸ‘ 9    πŸ” 4    πŸ’¬ 0    πŸ“Œ 1
Preview
The Keeling Curve The Keeling Curve is a daily record of global atmospheric carbon dioxide concentration maintained by Scripps Institution of Oceanography at UC San Diego.

Baseline reading not available, data too variable 16-Sep-2025
keelingcurve.ucsd.edu

17.09.2025 17:04 β€” πŸ‘ 13    πŸ” 5    πŸ’¬ 0    πŸ“Œ 0
Preview
The Keeling Curve The Keeling Curve is a daily record of global atmospheric carbon dioxide concentration maintained by Scripps Institution of Oceanography at UC San Diego.

Baseline reading not available, data too variable 15-Sep-2025
keelingcurve.ucsd.edu

17.09.2025 01:47 β€” πŸ‘ 3    πŸ” 2    πŸ’¬ 0    πŸ“Œ 0
Preview
The Keeling Curve The Keeling Curve is a daily record of global atmospheric carbon dioxide concentration maintained by Scripps Institution of Oceanography at UC San Diego.

423.84 parts per million (ppm) CO2 in air 13-Sep-2025
keelingcurve.ucsd.edu

15.09.2025 01:16 β€” πŸ‘ 16    πŸ” 9    πŸ’¬ 1    πŸ“Œ 0
Preview
The Keeling Curve The Keeling Curve is a daily record of global atmospheric carbon dioxide concentration maintained by Scripps Institution of Oceanography at UC San Diego.

424.15 parts per million (ppm) CO2 in air 12-Sep-2025
keelingcurve.ucsd.edu

13.09.2025 19:40 β€” πŸ‘ 10    πŸ” 5    πŸ’¬ 0    πŸ“Œ 0
Preview
The Keeling Curve The Keeling Curve is a daily record of global atmospheric carbon dioxide concentration maintained by Scripps Institution of Oceanography at UC San Diego.

424.15 parts per million (ppm) CO2 in air 11-Sep-2025
keelingcurve.ucsd.edu

12.09.2025 16:06 β€” πŸ‘ 61    πŸ” 25    πŸ’¬ 2    πŸ“Œ 3
Preview
The Keeling Curve The Keeling Curve is a daily record of global atmospheric carbon dioxide concentration maintained by Scripps Institution of Oceanography at UC San Diego.

424.60 parts per million (ppm) CO2 in air 10-Sep-2025
keelingcurve.ucsd.edu

11.09.2025 17:43 β€” πŸ‘ 18    πŸ” 10    πŸ’¬ 0    πŸ“Œ 0
Preview
The Keeling Curve The Keeling Curve is a daily record of global atmospheric carbon dioxide concentration maintained by Scripps Institution of Oceanography at UC San Diego.

423.11 parts per million (ppm) CO2 in air 09-Sep-2025
keelingcurve.ucsd.edu

10.09.2025 21:46 β€” πŸ‘ 10    πŸ” 5    πŸ’¬ 0    πŸ“Œ 0
Preview
The Keeling Curve The Keeling Curve is a daily record of global atmospheric carbon dioxide concentration maintained by Scripps Institution of Oceanography at UC San Diego.

Baseline reading not available, data too variable 08-Sep-2025
keelingcurve.ucsd.edu

10.09.2025 00:59 β€” πŸ‘ 6    πŸ” 2    πŸ’¬ 0    πŸ“Œ 0
Preview
The Keeling Curve The Keeling Curve is a daily record of global atmospheric carbon dioxide concentration maintained by Scripps Institution of Oceanography at UC San Diego.

424.11 parts per million (ppm) CO2 in air 07-Sep-2025
keelingcurve.ucsd.edu

08.09.2025 16:07 β€” πŸ‘ 9    πŸ” 3    πŸ’¬ 0    πŸ“Œ 0
Preview
The Keeling Curve The Keeling Curve is a daily record of global atmospheric carbon dioxide concentration maintained by Scripps Institution of Oceanography at UC San Diego.

423.73 parts per million (ppm) CO2 in air 06-Sep-2025
keelingcurve.ucsd.edu

07.09.2025 16:56 β€” πŸ‘ 15    πŸ” 11    πŸ’¬ 0    πŸ“Œ 0
Preview
The Keeling Curve The Keeling Curve is a daily record of global atmospheric carbon dioxide concentration maintained by Scripps Institution of Oceanography at UC San Diego.

424.70 parts per million (ppm) CO2 in air 05-Sep-2025
keelingcurve.ucsd.edu

07.09.2025 09:26 β€” πŸ‘ 18    πŸ” 9    πŸ’¬ 0    πŸ“Œ 0

@keelingcurve is following 20 prominent accounts