
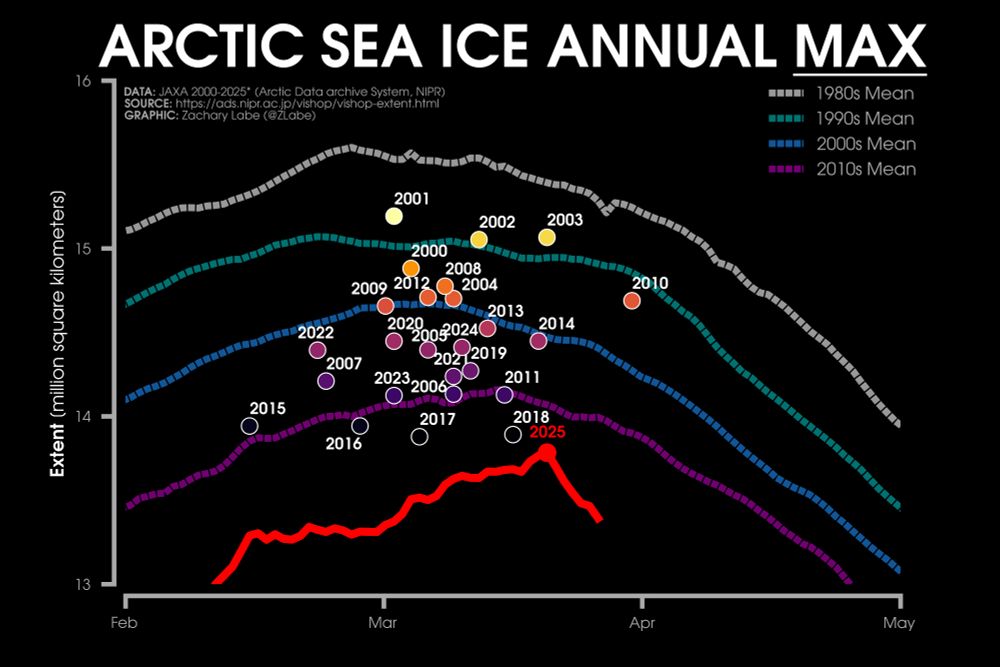
Line graph time series of 2025's daily Arctic sea ice extent compared to decadal averages from the 1980s to the 2010s. Additional scatter points show the maximum extents from 2000 to 2025. There is a long-term decreasing trend in ice extent for every day of the year.
Well the melt season is now rapidly underway 😳
28.03.2025 16:36 — 👍 251 🔁 108 💬 11 📌 15