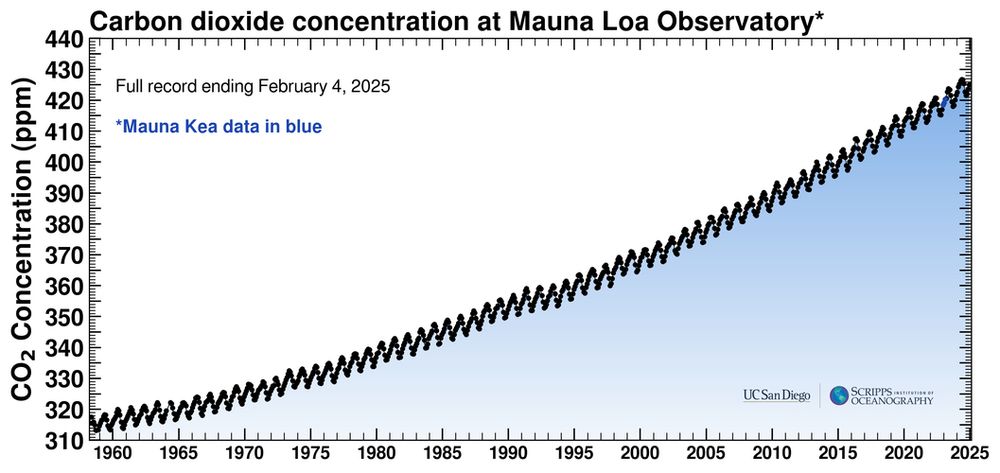
A graph of atmospheric carbon dioxide concentrations at the Mauna Loa observatory, Hawaii, from 1958 to 4th February 2025. It shows carbon dioxide levels rising at an accelerating rate over the decades. This is known to be due to emissions of carbon dioxide from human activity, mainly fossil fuel burning but also deforestation. The first CO2 concentration value in March 1958 was 315 parts per million (ppm). The latest daily value is 426 ppm. The graph also shows a seasonal cycle of a few ppm within each year, which is known to be linked to the growing season in the northern hemisphere causing a temporary uptake of carbon in spring and summer and release in autumn. The graph is produced routinely by the Scripps Institution of Oceanography, UC San Diego.
Although NOAA's page on atmospheric CO2 levels has vanished, you can still get this vital information from Ralph Keeling's team at the Scripps Institution of Oceanography, UC San Diego keelingcurve.ucsd.edu
Please follow bsky.app/profile/keel... for updates and share
Don't let science be hidden
05.02.2025 10:27 — 👍 1819 🔁 957 💬 45 📌 45
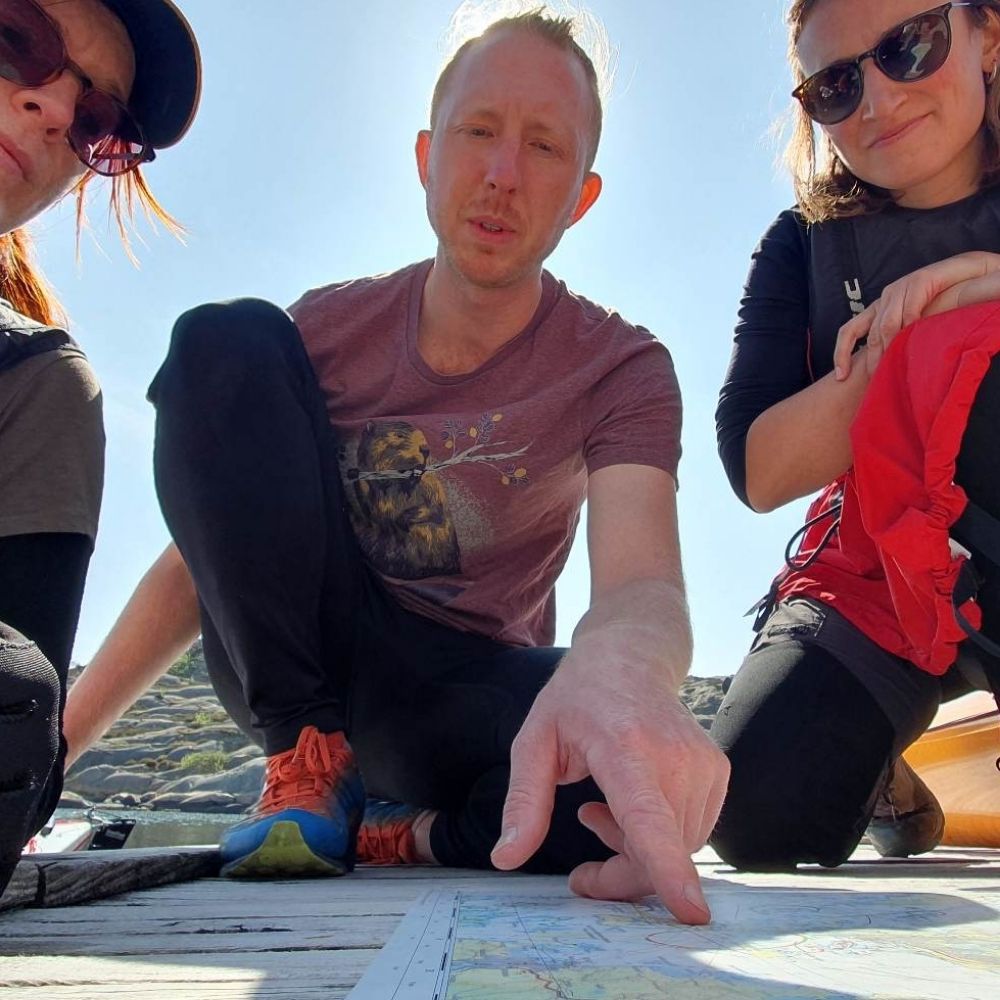
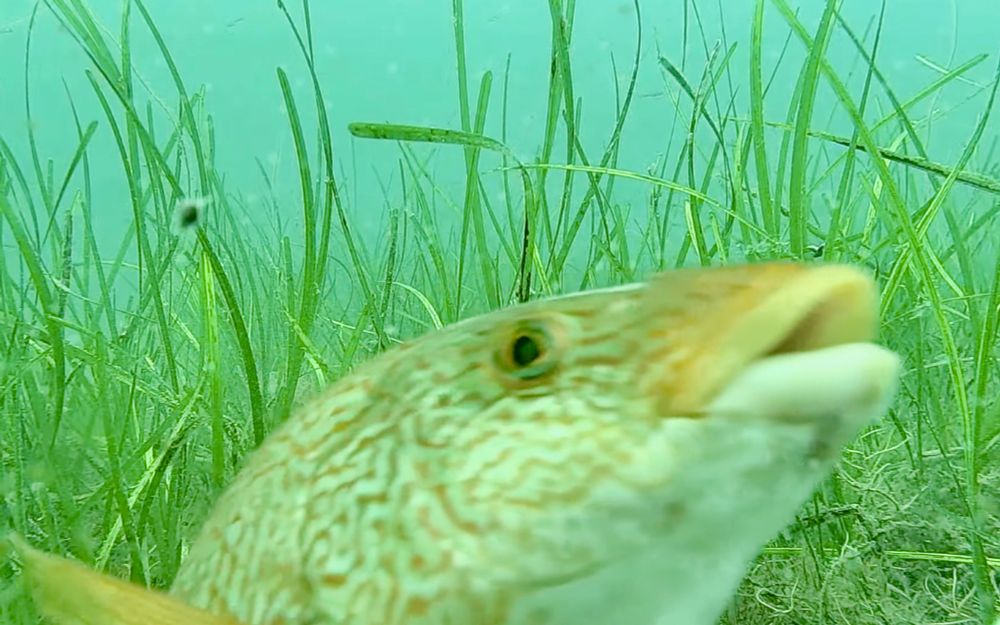
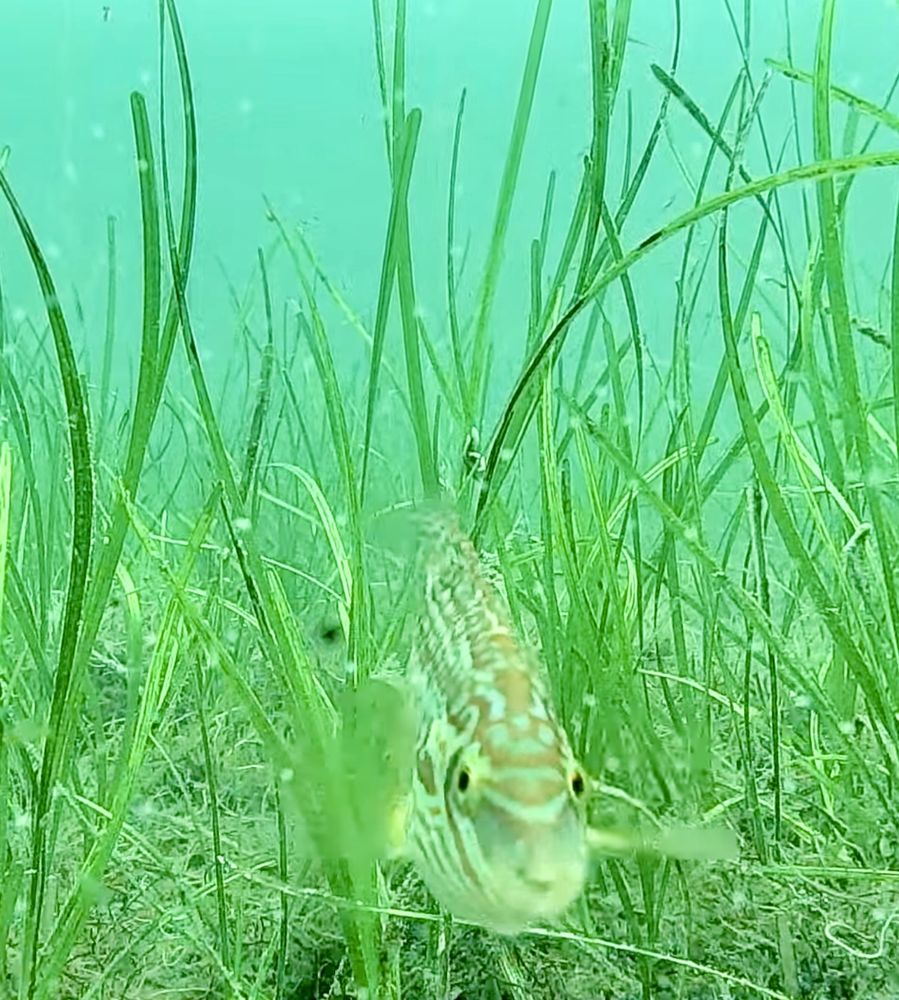
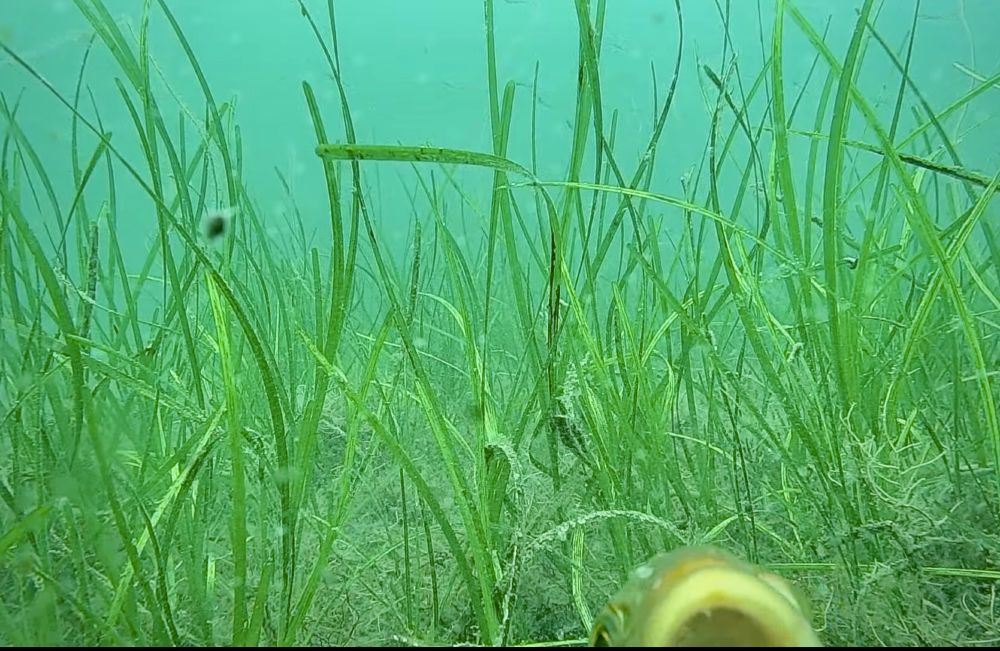
Measuring critical thermal maximum in aquatic ectotherms: a practical guide
Authors continued
@whatahoot.bsky.social
@lkuchenmuller.bsky.social
Moa Metz
Lauren Rowsey
@leon-at-sea.bsky.social
Robert Griffin
Sidney Martin
Heather Bauer Reid
@rasmusern.bsky.social
@erasheim.bsky.social
Zara Cowan
@leeuwisrobin.bsky.social
@drtblew.bsky.social
Ben Speers-Roesch
03.02.2025 18:43 — 👍 3 🔁 2 💬 1 📌 0
Salmon scientist and an angry optimist. Evolution & Physiology 🐟🌡️🧬
Senior scientist & Research Fellow @luke.fi. Lohitutkija. She/her.
PhD candidate at Deakin University, Australia | @clark-ecophys
Ecophysiology and fish parasites🐟🪱
Find out about my research here: maryane-gradito.owlstown.net
Senior Policy Advisor SSHRC, meta-research, open science, ecology and evolution. Past SORTEE president (www.sortee.org)
Website: https://dominiqueroche.weebly.com/
Marine biologist and fish entusiast🐟Passionate in fish ecophysiology and behaviour🐟. Researcher in Fish Welfare at Wageningen University & Research, Affiliate Researcher at Anttila Lab, University of Turku.
Judoka, Freediver, Spearfisherman & OceanLover
MSCActions postdoc at @ebdonana.bsky.social | Researcher on #stress ecophysiology | Previously: Research group leader at
@tubraunschweig.bsky.social | 🐸(mostly) 🐟 (a bit) ❄️🌡️☣️ | dog lover | art enthusiast | runner
marine ecologist | Assistant Professor at UT-Austin | coral reefs | molecular ecology | food webs | trophic interactions | sciart | she/her
https://caseylab.weebly.com/
Assistant Professor at UT Austin's Marine Science Institute | Fishes, functions, and marine ecosystems | he/his | Views are my own
www.fishandfunctions.com 🐡📉
Evolutionary biologist working on ageing, phenotypic plasticity and local adaptation
Nematodes, flycatchers, insects, fish...
PI at Uppsala University, Senior Lecturer at Halmstad University
🌍 An international learned society based in the UK that supports scientific activity in fish biology and fisheries science.
📖 Regular updates from the society's journal, the Journal of Fish Biology #JFB.
Page managed by @DrWillPerry.bsky.social
Researcher at the Swedish Agricultural University (SLU)
Fish, physiology, conservation.
Also eels.
Fish ecology, physiology and behaviour. Fascinated by the underwater world.
Postdoctoral fellow at IFREMER-MARBEC
(she/her)
PhD candidate studying brook trout conservation physiology @TrentUniversity 🐟 mediocre fly fisher, formerly athletic, salmonid snob @UBCForestry alum (she/her)
Researcher - University of Bergen.
Ecophysiologist interested in the effects of temperature and hypoxia on fish.
Postdoc at McMaster University. Junior Editor for J Exp Zool A. Board member for @girlsinscience.ca. Animal physiologist. New mom. Learning how all the coolest animals work 🐠🐸🦇
https://www.giulia-rossi.com
PhD candidate at Deakin University 🐟
On Wadawurrung Country 🦘🌏
University of Idaho alum 💛🩶
Here for the fish science! | She/her
Find my work: https://elizabeth-hoots.owlstown.net
Professor of Marine Ecology at GEOMAR / Kiel University, trained ecoevophysiologist, interested in coastal invertebrates, algae & climate change.
PhD student @Clark_Ecophys Deakin University | marine ecophysiology and climate change
Biologist, Nature filmmaker & photographer, Science communicator.
Waitress turned Congresswoman for the Bronx and Queens. Grassroots elected, small-dollar supported. A better world is possible.
ocasiocortez.com