
Disko Island before and after an Atmospheric River Event (July 2023).
More info here: onlinelibrary.wiley.com/doi/full/10....
Disko Island before and after an Atmospheric River Event (July 2023).
More info here: onlinelibrary.wiley.com/doi/full/10....
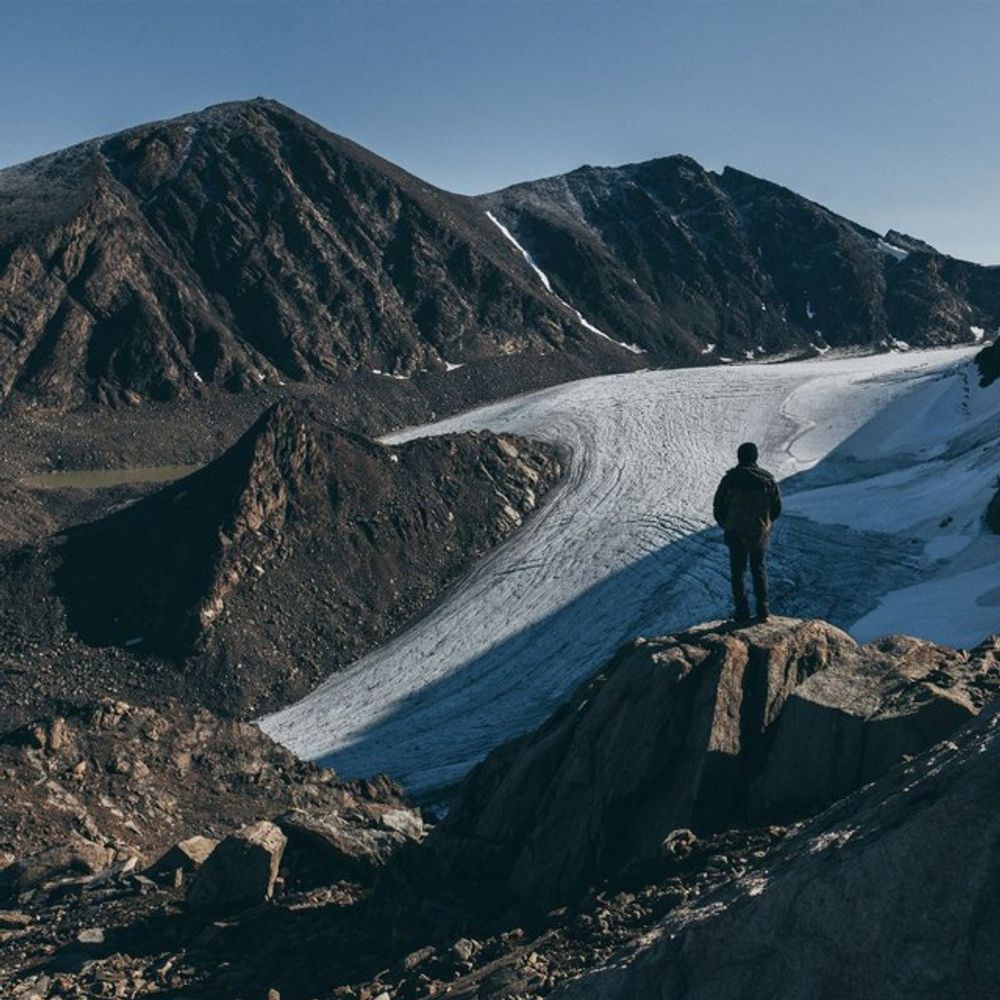
In early July 2023, a series of rapid mass movements were triggered by extreme precipitation (and snowmelt) carried by an atmospheric river in Qeqertarsuaq (Disko Island), West Greenland.
In our last work, published today, we briefly analyzed the event, read the paper here: lnkd.in/gA_T4d2H

#CopernicusClimate has released its first data from the Copernicus pan-Arctic Regional Reanalysis (CARRA2): 2.5 km pan‑Arctic coverage, 24 years of data in the Climate Data Store, more realistic physics & improved details for local extremes, lots of added details with respect to ERA5.
⬇️

Line graph time series of 2025's daily Arctic sea ice extent compared to each year from 1979 to 2024 as shown with thin lines in colors from purple to white. There is large daily variability, but a long-term decreasing trend during all months of the year. A seasonal cycle is also visible in this region.
Ice-free conditions continue in the Barents Sea region of the #Arctic Ocean. This is one area that has observed some of the largest losses of ice over the last few decades... compare the older years (dark/purple lines) to today!
Map of this region: zacklabe.files.wordpress.com/2022/08/b203...


Relict rock glaciers and other periglacial landforms close to San Pellegrino pass, Italian Dolomites.
More info: www.gfdq.glaciologia.it/index.php/GF...
This is great, do you have any approximate date for the first releases?
02.10.2025 10:02 — 👍 0 🔁 0 💬 0 📌 0
A 3D animation from our last paper. We compared GPR ice thickness data with modelling approaches in two polythermal glaciers in W-Greenland.
Check it out: www.cambridge.org/core/journal...
3D Data: Pléiades © CNES 2019, Distribution Airbus D&S
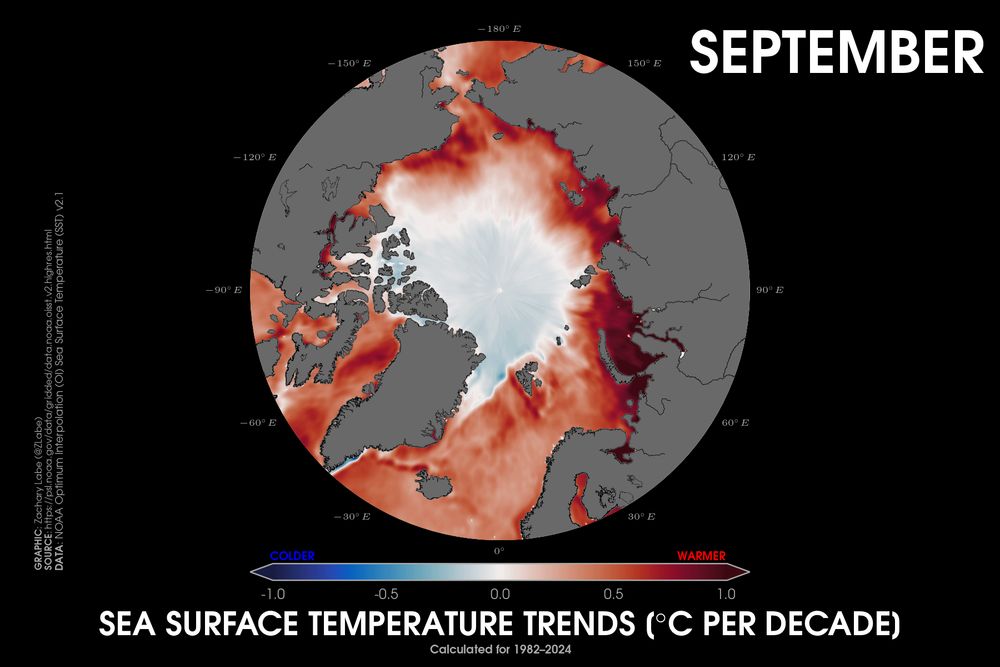
Polar stereographic map of sea surface temperature trends for Septembers from 1979 to 2024. Red shading is shown for warming trends, and blue shading is shown for cooling trends. All areas of the ocean are observing warming.
Sea surface temperatures are warming across the entire periphery of the #Arctic Ocean in September.
This is especially observed in areas with long-term declines in sea ice concentration, such around the Chukchi and Kara Seas.
Data from NOAA OISSTv2.1. For more info arctic.noaa.gov/report-card/...
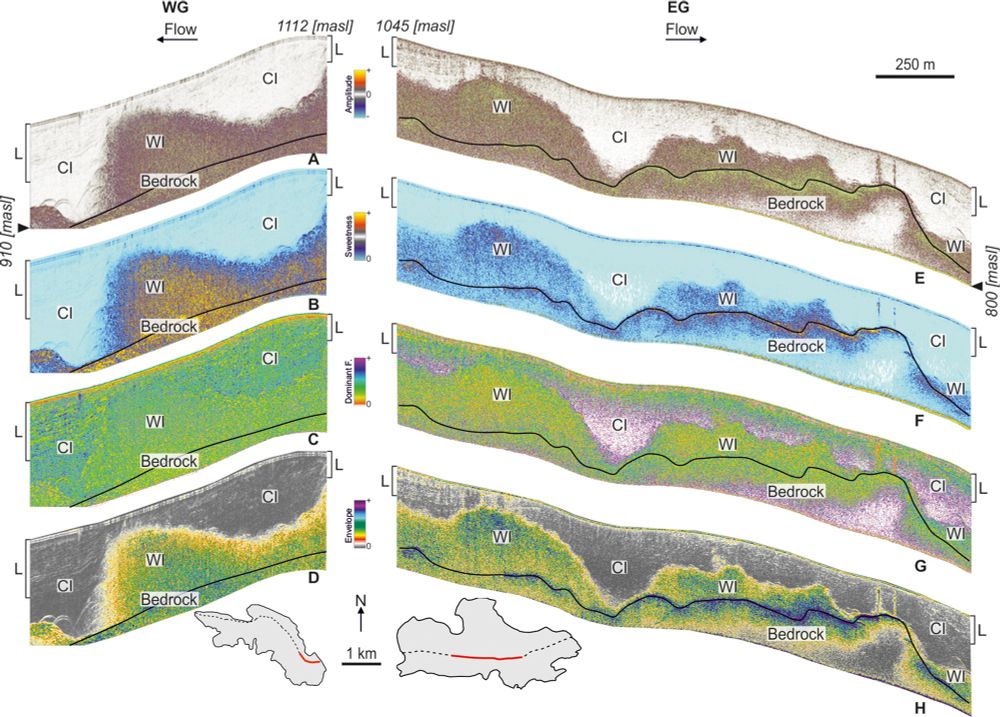

Our new paper compares GPR ice thickness data with models and looks at glacier thermal structures in Greenland, showing that thermal complexity (warm-cold ice) inside these glaciers is higher than expected.
Read it here:
www.cambridge.org/core/journal...

📣📣 Call For Donations! 💰💰
I am raising funds to finance the 2025 'glacier subfossil wood' field campaign!
Do you want to continue hearing tales about glaciers and trees? 🧊🌲💍
I need your help! 🤍
To learn more:
wemakeit.com/projects/gla...
🙏🙏 Please share it widely! 🙏🙏

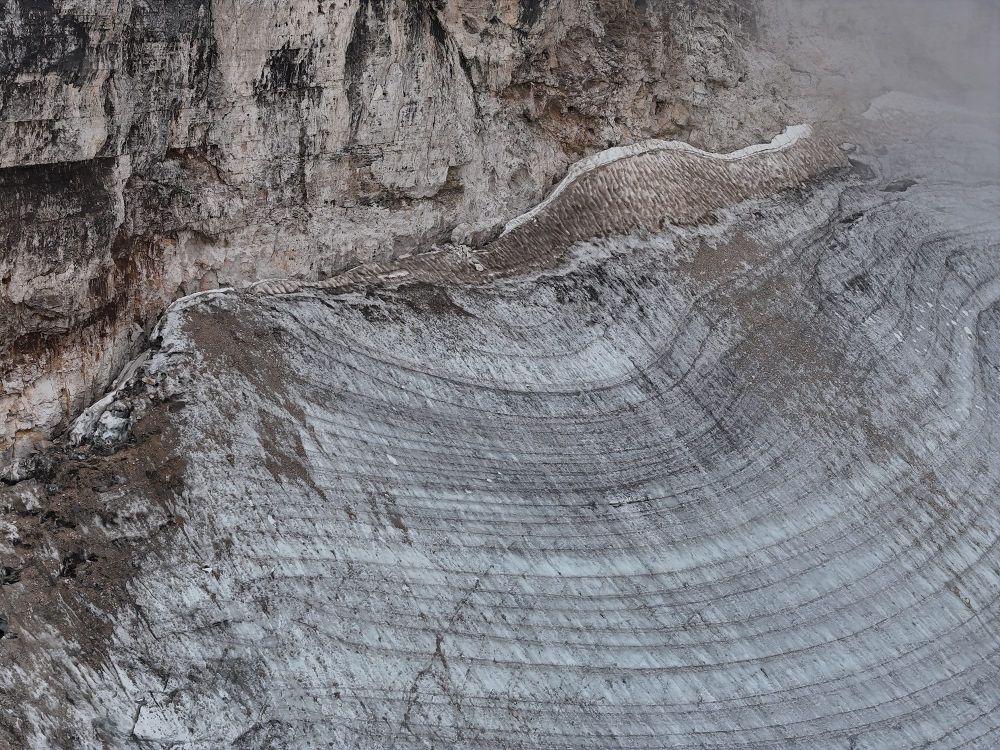

What remains of the former Fradusta Glacier (Pale di San Martino), in the Italian Dolomites.
Photos from Sept. 5, 2025


A few snapshots of Travignolo #Glacier on Sept. 4, 2025. A small glacier nested in the Italian #Dolomites (Pale di San Martino).
06.09.2025 11:40 — 👍 5 🔁 1 💬 0 📌 0
2024 glacier loss in Svalbard was beyond imagination! 😱
- Anomaly of up to 4 SD!
- Amounts to ~61.7 Gt => 1% of the total ice volume
- Comparable to that of the Greenland ice sheet (55 Gt), which is 50 x larger!
... Otherworldly! 🪐
www.pnas.org/doi/10.1073/...


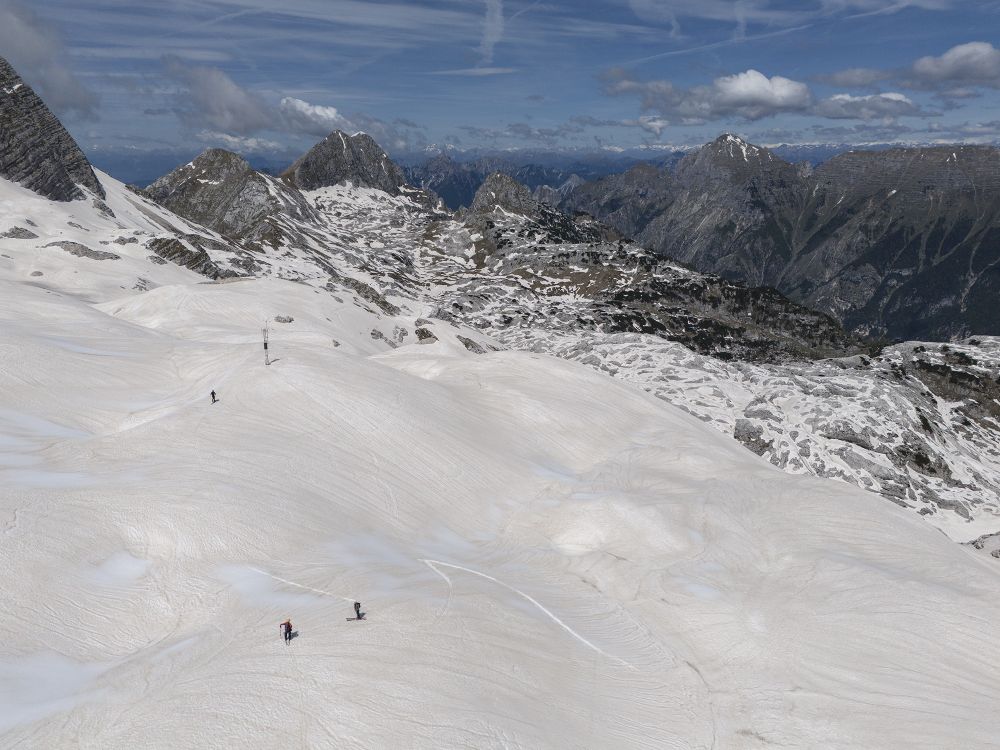
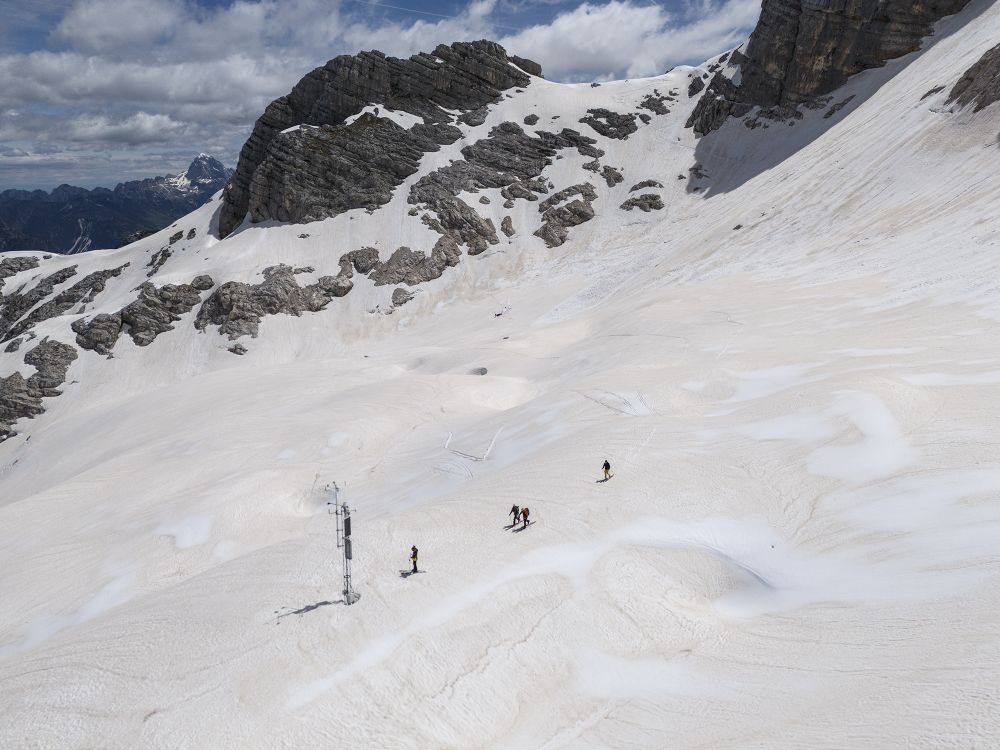
Canin East Ice Patch in the Italian Julian Alps and the AWS nearby, managed by the Alpine-Adriatic Meteorological Society. Photo from last friday (Aug 8)
12.08.2025 12:53 — 👍 5 🔁 3 💬 0 📌 0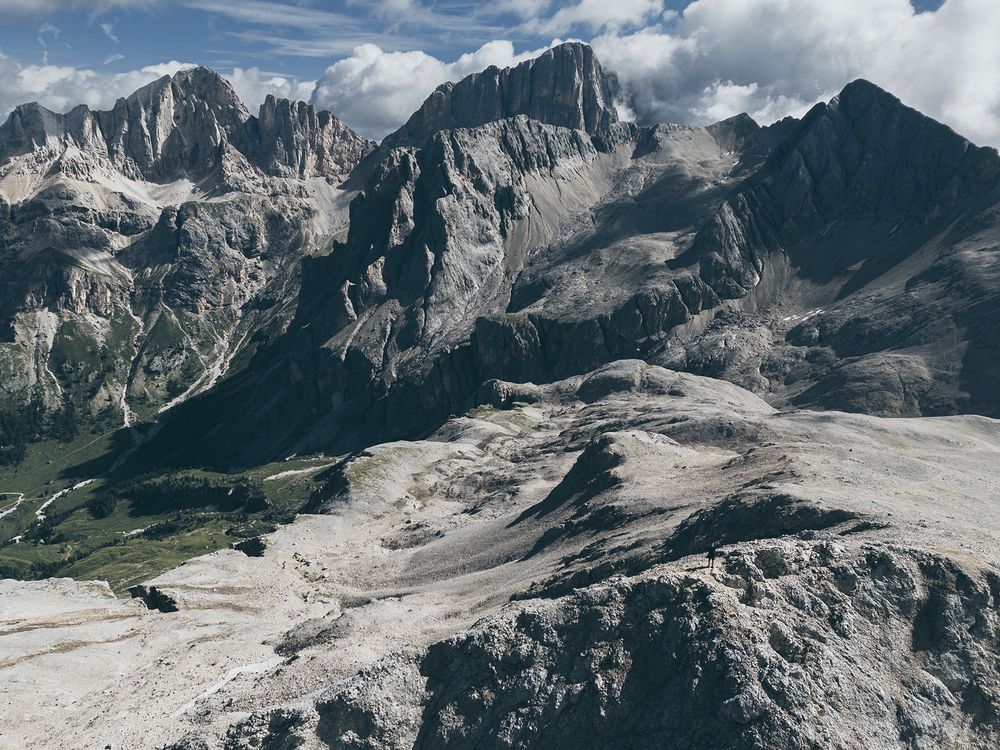
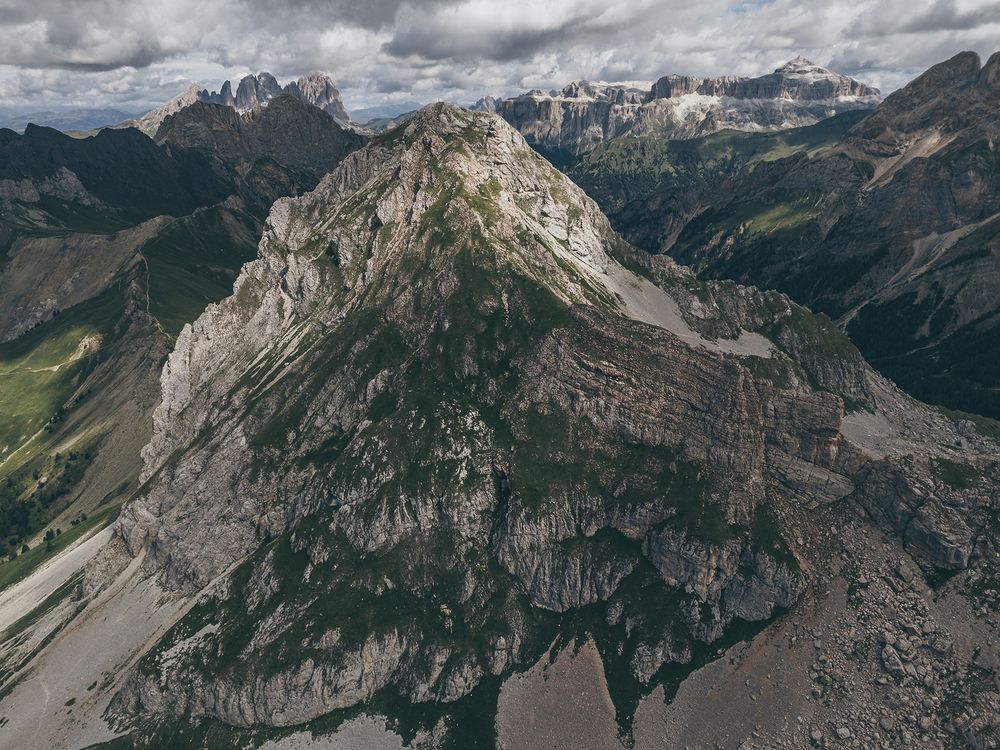
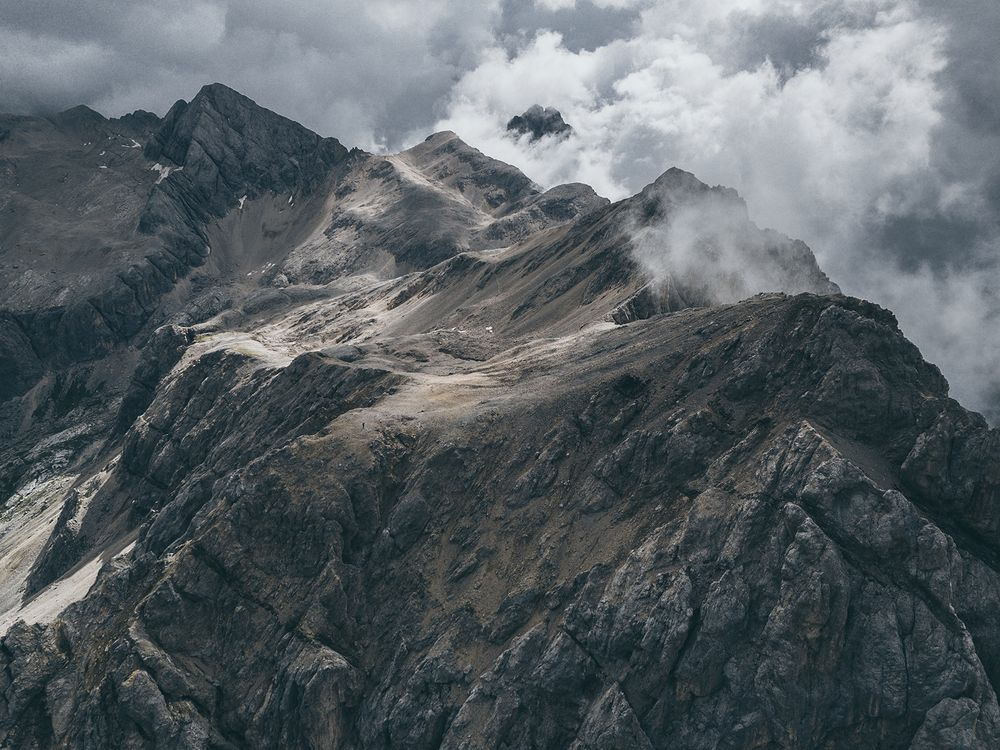
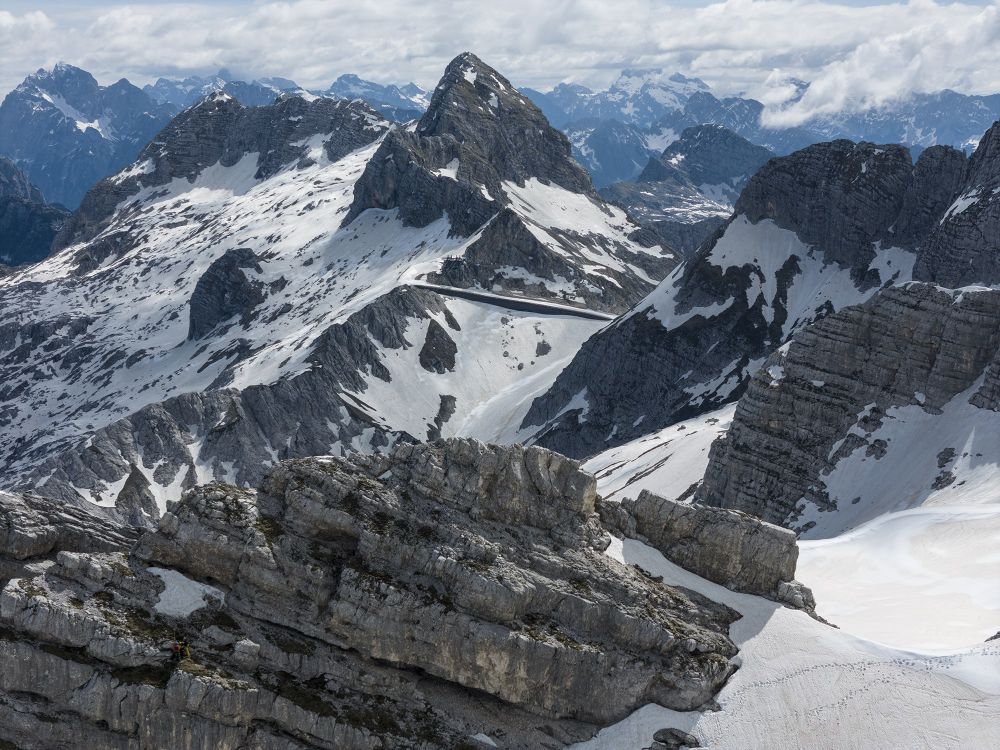
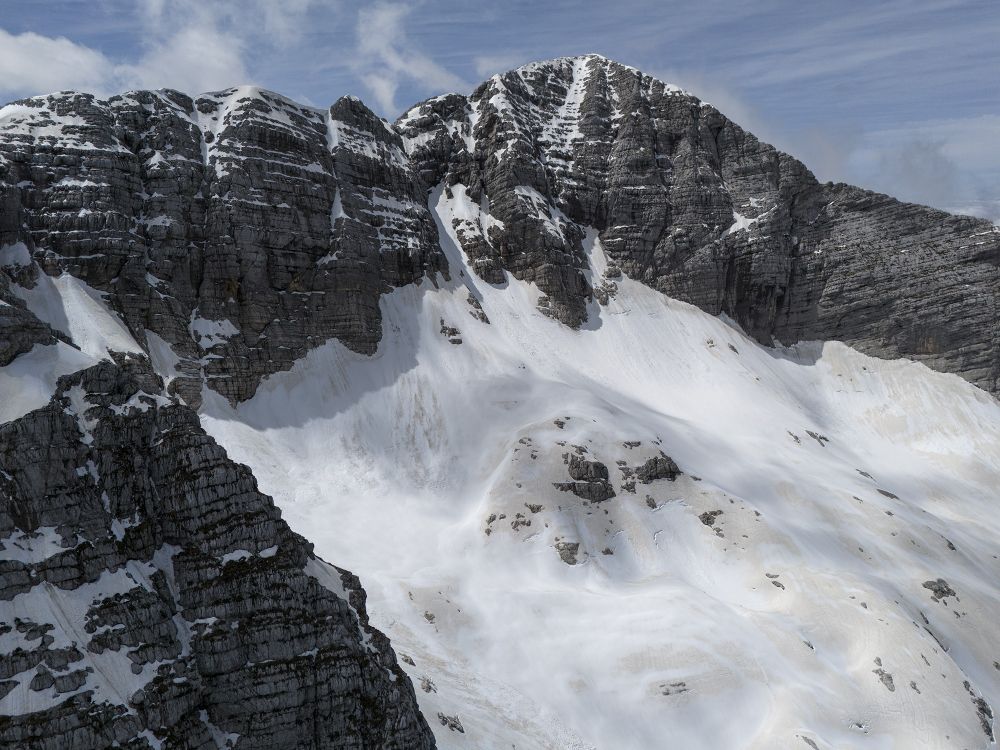
Epic views from last Wednesday fieldwork in the Dolomites, close to Cima D'Uomo.
02.08.2025 12:06 — 👍 4 🔁 1 💬 0 📌 0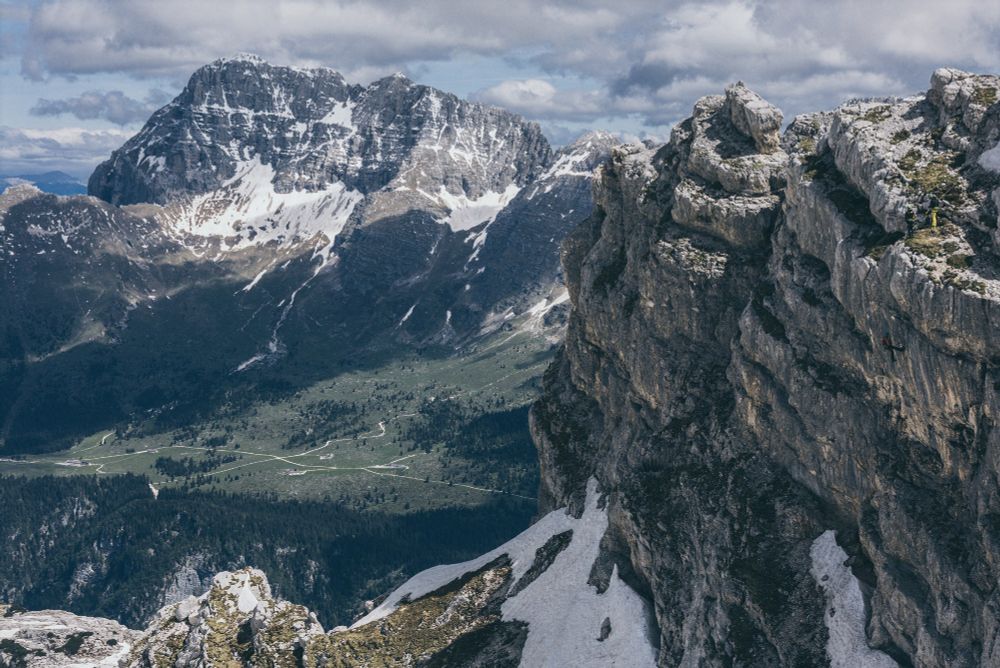
Possibly the most unreachable webcam of the Julian Alps, monitoring the Canin East ice patch
#enlapse #julianalps #timelapse #cryosphere
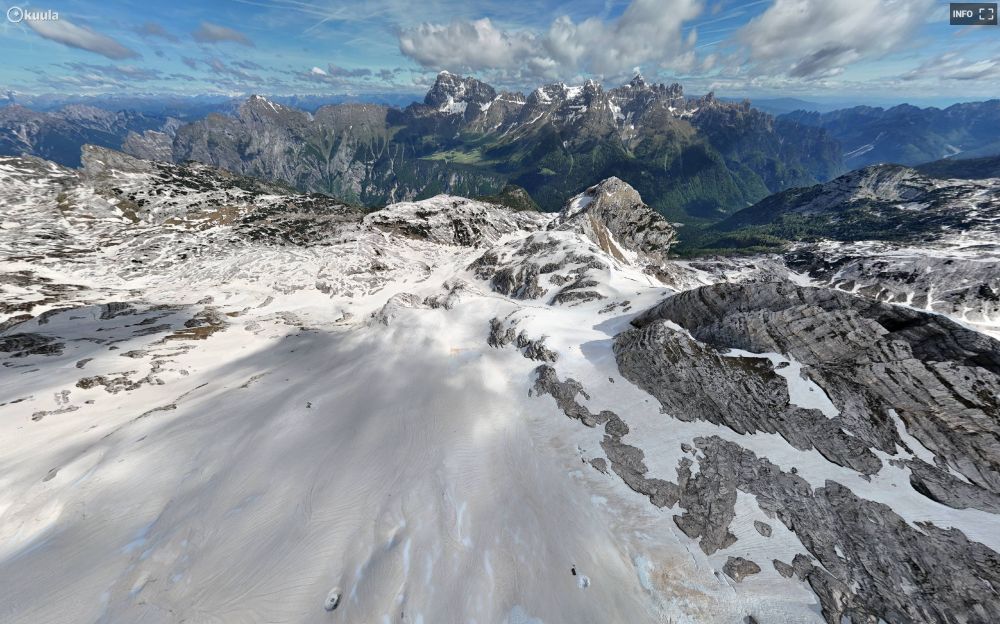
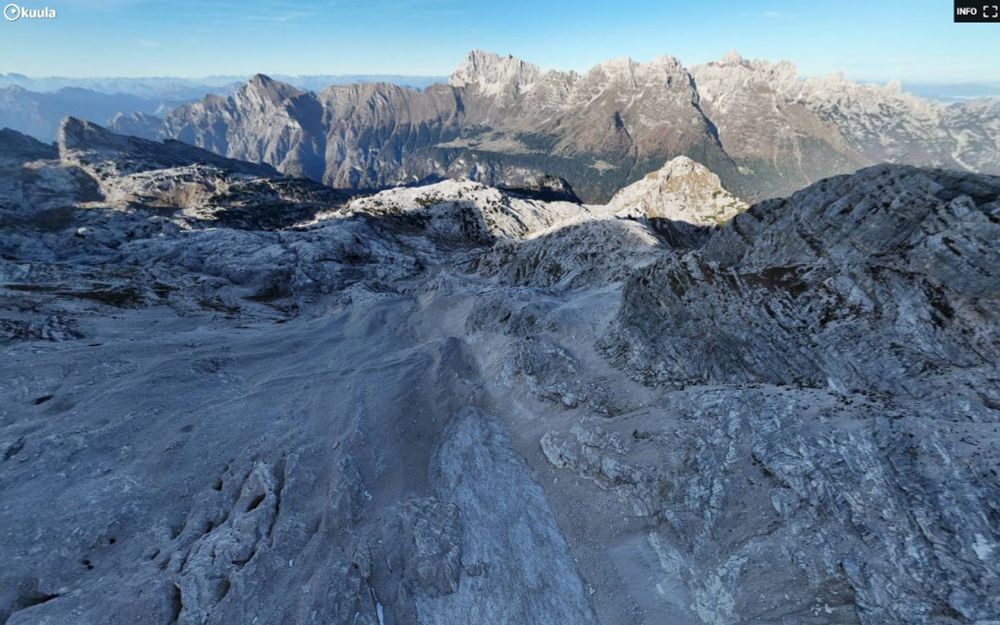
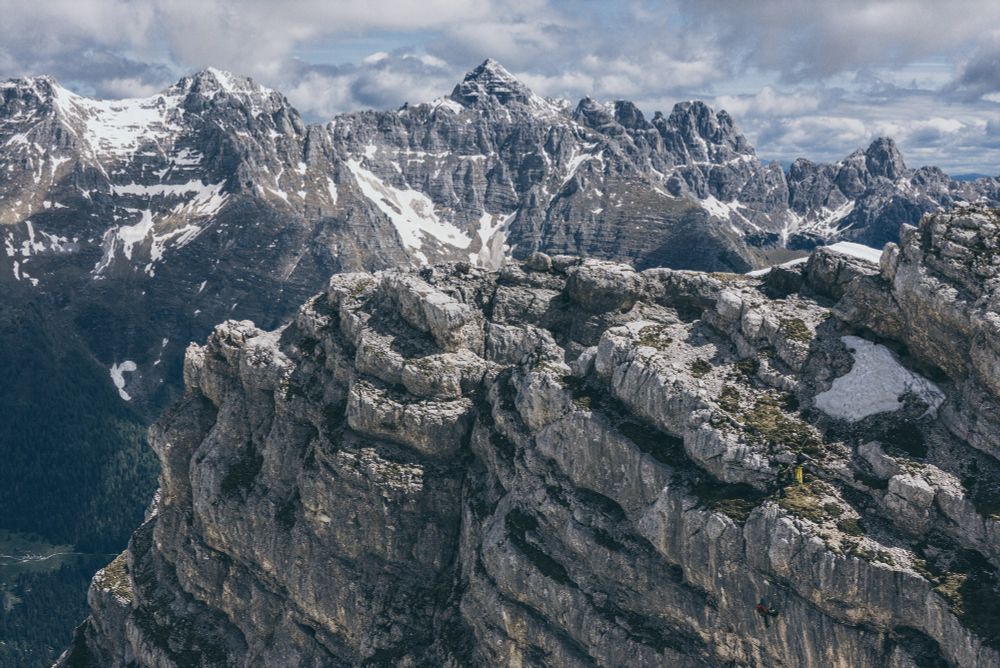
360 views of Canin-Kanin East Ice Patch in May 2025 and November 2024. Julian Alps.
360 from May 2025: kuula.co/share/hDl8k?...
360 from Nov 2024: kuula.co/share/hDYR4?...
Close up heli view of the former Klein Nesthorn ridge yesterday! 🚁😲
The summit ridge has lost more than 100 m in elevation and its north face ~130 m! 😱
All this mass ended up on the glacier, causing it to break up! 🌊
📷 D. Farinotti - @vaw-glaciology.bsky.social
Fieldwork on Canin-Kanin East snow ice patch and surrounding areas. Photos from May 30th, 2025
#julianalps #kanin #massbalance
Already + 100,000 m3 fallen from the Klein Nesthorn N face at ~3200 m asl, and something between 1 to 5 Millions m3 more are 'forecasted'... 😱
That's quite a thing!
Blatten village evacuated 😭
The 'Crumblocene' is definitely a nice time to live! 🏔️🌊
www.20min.ch/fr/story/can...
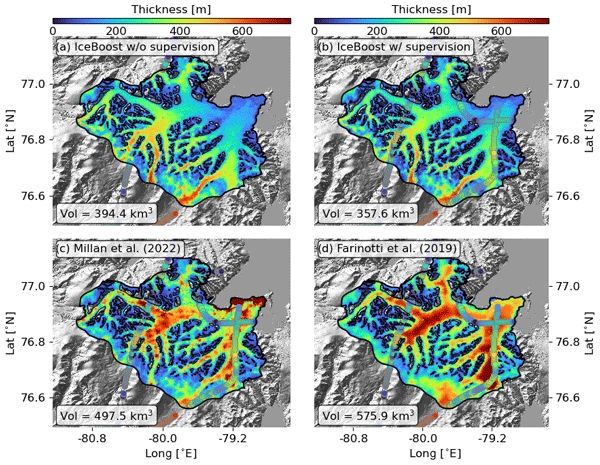
Glacier ice thickness maps produced globally with a machine learning system.
@ucirvine.bsky.social @unive Ca' Foscari
gmd.copernicus.org/articles/18/...
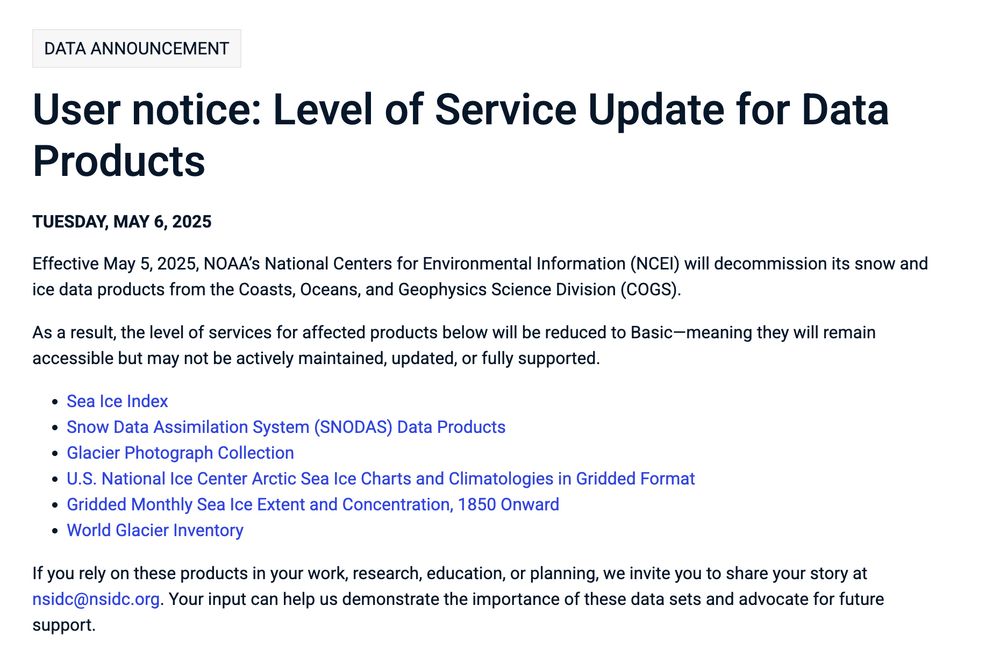
Effective May 5, 2025, NOAA’s National Centers for Environmental Information (NCEI) will decommission its snow and ice data products from the Coasts, Oceans, and Geophysics Science Division (COGS). As a result, the level of services for affected products below will be reduced to Basic—meaning they will remain accessible but may not be actively maintained, updated, or fully supported. This includes Sea Ice Index, Snow Data Assimilation System (SNODAS) Data Products, Glacier Photograph Collection, U.S. National Ice Center Arctic Sea Ice Charts and Climatologies in Gridded Format Gridded Monthly Sea Ice Extent and Concentration, 1850 Onward World Glacier Inventory. If you rely on these products in your work, research, education, or planning, we invite you to share your story at nsidc@nsidc.org. Your input can help us demonstrate the importance of these data sets and advocate for future support.
This is horrible. I don't even know what to say. Some of our most key polar data.
"As a result, the level of services for affected products below will be reduced to Basic—meaning they will remain accessible but may not be actively maintained, updated, or fully supported."
nsidc.org/data/user-re...
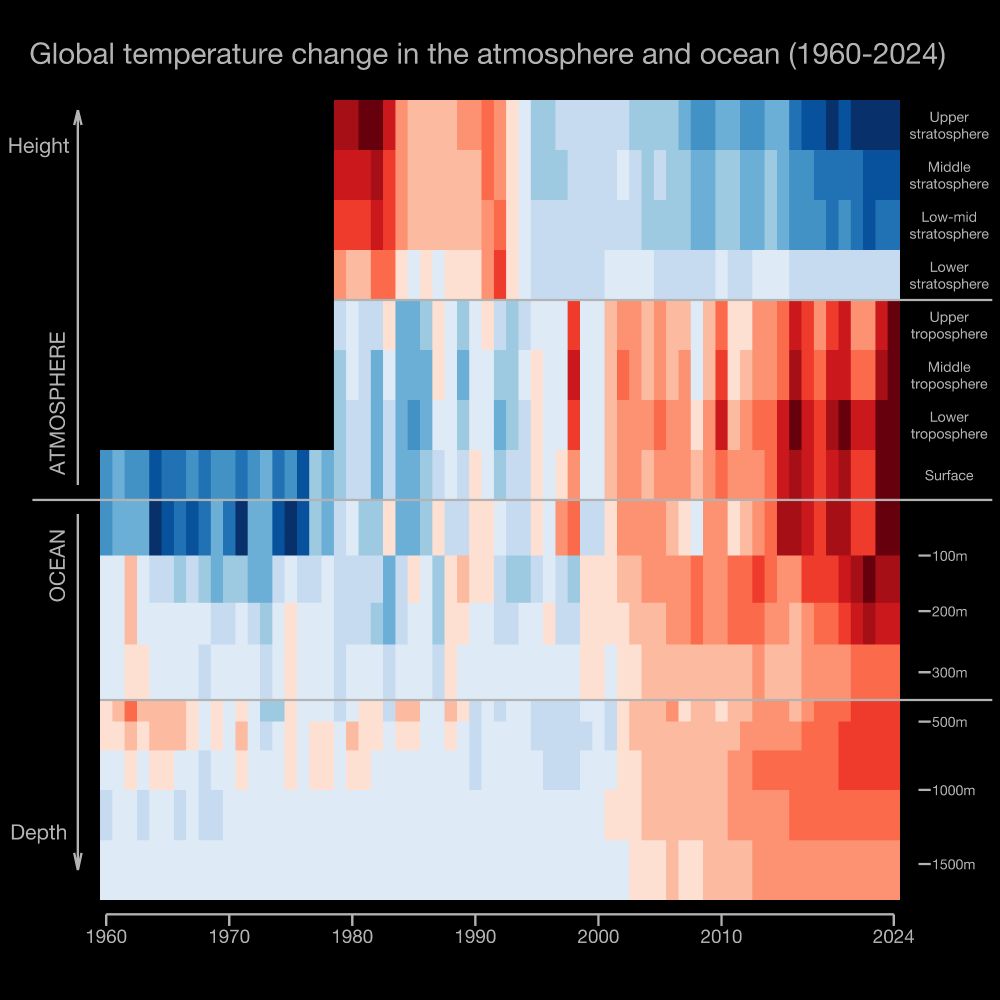
Warming stripes for deep ocean to upper stratosphere
The Warming Stripes have now been extended downwards into the ocean and upwards into the stratosphere!
Collaborative paper which tells the story of how the stripes were developed, and discusses their extension across the Earth system, is now available in BAMS: journals.ametsoc.org/view/journal...
It's so sad to see that this incredible dataset, which has redefined how we approach many Arctic-related studies, may not be updated in the future 😞
28.04.2025 20:40 — 👍 2 🔁 3 💬 0 📌 0
I finally tried Gaussian Splatting using some handheld photos taken inside an ice cave. In just 10 minutes of training-rendering, the results were stunning, impressive! 😁 For now only for visual purposes...
#gaussiansplatting #icecave #digitaltwin
Sad news (but great work) from the Austrian Alps
tc.copernicus.org/articles/19/...
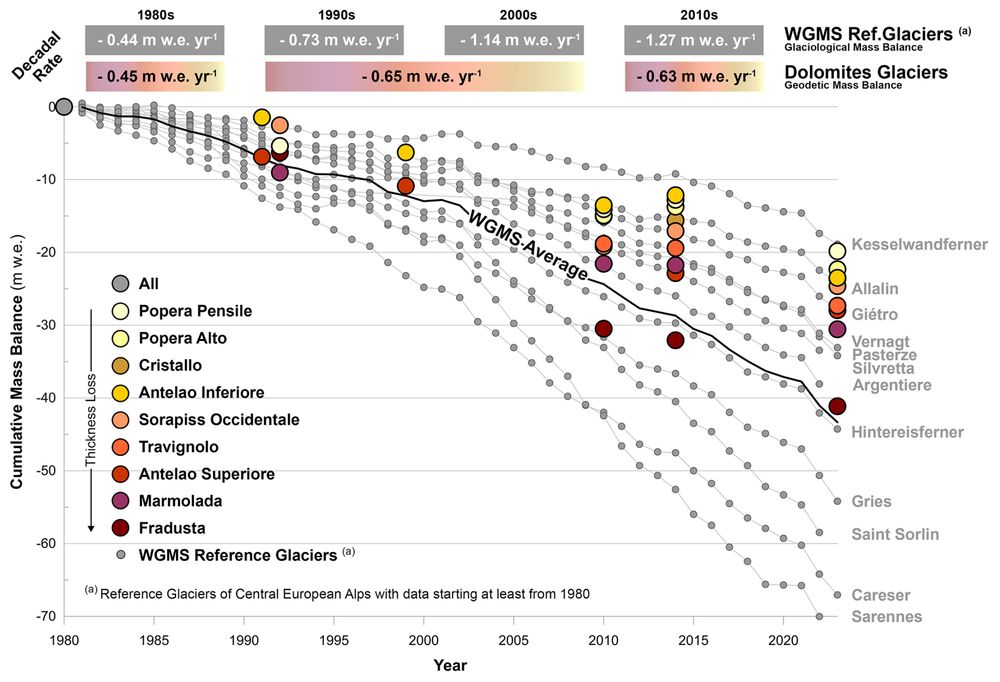
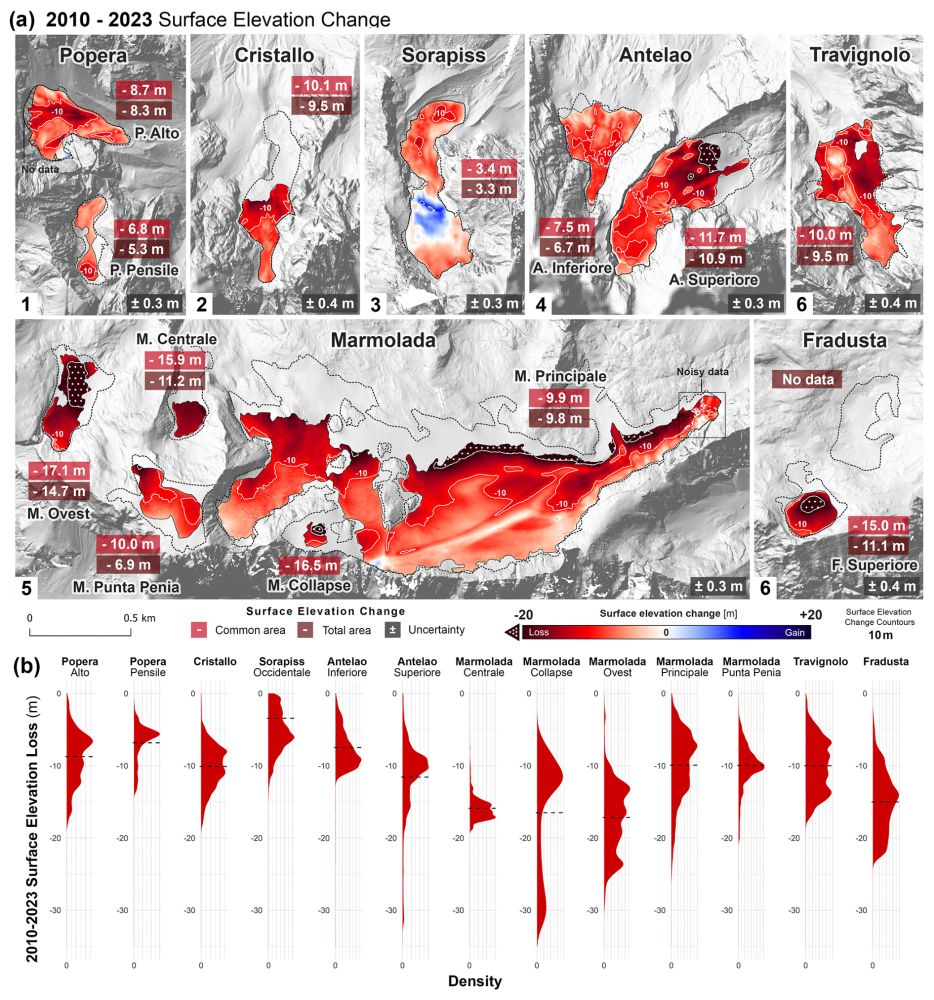
Check out our latest work from the Dolomites. We tried to estimate the mass balance of the remaining Dolomites glaciers since the 1980s using LiDAR, SfM and historical imagery. No surprise: huge mass loss, shrinking area, and increasing debris cover.
Paper: tc.copernicus.org/articles/19/...
Pisgana West (Adamello, IT)
1990 | 2021
Remember the 1990s? ⌚️❄️
Seems so far away from a glaciological point of view! 😱
And the most recent pic here was taken before the recent record-breaking heatwaves which wiped out 10% of Alpine ice in just 2 years! 🔥
📷 Servizio Glaciologico Lombardo
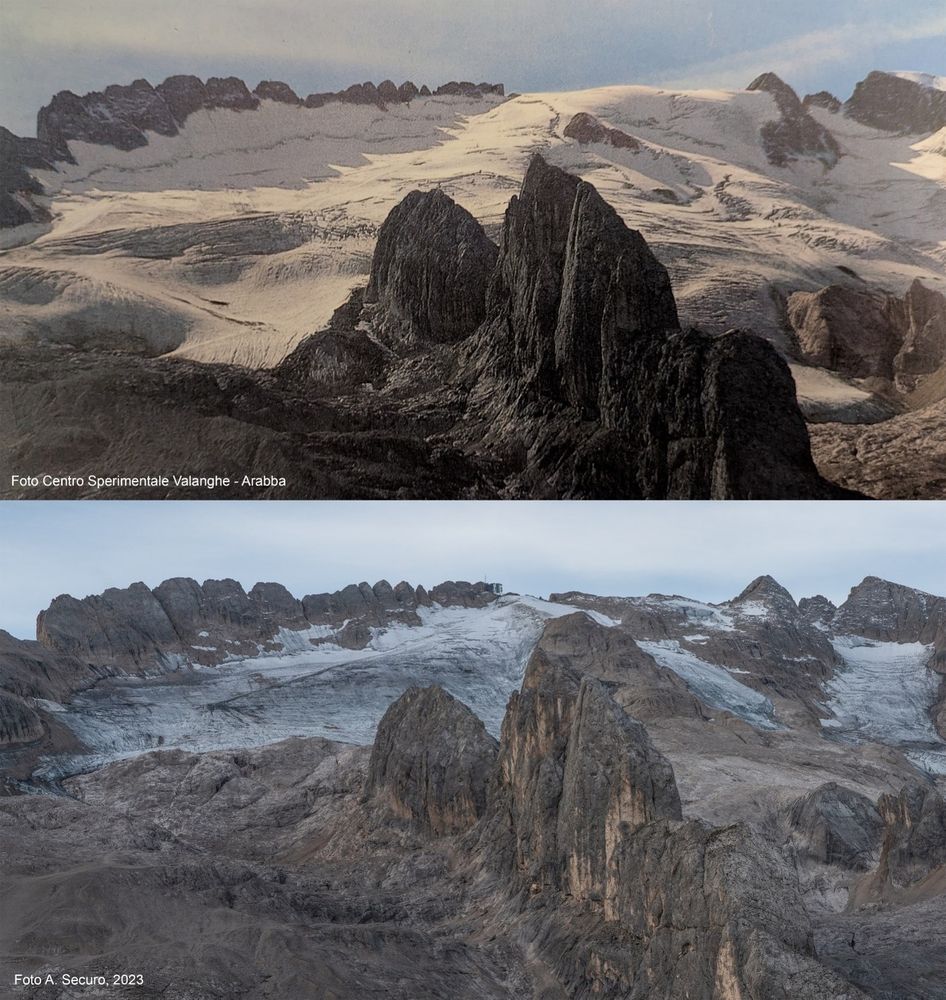
Marmolada Principale Glacier in 1980s and 2023, Italian #Dolomites
1980s photo from G. Zanon - I ghiacciai del Veneto


