
Thanks for putting me in the spotlight @climateainordics.com !
15.01.2026 14:13 — 👍 1 🔁 0 💬 0 📌 0Thanks for putting me in the spotlight @climateainordics.com !
15.01.2026 14:13 — 👍 1 🔁 0 💬 0 📌 0
And to complete the thread: A big shout out to Allan Stokes who finished the work that Simen Pedersen and I started before he got on board, and of course all other co-authors in the fantastic #Scandcam team!
15.08.2025 13:25 — 👍 0 🔁 0 💬 0 📌 0
Concluding, Norwegian mountain hares are experiencing a mismatch in their camouflage as a consequence of rapid snow cover declines. Future studies will have to show how this impacts survival and population dynamics.
Check out the full text @globalchangebio.bsky.social
doi.org/10.1111/gcb....

We also looked at the timing of the moult (2011-2018) relative to when the snow arrived or disappeared during two periods (1959-1966 and 2011-2018). It turned out that hares were mostly too late during autumn, and that they were better adapted to historic snow cover than to contemporary snow cover.
15.08.2025 13:25 — 👍 0 🔁 0 💬 1 📌 0
Scatterplot showing the relationship between the reduction in annual snow days (x-axis) and annual mismatch (number of days) (y-axis). The relationship is positive, so hares are more mismatched in locations where the reduction in snow is largest.
Maybe not surprisingly, the total number of days during which hares were mismatched compared to their surroundings (i.e. not camouflaged) was higher in places where the annual number of days with snow cover decreased the fastest. So mountain hares cannot keep up with the fast disappearance of snow.
15.08.2025 13:25 — 👍 0 🔁 0 💬 1 📌 0
Camera-trap image showing a moulting mountain hare (white hare with some brown dots in its fur) in a green boreal forest landscape where the snow already disappeared.
We modelled mountain hare phenology to determine the coat colour (brown, white or moulting) for each location during each day of the year and linked this to high resolution data on snow cover to count the number of days during which mountain hares were a different colour than their surroundings.
15.08.2025 13:25 — 👍 0 🔁 0 💬 1 📌 0
Map of Norway with almost 700 black dots showing the locations of camera traps. In the background, the map shows a digital elevation map. Camera traps were spread throughout Norway, from the far south to about 69 degrees north.
This study was possible thanks to the #Scandcam project and used camera-trap data on mountain hares and their coat colour from almost 700 locations throughout Norway over a timespan of 8 years. Many students helped classify the mountain hare images into three categories: brown, white, and moulting.
15.08.2025 13:25 — 👍 0 🔁 0 💬 1 📌 0
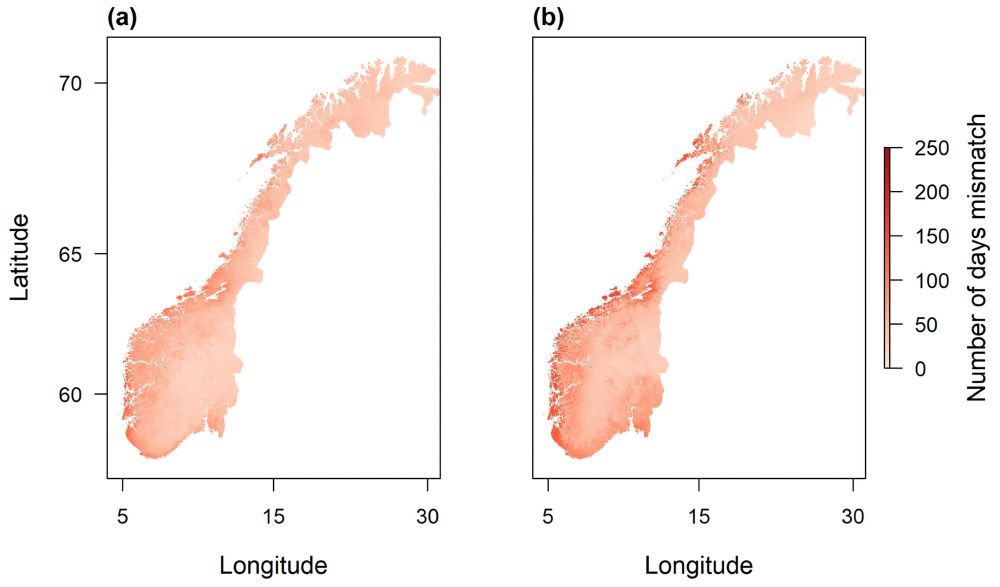
Graphical abstract of the manuscript. In the top-left, it shows a map of Norway with lots of black dots representing camera-trap locations. In the top-right, it shows a camera-trap image of a white mountain hare in a snowfree landscape. These represent 8 years of camera-trap data from 2011-2018. In the bottom-left, it shows a scatterplot showing an increase in camouflage mismatch with an increase in the reduction of days with snow cover between two periods (1959-1988 and 1989-2018). In the bottow-right, it shows two maps of Norway, showing the number of days during which mountain hare moult timing was mismatched with the start and end of winter. On the left, the relationship with snow in the period 1959-1966, and on the right the relationship with the period 2011-2018. It shows that the moulting phenology of mountain hares during 2011-2018 was better matched with the snow conditions during the 1960s than the snow conditions during the 2010s, suggesting that mountain hares have adapted to previous snow conditions and are not able to keep up with the speed at which snow conditions are changing today.
I'm not so good at regularly posting here, but here is something worth sharing!
Using 8 years of camera-trapping data and 60 years of snow-cover data, we show that camouflage mismatch in mountain hares is largest where snow disappeared the fastest.
A thread
onlinelibrary.wiley.com/doi/full/10....
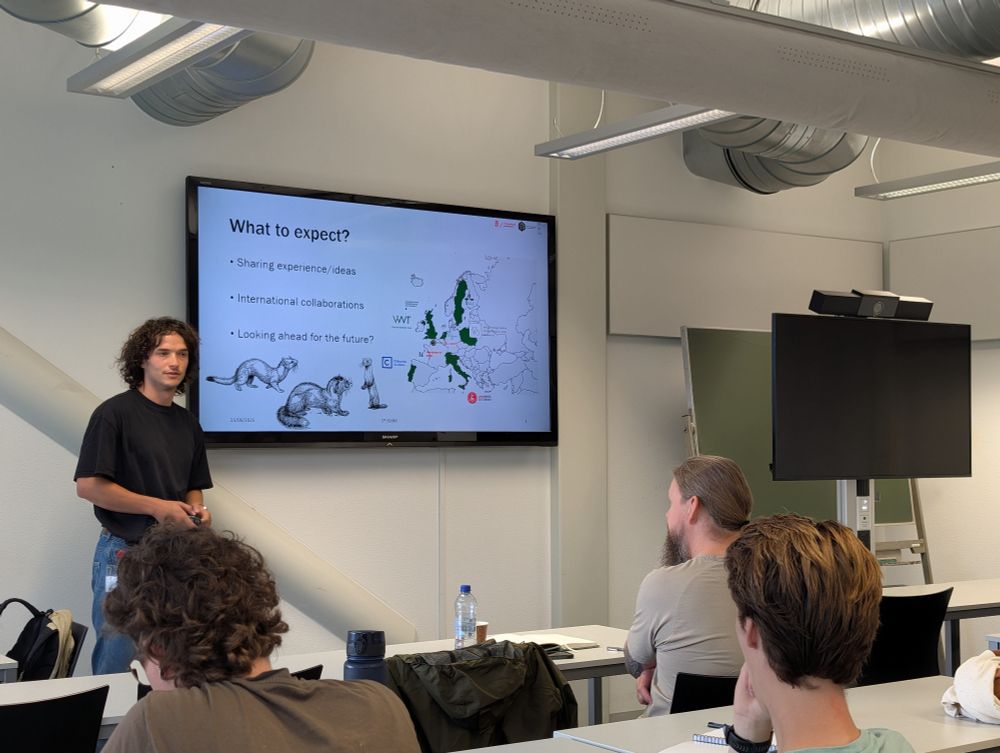
Start of the first International Small Mustelid Meeting - where we invited weasel researchers from across Europe to share knowledge and explore potential for collaboration. #smallmustelid #weasel
25.06.2025 07:37 — 👍 4 🔁 0 💬 0 📌 0Looking forward to the challenge of presenting 8 years of #Scandcam in five minutes! It really makes you think about what the main take away of the project is and might result in some teasers for further discussion afterwards. Who else will present at #IWC2025?
12.05.2025 12:51 — 👍 3 🔁 0 💬 0 📌 0
Graphical summary of 10 quick tips to get started with Bayesian statistics and how they fit into a larger view of an analytical workflow with Bayesian models.
🚨🎉 New paper "Ten quick tips to get you started with Bayesian statistics", hope you'll like it 😇🤗
✍🏽 w/ Andy Royle, Marc Kéry and Chloé Nater
🔗 dx.plos.org/10.1371/jour...
@plos.org @cnrsecologie.bsky.social @cnrsoccitanieest.bsky.social @umontpellier.bsky.social

a figure from the paper, with panels labelled "framework", "replication", "spatial extent", and "temporal extent". The third shows a strong partial bias towards Europe, the NE US, and SE Australia. The fourth shows a strong bias to post-2020 and terrestrial
Worldwide Soundscapes: A Synthesis of Passive Acoustic Monitoring Across Realms
onlinelibrary.wiley.com/doi/full/10....

We're working on a common standard for Passive Acoustic Monitoring (PAM) data! 📡🎙️ Hopefully this will boost data sharing, FAIR access & large-scale studies. 🧪 Read about our proposed standard & join our May webinar via @wildlabs.bsky.social
More: wildlabs.net/discussion/s...

We are offering a Masters level course in conservation genetics for the first this autumn in Umeå. Registration is currently open. Please feel free to share with anyone who may be interested.
24.03.2025 09:07 — 👍 3 🔁 2 💬 0 📌 0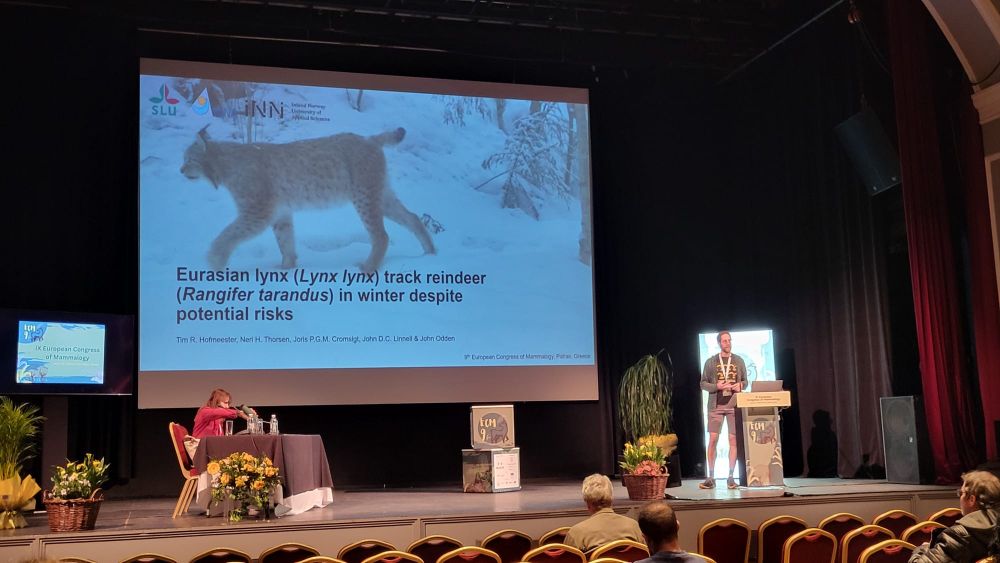
Presenting in the last session on the last day of a conference is always a struggle but happy with the audience I had. #ecm9 Showing #SCANDCAM data on the spatiotemporal overlap between lynx and reindeer. Also representing #Big_Picture announcing more international collaboration studies to come.
04.04.2025 15:12 — 👍 10 🔁 1 💬 0 📌 1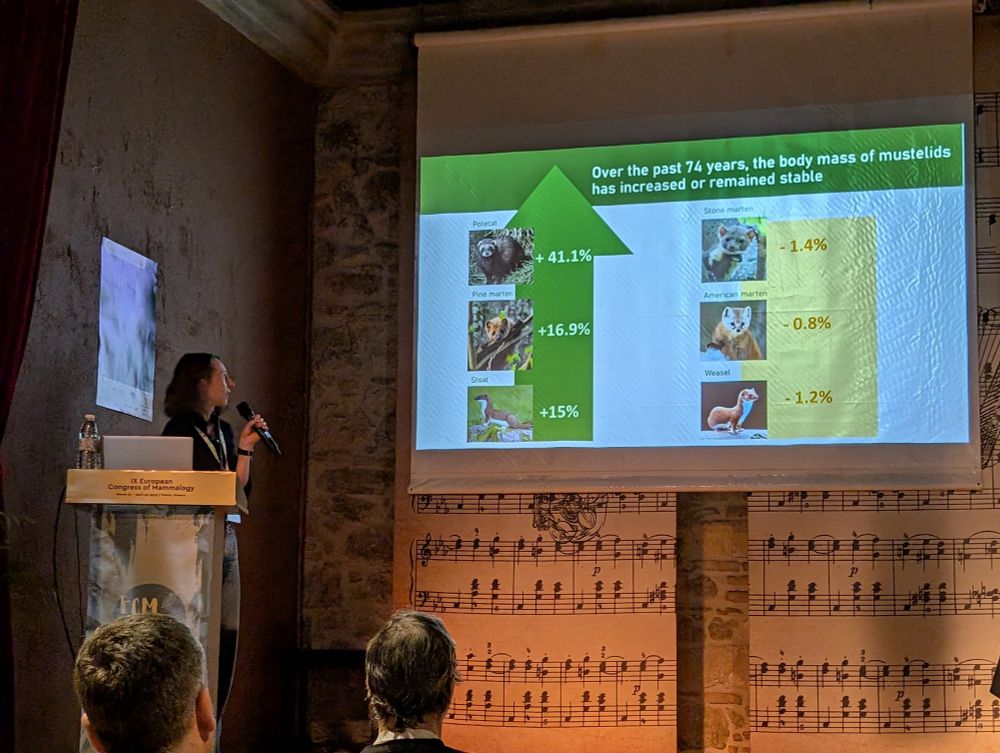
The initial results suggest that European polecat has increased in body mass the most, followed by pine marten and stoat. While several other species have remained relatively stable in mass. Next steps are to try to tease apart what the potential drivers are. #ecm9
03.04.2025 10:05 — 👍 2 🔁 1 💬 0 📌 0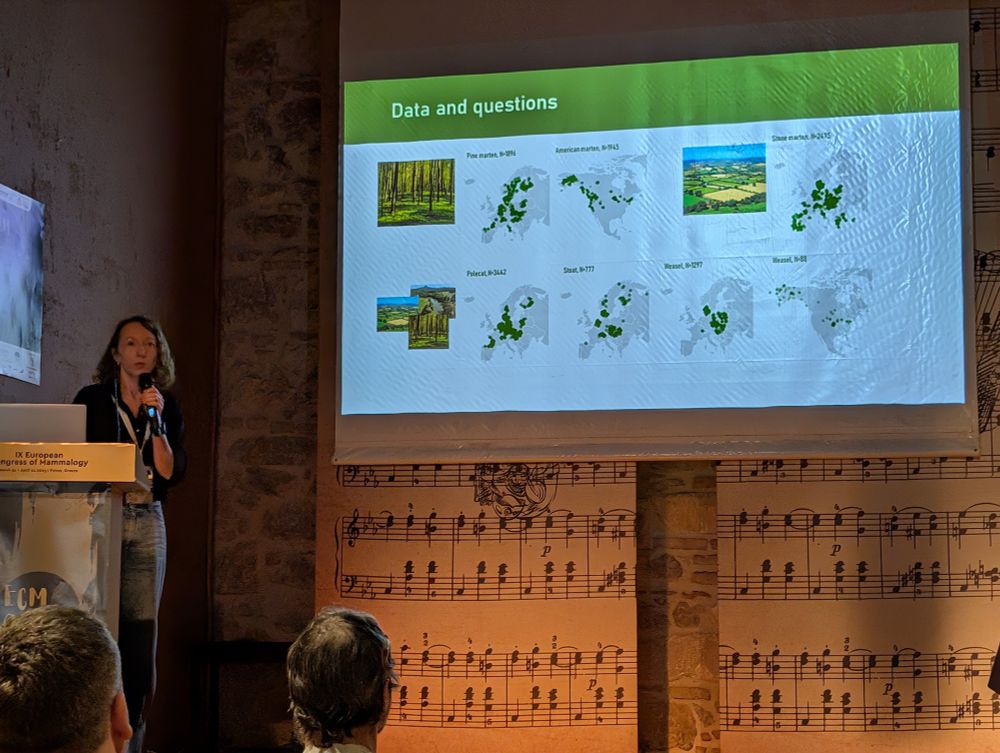
Anna Wereszczuk presenting the first results from an enormous effort trying to compile a dataset of bodymass in Mustelids from Europe and North America #ecm9 Please contact us if you have data you would like to contribute!
03.04.2025 10:05 — 👍 5 🔁 0 💬 1 📌 0Excellent free book by the world’s expert on spatially explicit capture-recapture (with lots of examples in R)
01.04.2025 06:22 — 👍 18 🔁 11 💬 0 📌 0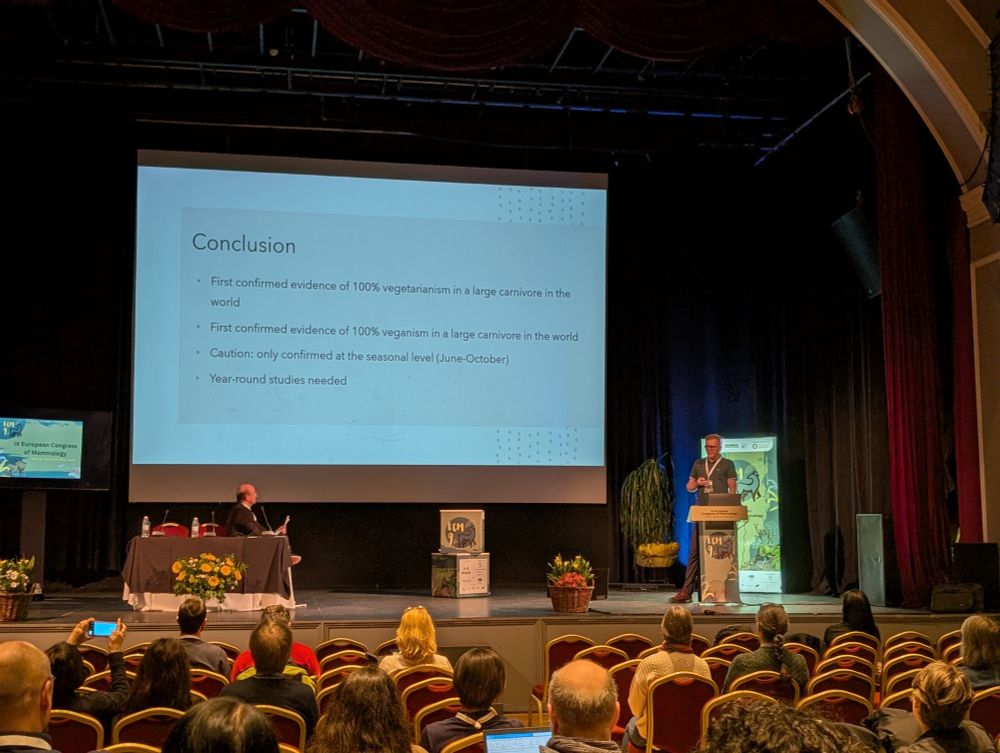
First confirmed documentation of a fully vegan large carnivore.
Enjoying April Fools Day at #ecm9 by Laurent Schley.
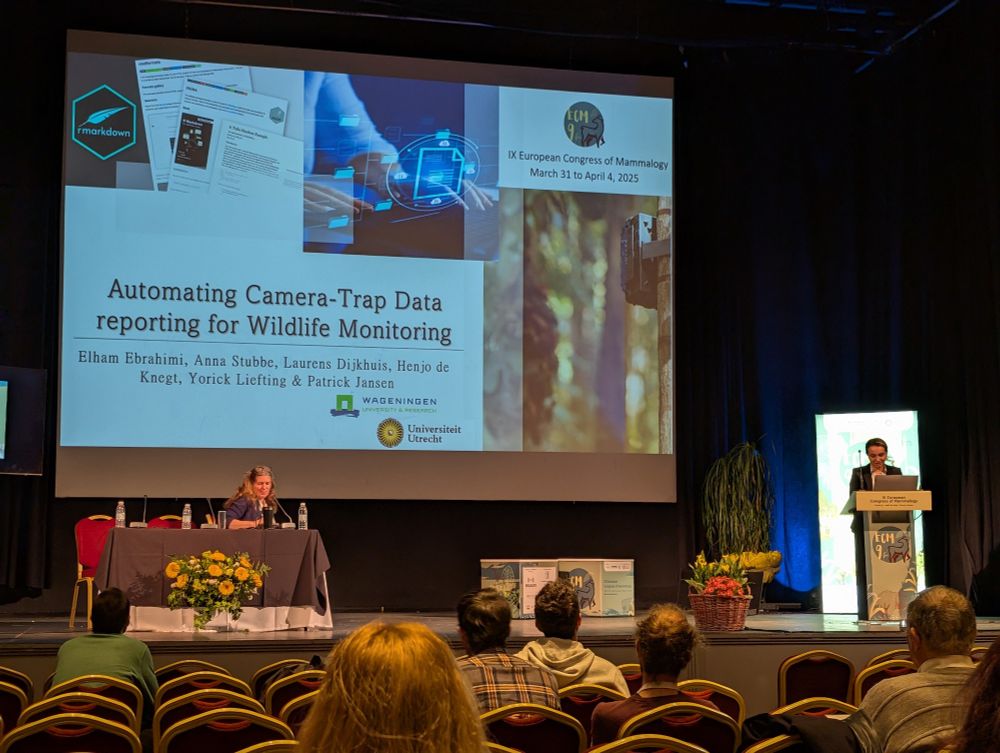
@elhamebrahimi.bsky.social presenting really important and cool work on a new R package to automate reporting of camera trap data at #ecm9 Work that is done as part of our Biodiversa+ project #Big_Picture
31.03.2025 15:08 — 👍 22 🔁 6 💬 1 📌 1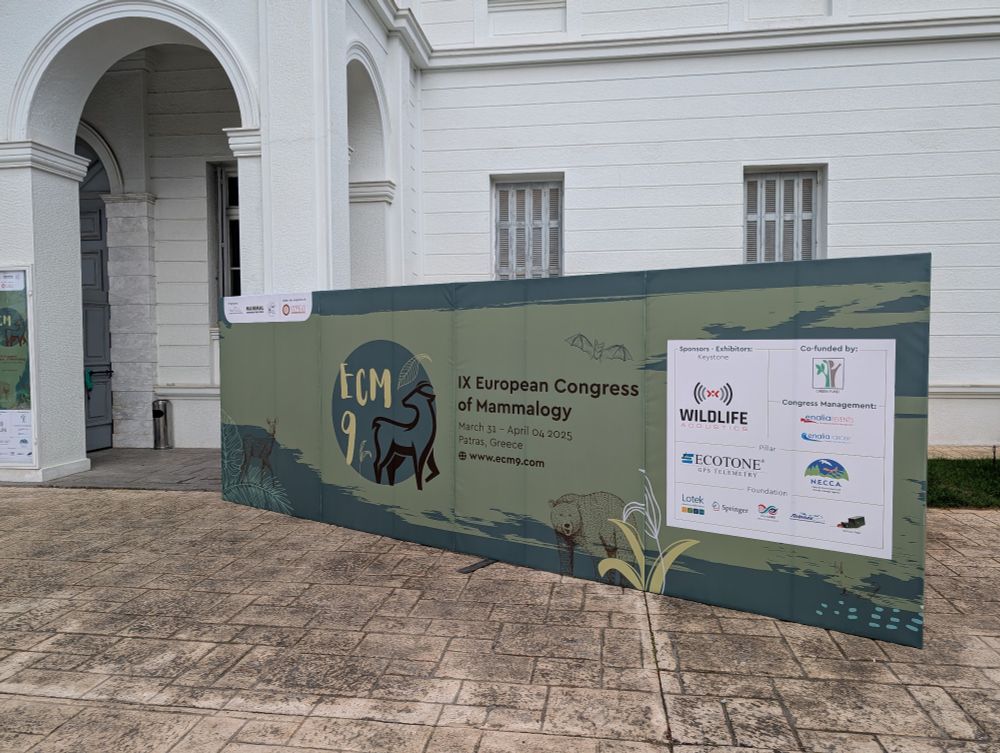
Just checked in for the #ecm9 European Congress of Mammalogy in Patras Greece. Looking forward to five days of mammal talks!
30.03.2025 15:44 — 👍 7 🔁 0 💬 1 📌 0
Northern-hawl owl sitting in a dead tree looking into the camera
I finally made it to bluesky. Looking forward to catching up with old acquaintances and discovering new researchers in the fields of wildlife biology and conservation technology.
Image of a northern hawk owl I ran into during a morning jog at the beginning of the week for getting people's attention