The data vis project "Mosaic: An Architecture for Linking Databases and Scalable Interactive Visualizations" received a SIGMOD Best Demo Runner Up award at the ACM SIGMOD/PODS International Conference on Management of Data in Berlin, Germany.
Congrats to the Mosaic team on this recognition! 📊🎉
23.07.2025 14:04 — 👍 27 🔁 5 💬 1 📌 0
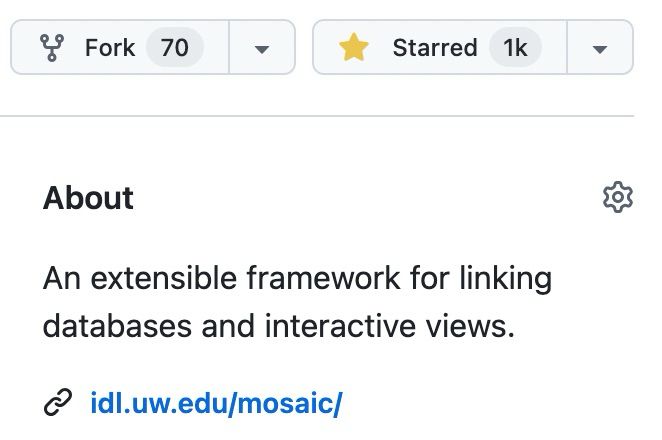
Screenshot from GitHub showing 1k stars for the Mosaic project, an extensible framework for linking database and interactive views.
The Mosaic architecture for database-backed interactive visualization just hit 1,000 stars on GitHub! Thank you to all who have participated and contributed!
29.04.2025 18:04 — 👍 31 🔁 2 💬 0 📌 2
Congrats Kaitlyn!!
24.04.2025 04:02 — 👍 2 🔁 0 💬 0 📌 0
🙏
24.03.2025 23:13 — 👍 2 🔁 0 💬 0 📌 0
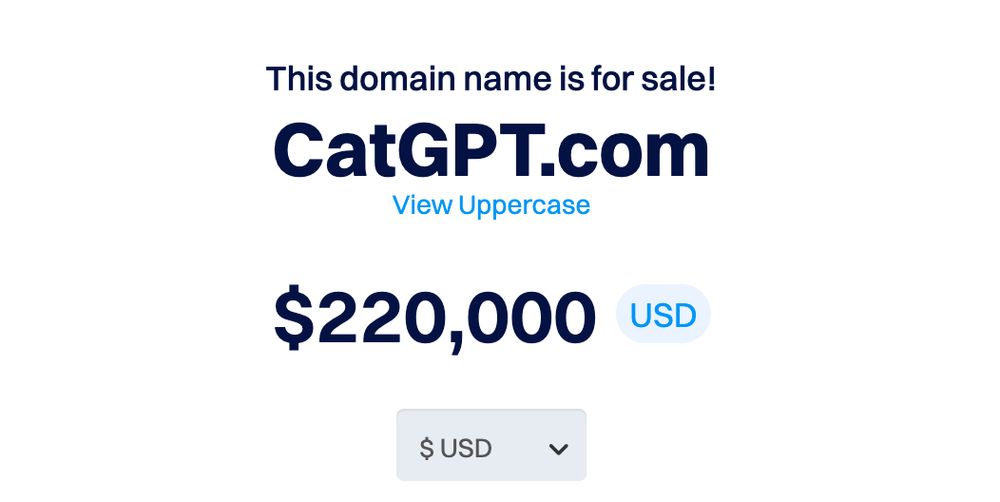
A webpage that reads "This domain is for sale! CatGPT.com. $220,000 USD."
TFW you have a grand idea only to find it's out of reach. So it goes for my chatbot that meows and purrs.
27.02.2025 04:56 — 👍 7 🔁 0 💬 1 📌 0
And congrats to you, too!
23.01.2025 05:03 — 👍 4 🔁 0 💬 0 📌 0
An invitation into Droste's Lair
A swords-and-sorcery programming environment for building and counting mathematical structures
@joshuahhh.com and I invite you to explore our experimental visual programming environment (which takes place in a dungeon)
Features
- dissolve the bounds of decision and explore all possibilities at once
- use sigillic incantations, delve into recursive caverns
vezwork.github.io/drostes-lair-post
16.12.2024 15:36 — 👍 59 🔁 22 💬 0 📌 2
Us #ieeevis 2025 OPCs worked hard on this: the new call for papers is now live! ieeevis.org/year/2025/ye...
Submit your best work!
Brief account of changes for 2025:
* Extra week for supplemental material
* Student reviewer program
* Opt-in publication of reviews for accepted papers
13.12.2024 19:14 — 👍 8 🔁 7 💬 2 📌 0
CSE512: Data Visualization
Hi, I’m a main author of the Vega/Altair curriculum notebooks. Indeed these focus on tool learning and aren’t intended as a standalone text for a full vis course. We combine it with many other papers, links, and lectures, as in courses.cs.washington.edu/courses/cse5...
08.12.2024 18:37 — 👍 5 🔁 0 💬 0 📌 0

Kasper Hornbæk on LinkedIn: Dear HCI community (please share, forward)
We are seeking two Outreach…
Dear HCI community (please share, forward)
We are seeking two Outreach Editors for ACM Transactions on Computer-Human Interaction (TOCHI). The Outreach Editor…
ACM Transactions on Computer-Human Interaction is looking for outreach editors, i.e., junior researchers who wants to rethink and implement how the journal engages online with readers and authors. Deadline for applications is Dec 11. Call at www.linkedin.com/feed/update/... or ask me for more info.
28.11.2024 06:11 — 👍 19 🔁 19 💬 0 📌 0
FWIW it took UW IT about a month to complete our subdomain request, but once set up you can administer it yourself.
27.11.2024 23:01 — 👍 1 🔁 0 💬 0 📌 0
Updating DNS records for a top-level UW managed subdomain was painless, too. (We did it for @idl.uw.edu.) You just need to add an `_atproto` sub-subdomain, then add the TXT record to that.
27.11.2024 17:12 — 👍 2 🔁 0 💬 2 📌 0
Nice! I loved that work and always thought it would be good to do more like that 🤗
26.11.2024 22:50 — 👍 1 🔁 0 💬 0 📌 0
Congrats Sanjay!
26.11.2024 22:30 — 👍 1 🔁 0 💬 1 📌 0
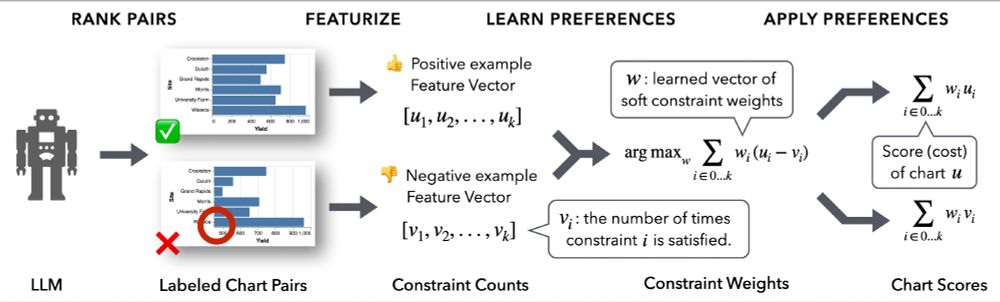
Overview of the DracoGPT-Rank pipeline. (1) User provides prompt templates for an LLM to rank chart pairs; (2) Draco featurizes charts and produces feature vectors consisting of constraint counts; (3) Draco learns constraint weights over LLM-labeled chart pairs by fitting a RankSVM model; (4) The fitted Draco model can be applied to score charts. Results at each stage of the pipeline afford insight into LLM ranking preferences.
People are now using LLMs to create charts and graphs. How might we assess the quality and consistency of the results? DracoGPT is a method that fits a visualization knowledge base (Draco) to LLM responses, enabling comparison across models, prompts, and results from human subjects experiments.
26.11.2024 19:12 — 👍 17 🔁 2 💬 1 📌 1
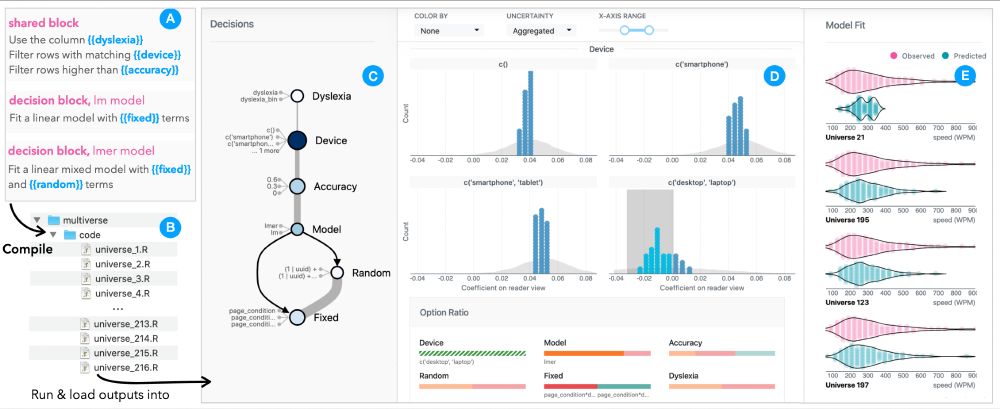
Authoring and visualizing multiverse analyses with Boba. Users start by annotating a script with analytic decisions (a), from which Boba synthesizes a multiplex of possible analysis variants (b). To interpret the results from all analyses, users start with a graph of analytic decisions (c), where sensitive decisions are highlighted in darker blues. Clicking a decision node allows users to compare point estimates (d, blue dots) and uncertainty distributions (d, gray area) between different alternatives. Users may further drill down to assess the fit quality of individual models (e) by comparing observed data (pink) with model predictions (teal).
Love this work! Also related is the Boba project, led by Yang Liu and @kalealex.bsky.social, which includes a variety of multiverse visualization and assessment methods. idl.uw.edu/papers/boba
26.11.2024 18:23 — 👍 11 🔁 1 💬 0 📌 0
1️⃣0️⃣0️⃣0️⃣ 🙏 📈
25.11.2024 23:03 — 👍 2 🔁 0 💬 0 📌 0
We could precompute the projection and the visualization would load a lot faster, but I wanted to keep all the spatial processing details in the example so folks can see how it’s done. Internally we’re working on a publishing tool that will optimize load times and precompute preaggregations, too!
25.11.2024 22:51 — 👍 8 🔁 0 💬 0 📌 0
Our research lab is now here on Bluesky! 📊📈
25.11.2024 17:38 — 👍 37 🔁 4 💬 2 📌 0
Mosaic serves as an architectural layer that provides (1) access to a backing database and a variety of query optimizations, and (2) a shared selection abstraction that enables integrated filtering across data views (visualizations, tables, input widgets, etc.).
25.11.2024 17:28 — 👍 1 🔁 0 💬 0 📌 0
What is Mosaic? | Mosaic
Scalable, interactive data visualization
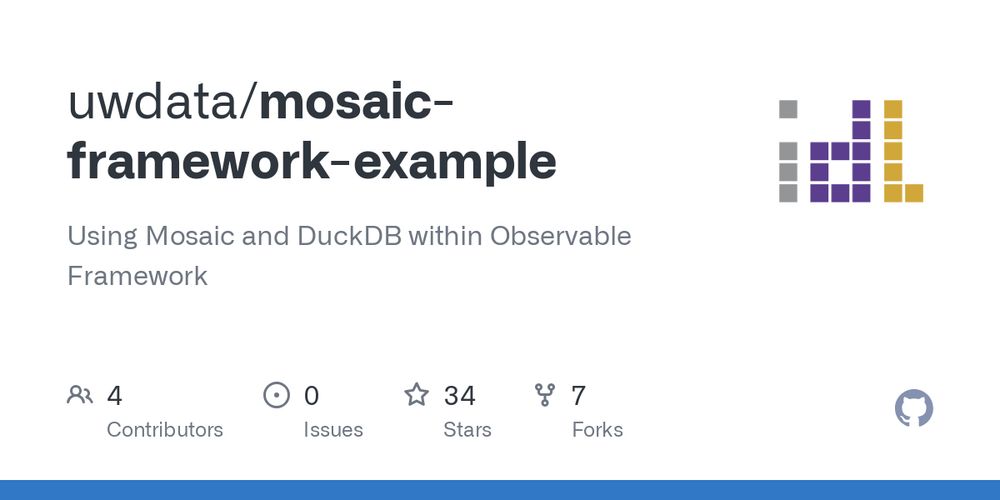
Also, FWIW the Mosaic site is built using VitePress, not Observable Framework. For more explanation of Mosaic, start here: idl.uw.edu/mosaic/what-...
25.11.2024 17:24 — 👍 3 🔁 0 💬 1 📌 0
Mosaic is a framework for linking interactive views and backing databases. Examples include input widgets and vgplot, an interactive grammar of graphics built on Observable Plot, but you can also build and integrate custom components. The Mosaic core handles database querying and linked selections.
25.11.2024 17:24 — 👍 2 🔁 0 💬 1 📌 0
Haha been there done that… Neutraface was the official Stanford HCI font while I was on the Farm. The UW move was my opportunity to jump ship to Avenir
24.11.2024 02:56 — 👍 3 🔁 0 💬 1 📌 0
Incidentally it’s also been the official UW Interactive Data Lab typeface since 2013. (FWIW I’ve always had a soft spot for Futura but it’s a bit… much. Avenir plays it cooler 😎)
24.11.2024 02:32 — 👍 3 🔁 0 💬 2 📌 0
(And in case it’s interesting to you: underneath the hood Mosaic automatically pre-aggregates sufficient statistics, binned at the pixel level, to compute updated regressions on the fly without having to touch the original, large dataset.)
21.11.2024 20:14 — 👍 6 🔁 0 💬 0 📌 0
#FunctionalAestheticsTheBook coauthor. Maker of vizzes, breaker of calcs, Tableau-old (HOF). @windscogley other places.
she/her
gp at spark capital ✨ databases, infra, dev tools
Pictures, facts, memories and emotions from an irrepressible, sweeping, wild, exciting time of the 70s and 80s.
http://allmylinks.com/nokon1501
Assistant professor at Georgia State University, formerly at BYU. 6 kids. Study NGOs, human rights, #PublicPolicy, #Nonprofits, #Dataviz, #CausalInference.
#rstats forever.
andrewheiss.com
Signal: andrewheiss.01
information science professor (tech ethics + internet stuff)
kind of a content creator (elsewhere also @professorcasey)
though not influencing anyone to do anything except maybe learn things
she/her
more: casey.prof
Data Vis and Semantic Layer development at Hex. Creator of VegaFusion, acquired by Hex. @vega_vis Altair co-maintainer. Former Chief Scientist at @plotlygraphs
Associate Professor of Computer Science @University of Massachusetts Amherst | Co-Director of the HCI-VIS Lab. Former Harvard Radcliffe Fellow | Currently on sabbatical @Inria Saclay
Head of Tableau Research, Wiley book co-author - Functional Aesthetics for Data Visualization. Research interests in NLP, visual analytics (and coffee). Opinions are my own.
Engaging people with science to foster curiosity and empower decision making
Program Officer, Gordon and Betty Moore Foundation
Adjunct Professor of Biochemistry, UCSF
Posts are my own
Visualization & HCI at the University of Victoria
Associate Professor at the UW iSchool, Co-Founder UW Center for an Informed Public | PhD in Sociology from UC Irvine | Research: social networks, sociology, information integrity & computational social science.
Associate Professor at UW. I work on learning theory, (very) broadly defined. MIT Ph.D '18. More importantly, I once hit challenger in TFT 😎
Incoming Assistant Professor at Cornell Information Science
Previously at Stanford NLP
https://cs.stanford.edu/~katezhou/
Retired Prof Computer Science, Univ of Maryland, Working on HCI, Info Visualization, and Human-Centered AI
Founder of https://infinidream.ai, Pioneering AI artist and Engineering Leader. Father of three teens in NYC.
https://Draves.AI 🏳️⚧️ 🇵🇸 🇺🇦 🇺🇸
Professor - Carnegie Mellon University - Human Computer Interaction
Ubiquitous Computing - Usable Privacy and Security - Responsible AI
Co-Founder - Wombat Security (acquired) - FuguUX