👥 Spain’s population pyramid
A quick look at Spain’s age & gender structure.
A narrowing base and heavier older cohorts highlight population aging — with more women at later ages.
Built with Grapper.
🔎 playground.grapper.io/editor/gdzku...
#DataViz #Demographics #PopulationPyramid #Grapp
16.02.2026 09:22 — 👍 3 🔁 1 💬 0 📌 0

🚆 Hourly train passengers in Barcelona
Train usage by hour: morning rush, midday dip, evening peak. Urban rail mobility visualized with Grapper.
🔗 playground.grapper.io/editor/g1z8z...
#DataViz #UrbanMobility #Grapper
09.02.2026 11:20 — 👍 0 🔁 0 💬 0 📌 0

📊 Europe’s energy mix (1990–2022)
From oil and coal dominance to the rise of renewables. A clear snapshot of Europe’s energy transition.
Built with Grapper 👇
playground.grapper.io/editor/g9qcn...
#DataViz #EnergyTransition
04.02.2026 08:28 — 👍 3 🔁 1 💬 0 📌 0

📊 Scotland’s giants, in perspective
This chart compares the 5 highest and 5 lowest Munros in Scotland, from Ben Nevis (1,344 m) to peaks just over 900 m, putting the country’s mountain scale into context.
Built with Grapper 👉 playground.grapper.io/editor/guf14...
28.01.2026 08:17 — 👍 1 🔁 0 💬 0 📌 0

🍕🇪🇸 Spain’s favorite pizzas:
Hawaiian → Margherita → Four Cheese → Carbonara → BBQ.
Classics endure, bold flavors rise.
📊 Data: playground.grapper.io/editor/gtksx...
#PizzaLovers #DataViz #Spain
19.01.2026 08:46 — 👍 1 🔁 0 💬 0 📌 0

📈♻️ Where does all our plastic end up?
1950–2017: 9.2B tons produced.
5B waste, 2.5B in use, 900M incinerated, only 600M recycled.
Most plastic never comes back.
👉 playground.grapper.io/editor/gmw2m...
#PlasticWaste #CircularEconomy #Sustainability #DataViz
16.01.2026 10:04 — 👍 5 🔁 1 💬 0 📌 0

🎄✨ Christmas can be visualized too.
This tree is made with data and designed using Grapper.
Because even at this time of year, stories are better told with charts.
Merry Christmas! 🎁📊
22.12.2025 11:57 — 👍 1 🔁 0 💬 0 📌 0

📊 Spain’s labor market by age (2024): participation peaks at 45–54, youth face higher unemployment, and activity drops sharply after 60. Education, entry barriers, and retirement help explain the gap.
🔗 playground.grapper.io/editor/gfzsw...
18.12.2025 08:59 — 👍 2 🔁 0 💬 0 📌 0

🌍 Data is global — your visuals should be too.
Formats, numbers, dates and text vary by region, and one mismatch can break your insight.
Grapper automatically adapts your charts to any locale, ensuring consistent, truly global visualizations.
#DataVisualization #GlobalInsights #Localization
09.12.2025 13:00 — 👍 1 🔁 0 💬 0 📌 0

🔷 When pictograms inspire code
ISOTYPE showed how repeating one symbol can reveal patterns. Grapper brings that idea to code: clear, minimal, unsaturated visualizations. 🔁
🔗 blog.grapper.io/from-isotype...
#DataViz #Grapper #ISOTYPE
04.12.2025 10:43 — 👍 3 🔁 1 💬 0 📌 0

🌍💭 Over the past 120 years, the world shifted from mostly autocracies to more democracies… and now autocracies are rising again (V-Dem 2025).
👉 See the chart in Grapper: playground.grapper.io/editor/g904p...
#Geopolitics #Democracy #Autocracy #DataViz
25.11.2025 15:30 — 👍 0 🔁 0 💬 0 📌 0

Simplifying SVG loops with Grapper
g-for loops over arrays/objects to create SVG elements, charts, shapes, text, without manual DOM updates.
- Reactive visuals
- Clean templates
- Works with arrays, objects, ranges
Great for dashboards & real-time charts.
🔗 blog.grapper.io/understandin...
#SVG
18.11.2025 10:42 — 👍 1 🔁 0 💬 0 📌 0

Did you know this data is shown on a single line of circles? 🔵
A minimal, powerful visualization of how people spend time on mobile — social networks at the top, calls & apps at the bottom.
See how it was made: playground.grapper.io/editor/gggov...
#DataVisualization
14.11.2025 10:54 — 👍 1 🔁 0 💬 0 📌 0

🌍 The highest adult obesity rates are mostly in the Pacific.
🇦🇸 American Samoa leads with 75.21% (WHO, 2022). Diet shifts and sedentary habits are key factors.
👉 See how this chart was made: playground.grapper.io/editor/gggov...
#HealthData #Obesity #DataViz #Grapper
04.11.2025 14:56 — 👍 3 🔁 1 💬 0 📌 0

🌡️ Radial Temperature
Chart showing how min (blue) and max (red) temps change through the year. The shaded area shows their average variation and seasonal contrast.
👉 Made with Grapper: playground.grapper.io/editor/gu5oy...
#DataViz #Climate #RadialChart #Grapper
31.10.2025 08:23 — 👍 3 🔁 1 💬 0 📌 0

🎯 Circle size in visualization matters more than it seems.
We perceive area, not radius — doubling the radius shows 4× the value.
Scale by area to stay accurate. 📊
👉 Learn more: blog.grapper.io/the-circle-s...
#DataViz #Graphane #DataDesign
22.10.2025 06:59 — 👍 1 🔁 0 💬 0 📌 0

🔴 1 in 5 Europeans at risk
21.4% of the EU population faces poverty or social exclusion.
Inequality persists — inclusion and social protection are essential for a fairer Europe.
📊 Made with Grapper → playground.grapper.io/editor/gimsz...
#DataViz #EU #Inequality #Grapper
16.10.2025 07:10 — 👍 3 🔁 1 💬 0 📌 0

🔹 Reactivity & data visualization made simple
With Grapper, the g-bind: directive updates your SVGs automatically when data changes — speeding dev, keeping code clean, and enabling dynamic, reactive visuals.
🔗 Read more: blog.grapper.io/understandin...
#DataViz #Frontend #SVG #Reactivity #Grapper
14.10.2025 07:38 — 👍 2 🔁 1 💬 0 📌 0

⚡ Speed is UX.
In real-time data viz, every ms counts.
Our SVG-based micro-framework achieves sub-ms reactivity — no virtual DOM, no extra renders.
Performance is design.
🔗 blog.grapper.io/speed-and-us...
#UX #DataViz #Grapper
09.10.2025 09:13 — 👍 3 🔁 1 💬 0 📌 0

🔎 Europe is divided about the future: 66% pessimistic vs 34% optimistic.
Ireland is the most optimistic (49%), while Italy and Greece reach 80% pessimism.
👉 What’s your outlook, optimistic or pessimistic?
#DataViz #EU #Grapper
02.10.2025 08:07 — 👍 3 🔁 1 💬 1 📌 0

📦 Does package size still matter?
Today, size isn’t everything, but it’s key for first loads, slow connections, or choosing simple, modular libraries.
⚡ What matters: speed, smoothness, and stability. That’s what Grapper delivers.
👉 Learn more on our blog: medium.com/graphane/doe...
30.09.2025 13:45 — 👍 2 🔁 0 💬 0 📌 0

Rethinking the Declarative Approach in Data Visualization
Data visualization has become indispensable for exploring, explaining, and communicating complex information. Behind every visualization is…
🔍 Rethinking Data Visualization
Instead of coding every step, what if you just described the outcome? 💡
Declarative tools like Grapper simplify changes, boost collaboration & unleash creativity. 🚀
👉 Full article: medium.com/graphane/ret...
#DataVisualization #DeclarativeProgramming #Grapper
23.09.2025 08:13 — 👍 1 🔁 0 💬 0 📌 0

Why Grapper
The Graphery team developed Grapper out of frustration with existing solutions for crafting creative data visualizations.
🚀 Meet Grapper: a lightweight, open-source micro-framework for data viz.
- SVG + directives
- No compilers
- Fast & reactive
From weekend prototype → now powering 100s of custom visualizations.
🔗 medium.com/graphane/why...
#DataViz #OpenSource #SVG
16.09.2025 10:21 — 👍 3 🔁 1 💬 0 📌 0

🏔️ Exploring Scotland’s Munros
For #TidyTuesday, I charted the 5 highest and 5 lowest Munros.
🥇 The tallest is Ben Nevis (1,345m), while some Munros barely cross the 3,000 ft mark.
Made with #Graphane:
playground.graphane.dev/editor/guf14...
#DataViz #Scotland #Mountains
19.08.2025 09:08 — 👍 17 🔁 3 💬 0 📌 0

Graphane is in #wearedevelopers event
10.07.2025 07:23 — 👍 1 🔁 0 💬 0 📌 0
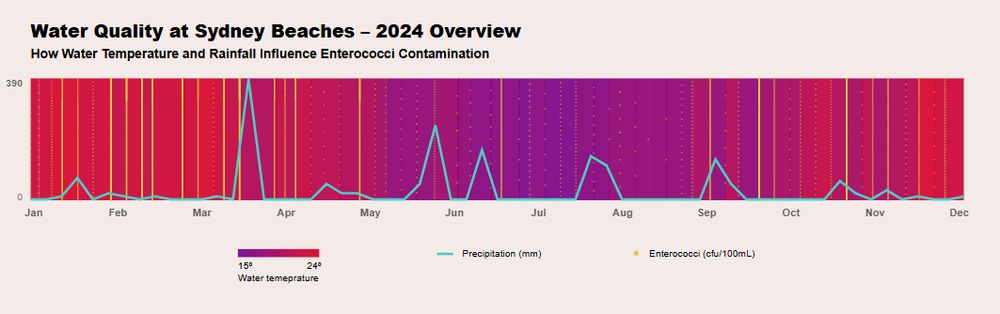
Water Quality at Sydney Beaches - 2024 Overview
🌊 Water Quality at Sydney Beaches
For this week’s #TidyTuesday, I explored how water temperature and rainfall influence enterococci contamination in 2024.
Visual made with #Graphane:
playground.graphane.dev/editor/gcatt...
#DataViz
20.05.2025 07:42 — 👍 5 🔁 1 💬 0 📌 0
🌋 Seismic Events at Mount Vesuvius
For this week’s #TidyTuesday, I visualized seismic depths from 2013–2024.
Each circle shows an event, with its size reflecting how far the shockwave could spread from the epicenter.
You can see this in #Graphane:
playground.graphane.dev/editor/gazn7...
#DataViz
13.05.2025 08:32 — 👍 11 🔁 2 💬 1 📌 0

The #30DayChartChallenge is interesting. Some of the charts we have made are mediocre, but others are quite interesting. We have tested the #graphane micro-framework with many forms of visualization and we are satisfied with the result.
playground.graphane.dev/gallery/@pal...
30.04.2025 06:06 — 👍 10 🔁 3 💬 0 📌 0

Discover the fascinating timeline of Methuselah, the world's oldest tree! 🌳 From the Great Pyramid to the Moon Landing.
Day 30 | Uncertainties - theme day: national geographic | #30DayChartChallenge
#DataVisualization made with #Graphane
playground.graphane.dev/editor/gr0vb...
30.04.2025 05:49 — 👍 3 🔁 2 💬 0 📌 0
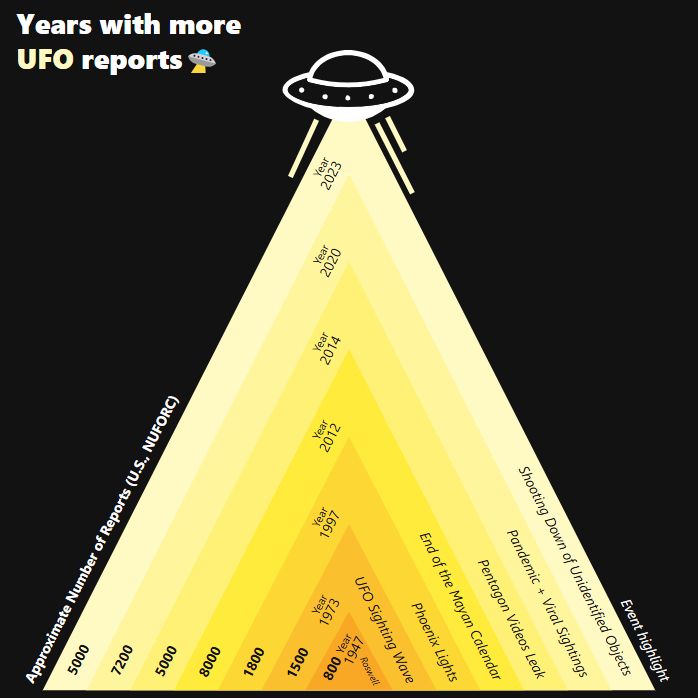
Years whit more UFO reports
Day 29 of the #30DayChartChallenge! 👽
Today's theme: Extraterrestrial 🛸
A timeline of Earth’s most UFO-obsessed years, based on real sighting reports.
Turns out the skies get busier when the world gets weirder.
#DataViz #Charts #Graphane #UFO
See it here:
playground.graphane.dev/editor/gj9xw...
29.04.2025 13:13 — 👍 8 🔁 4 💬 0 📌 0
🔥 Blog by Dariusz Majgier. AI, fun facts, science & brilliant ideas:
👉 https://patreon.com/go4know
🔥 Get prompts, art styles & tutorials. Learn how to create ChatGPT & Midjourney images!
👉 Join me: https://patreon.com/ai_art_tutorials
Poetic Program, Typographic System
https://www.rmfrt.com/
Cuenta oficial de la Agencia Estatal de Meteorología.
📸 Photographer | capturing life's candid moments with my camera 📸
🌍 https://rupertrivett.photoshelter.com 🌍
#RealStreetPhotography #Photojournalism|
Skilled in unobtrusive, authentic #storytelling
📣NEW SUBSTACK 📔
👇📸👇📸👇📸👇📸
https://rupephoto.substack.com/
Award-winning journalist @CNN As Equals, with a focus on special projects, data reporting, and visual investigations dotto.carlotta@gmail.com
Data Analyst, AI enthusiasts and also #SocialPolicy researcher
#R #rstats #CSS #Sociology #DataJournalism
"We are like butterflies who flutter for a day and think it is forever." - Carl Sagan, Cosmos
My tangible memories:
https://www.flickr.com/photos/provide3d/albums/
Melbourne.
Data Scientist. Mathematician
Teacher. Mathematician. Podcaster
https://ko-fi.com/benjamincornish
Radiologist. Interested in neuroimaging, molecular imaging and therapies, particularly theranostics.
Utrecht, NL
Infectious disease modeler.
Science, visualization and communication +scifi enthusiast. 3D modeling & animation using Houdini as main tool. Research engineer at @physmedparis.bsky.social - INSERM. #dataviz #scicomm #sciart
I am doing also commissioned work: https://www.sci-vis-com.fr
Expert guides for home repairs, renovation projects, and DIY improvements. Discover budget-friendly solutions and step-by-step tutorials for your dream home makeover.
vulgar materialist
Enlightenment values
Working at https://zigor.com
Data scientist by day, couch potato by night
I ❤️ data
👩💻 #rstats | #rladies
📊 #dataviz | #ggplot
💌 #postcrossing | #snailmail
🏠 #DenBosch, NL
Well, well, if it isn’t that guy…
Data Vizz Engineer. Cantante en Blues Cavaliers y Sunloop