Topografische Karte automatisiert mit KI erzeugen?! / Generate topographic maps automatically with AI?! geoobserver.de/2025/10/06/t... via davidoesch #ai #ki #map #mapping #gistribe #gischat #fossgis #foss4g #OSGeo #spatial #geospatial #DataViz #gis #geo #geoObserver pls RT
06.10.2025 08:03 —
👍 4
🔁 1
💬 0
📌 0
And the aerial image before after : s.geo.admin.ch/tdch5it1ph5n
08.06.2025 08:03 —
👍 4
🔁 1
💬 0
📌 0
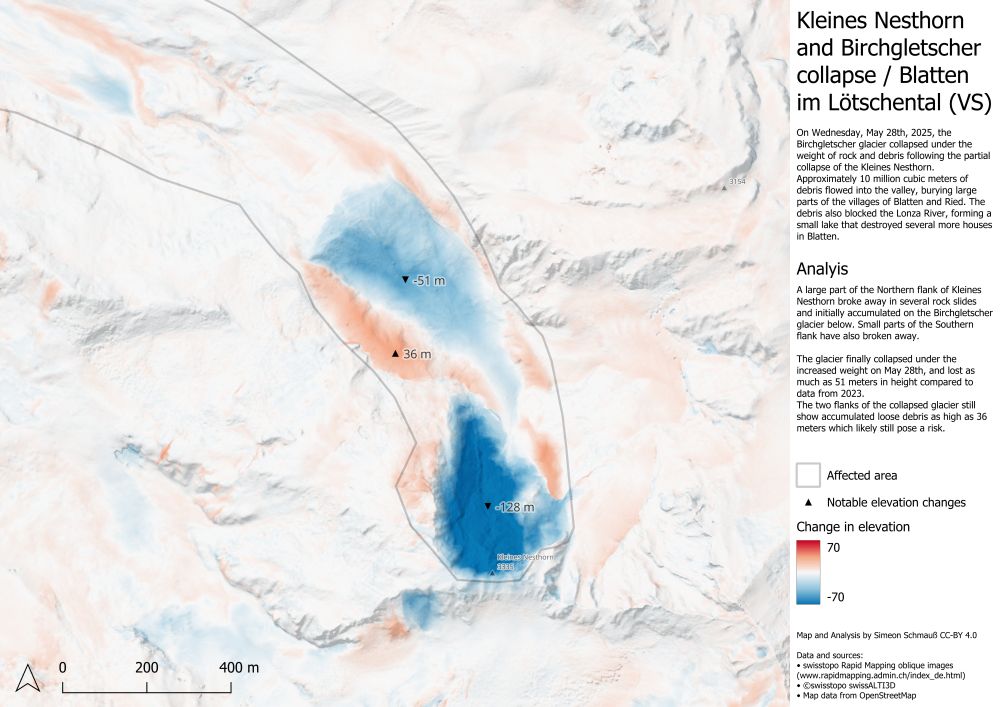
Closer map view showing the top of Kleines Nebelhorn and the Birchgletscher showing a signifcant loss of material at the Northern side of the peak and over the glacier area.
The side flanks of the glacier have not collapsed yet, with locally up to 36m of loose material.
A small collapse is also evident on the Southern side of the Mountain.
Taking a closer look at the Peak of Kleines Nebelhorn and the collapsed Birchgletscher, the areas of elevation loss become quite evident, with a loss of up to 128 m for the mountain, and 51 m for the glacier.
Some areas show accumulated loose debris which likely poses a risk for further rock slides.
01.06.2025 10:10 —
👍 38
🔁 5
💬 4
📌 2
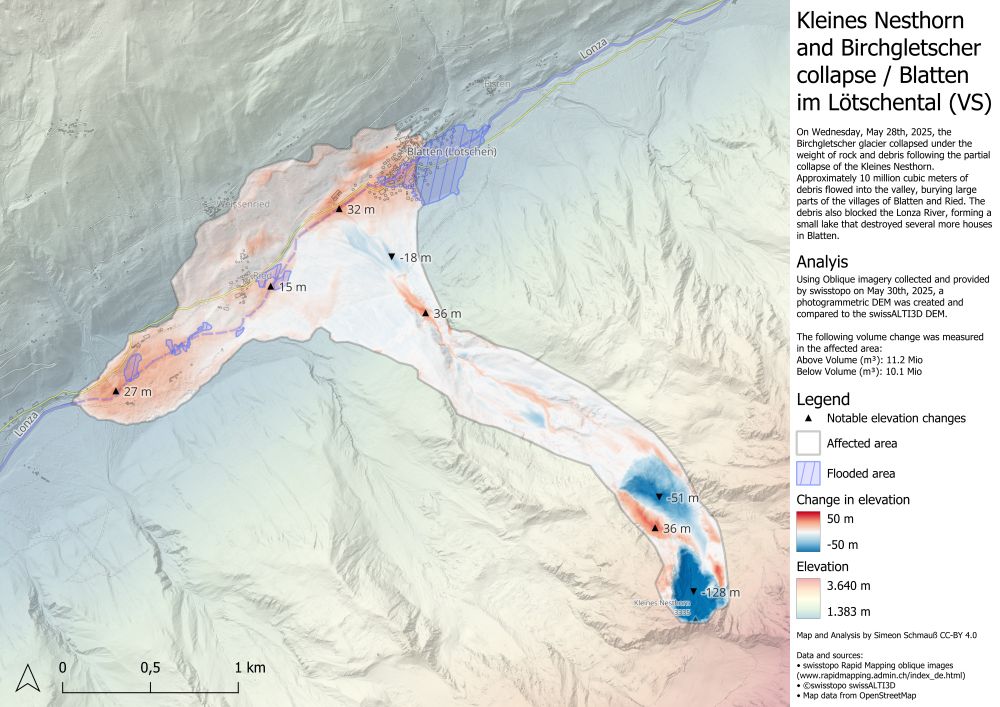
Map of the Lötschtal showing the area affected by the glacier collapse.
Blue colors show lost elevation, red areas elevation gains.
The two most notable areas are the collapsed peak of Kleines Nesthorn and the collapsed glacier which are shown in deep blue with elevation loss of up to 128m and 51m respectively.
The material slid down the mountain in an approximately 400m wide path and accumulated in a 2,5km long area on the valley floor which is up to 32m thick.
The newly formed lake above the village of Blatten is also drawn in.
The Map text reads:
Kleines Nesthorn and Birchgletscher collapse / Blatten im Lötschental (VS)
On Wednesday, May 28th, a2025, the Birchgletscher glacier collapsed under the weight of rock and debris following the partial collapse of the Kleines Nesthorn.
Approximately 10 million cubic meters of debris flowed into the valley, burying large parts of the villages of Blatten and Ried. The debris also blocked the Lonza River, forming a small lake that destroyed several more houses in Blatten.
Analyis
Using Oblique imagery collected and provided by swisstopo on May 30th, 2025, a photogrammetric DEM was created and compared to the swissALTI3D DEM.
The following volume change was measured in the affected area:
Above Volume (m³): 11.2 Mio
Below Volume (m³): 10.1 Mio
I also derived a new elevation model from the aerial images, allowing me to visualize the elevation change in the affected areas.
The rocks and debris in the valley are locally up to 32m thick and I estimate the total displaced volume is about 11 million cubic meters. #Blatten
01.06.2025 09:39 —
👍 93
🔁 17
💬 7
📌 2
@stim3on.bsky.social reconstructed the #Blatten landslide (Lötschental Valley) as an interactive 3D model, based on the open 👉 rapidmapping.admin.ch data
01.06.2025 07:07 —
👍 4
🔁 0
💬 0
📌 0
28 March 2025 #earthquake in #Myanmar. Another example of coseismic offset on MAXAR high resolutionimagery.
N-S fault and surface rupture cut across built areas in the town of Sagaing, W of #Mandalay. Note left side of the image moving North relative to right side. Offset is ~4.5m. ⚒️ 🧪
02.04.2025 12:40 —
👍 51
🔁 16
💬 1
📌 2
I have 2500 vector datasets as webresource , each of it consisting of 38 polygons/ multipoly . Offered as csv (with separate shp with geom) geojson and geoparquet. Getting the Value of a specific polygon: with geoparquet: streaming does not require a download. …Performance with less code in Python
03.03.2025 18:42 —
👍 2
🔁 0
💬 1
📌 0
STAC Browser
STAC works perfectly with vector data, and with #cloudnative formats like geoparquet you get your serverless spatial infra . Example of cloudnative raster and vector item is swisstopo Earth. Observation data data.geo.admin.ch/browser/inde... - once you STAC, you never go back .
02.02.2025 02:34 —
👍 5
🔁 0
💬 0
📌 0
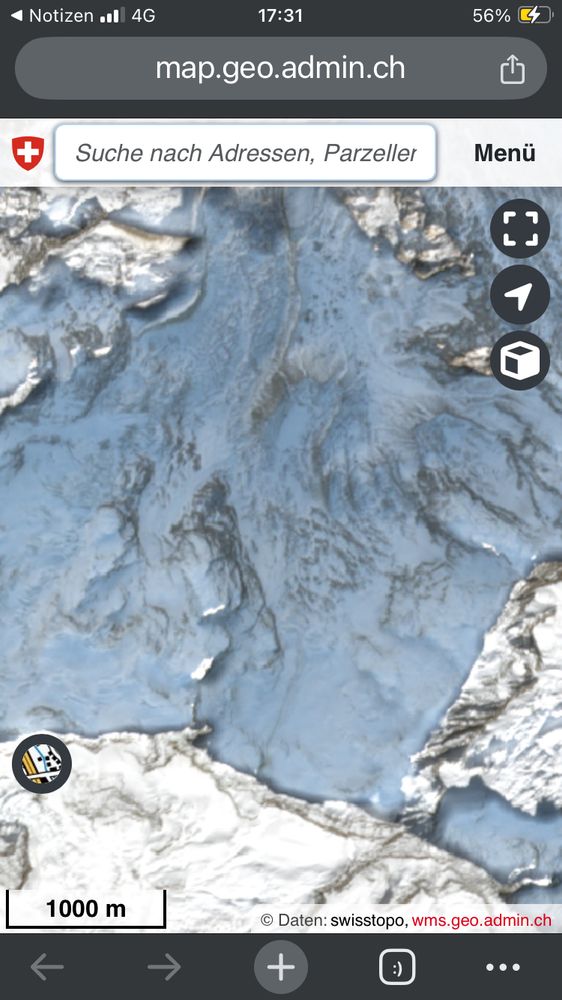
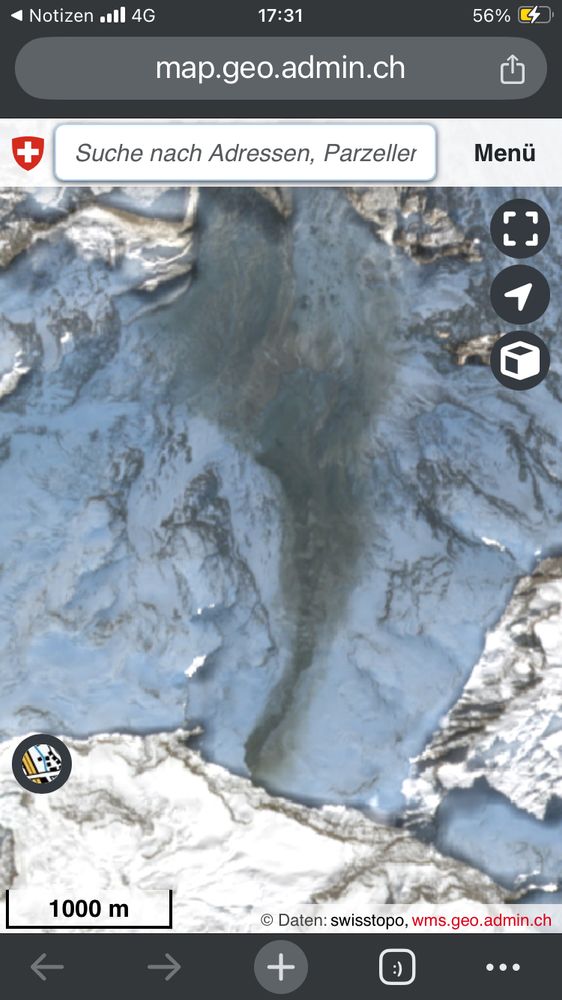
Vorher und nachher
02.01.2025 17:05 —
👍 1
🔁 0
💬 0
📌 0
Maps of Switzerland - Swiss Confederation - map.geo.admin.ch
Unter
s.geo.admin.ch/vhmcz9312psy ist ein eindrückliches Satelliten Bild von Sentinel-2 davon zu sehen .
Die Fläche die braun ist beträgt ca 2km2
s.geo.admin.ch/lmjlckikcr5r
Vorher/ nachher Bild
s.geo.admin.ch/jooffvjvn6k8
Quelle: swisstopo/ Copernicus www.swisstopo.admin.ch/de/satellite...
02.01.2025 15:49 —
👍 2
🔁 0
💬 1
📌 0
LinkedIn
This link will take you to a page that’s not on LinkedIn
Mit der webapp „Wie viele Briefkästen gibt es?“ ist es möglich die Anzahl der Zustelladressen in einem benutzerdefinierten geografischen Perimeter abzuschätzen
👉 Testen Sie die Anwendung hier: wieviele-briefkaesten-gibt-es.streamlit.app
#Geodaten #OpenSource #DataScience #opendata
22.12.2024 18:43 —
👍 3
🔁 1
💬 1
📌 0
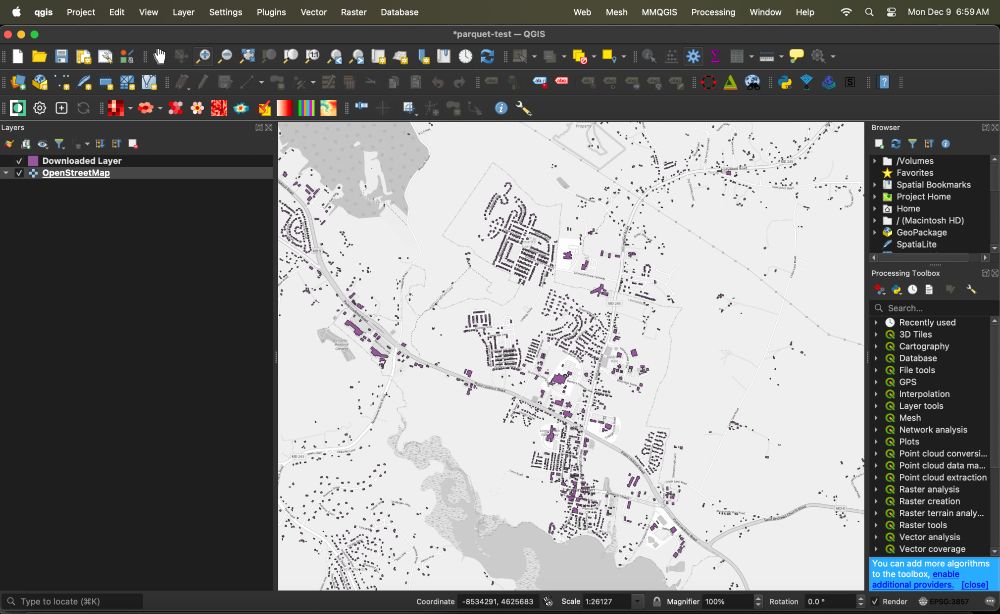
Promising initial results with the GeoParquet Downloader QGIS plug-in by @opencholmes.bsky.social. Many traditional GIS workflows can benefit from seamless desktop access to cloud-native data stores. This is GOOG/MSFT/OSM buildings from Source Cooperative in Leonardtown, MD.
09.12.2024 18:25 —
👍 10
🔁 5
💬 0
📌 0
Das limit is der GitHub action runner : 12GB auf dem home directory der Dir zur Verfügung steht. Wie schaffst Du es ein 40Gb pmtiles File herausstellen?
25.11.2024 18:40 —
👍 0
🔁 0
💬 1
📌 0
Sehr gut gemacht… eigentlich lässt sich damit ein ganzes geoportal mit x Datensätzen betreiben. Hast du schon Erfahrung mit Raster Daten gemacht?
25.11.2024 16:19 —
👍 1
🔁 0
💬 1
📌 0
The #SwissGIS starter pack go.bsky.app/Swv47u1 People & orgs based in #Switzerland who talk about spatial #datascience, #GIS, #carto & adjacent topics
24.11.2024 10:24 —
👍 2
🔁 2
💬 0
📌 0
@swisstopo ist auf Insta , x und LinkedIn… werde mal nudgen …
22.11.2024 12:36 —
👍 1
🔁 0
💬 0
📌 0