Wave analysis tools - Nature Reviews Methods Primers
Waves are ubiquitous in nature and occur across various scales and settings. In this Primer, Jafarzadeh et al. discuss techniques for preprocessing and analysing waves, including information on choosi...
Waves are everywhere around us. From the sub-nano scale of atoms to the vastness of the universe, we receive signals that are superpositions of waves.
This week's #Primer unveils the intricacies of wave #AnalysisTools shining a light on the best practices for #signalProcessing
Check it out!
📖👇
03.04.2025 15:05 — 👍 6 🔁 5 💬 1 📌 0

The SOLARNET Virtual Observatory, or SVO in short, collects metadata from as many solar observations as possible, especially those involved in the SOLARNET projects, in a common catalog and make them available to the scientific community.
Benjamin Mampaey, Véronique Delouille, Robbe Vansintjan (@orb-ksb.bsky.social). The SOLARNET Virtual Observatory: An Effective Way to Search Solar Datasets and Cross-Search with Solar Events. #SolarPhysics 300, 16 (2025) doi.org/10.1007/s112...
Part of collection The Many Scales of the Magnetic Sun
11.02.2025 18:11 — 👍 3 🔁 2 💬 0 📌 0
Bernard Fleck has told me the story of that day. Sounded like an intense experience for everyone there!
24.01.2025 09:45 — 👍 1 🔁 0 💬 0 📌 0

PhD Search
FindAPhD. Search Funded PhD Projects, Programmes & Scholarships. Search for PhD funding, scholarships & studentships in the UK, Europe and around the world.
[Final Reminder, since deadlines a few days away!] There are multiple fully-funded #PhDposition studentships in #STFC @ukri.org frontier science #phdpositions #AI #solarphysics
#spacephysics #astronomy #heliophysics
All 8 advertised on www.findaphd.com/phds/?Keywor... and I will re-post them now…
22.01.2025 09:19 — 👍 2 🔁 1 💬 0 📌 0
Great news! I bet it’s going to be nervous and exciting few days for you and the team.
16.01.2025 09:19 — 👍 0 🔁 0 💬 0 📌 0
As many have pointed out, the LASCO images on the SOHO website are saturated. So this is the result of my own algo for processing them.
And I will echo my sentiments from yesterday: This. Comet. Is. RIDICULOUS! 🤩😍 ☄️🔭☀️
14.01.2025 15:51 — 👍 20 🔁 9 💬 1 📌 0
I will also (soon) post a link to a Jupyter notebook which contains an example Cryo-NIRSP spectrum and the fitting routines for those interested.
I made use of a package called JAX, which is primarily for Deep Learning but can speed up optimsation problems. Well worth checking out.
13/13
08.01.2025 13:48 — 👍 1 🔁 0 💬 0 📌 0
In the next post in this series, I will delve into the results in more detail. I will give a glimpse of some of the science possible with Cryo-NIRSP, with a focus on waves in the corona.
12/n
08.01.2025 13:48 — 👍 0 🔁 0 💬 1 📌 0

Results from modelling the Cryo-NIRSP spectrum.
The modelling results are excellent! The data is fit extremely well which means we can extract the details of the coronal line profile (in purple).
While maybe not that exciting by itself, once we repeat this for all the spectra in the data set (over 6 million!), we get some fantastic results.
11/n
08.01.2025 13:48 — 👍 0 🔁 0 💬 1 📌 0

Locations of photspheric spectral lines in the infrared.
The dips at different wavelengths (and even where the coronal line is) are due to scattered photospheric light and absoprtion by water in the Eath's atmosphere.
Here I indicate locations of the photospheric lines and their potential source. These lines are taken from a modelled spectral atlas.
9/n
08.01.2025 13:48 — 👍 0 🔁 0 💬 1 📌 0

An example specturm from Cryo-NIRSP showing the coronal emission line.
Turns out the corona was there after all! The bright strip near 1074.7 nm is a coronal emission line (Iron XIII).
The details are best seen by plotting an individual spectrum. The coronal line is indicated by the arrow.
There is lots of other information in the spectrum, not all of it wanted!
8/n
08.01.2025 13:48 — 👍 0 🔁 0 💬 1 📌 0

Images of single exposures from the Cryo-NIRSP instrument showing intenisty as a function of wavelength and location along the slit.
Cryo-NIRSP is a slit-based spectropolarimeter, so we only get a narrow band across a fraction of the Sun (shown by red line in previous part of post).
Hence, each data file contains the results of a slit exposure, so is wavelength verus slit location. There are two beams, so two similar images.
7/n
08.01.2025 13:48 — 👍 0 🔁 0 💬 1 📌 0

Image from Solar Dynamics Observatory showing the corona in EUV emission. Also shows the DKIST field of view.

GOES SUVI image of the Sun's corona.
The first step was to provide some context for the Cryo-NIRSP data. I used data from NASA's SDO and GOES SUVI, plotting the expected location that DKIST was observing over the top.
Cryo-NIRSP observed an open field region, catching an active region and a streamer base on either edge.
6/n
08.01.2025 13:48 — 👍 0 🔁 0 💬 1 📌 0
I forgot about the data while the Cryo-NIRSP science team did initial processing. And 3 months later I was sent the data files. With trepidiation I dove in!
5/n
08.01.2025 13:48 — 👍 0 🔁 0 💬 1 📌 0

An image showing raw spectra from an observation of the Sun.
I then recieved the email saying the data had been taken 🥳
The team attached an image of the data, reporting they could see the corona....
My honest first reaction was 'What the hell?!?' 🤨
I didn't know what to make of it. I am used to working with pretty images, so felt a bit morose 😢 😂
4/n
08.01.2025 13:48 — 👍 1 🔁 0 💬 1 📌 0
I was fortunate to have a proposal accepted in the 2nd Observing Cycle. Needless to say, I was ecstatic 😁
It was a long 9 month wait until the data was actually taken. But the DKIST team were great at keeping me informed of preparations and discussed the details of implementing my proposal.
3/n
08.01.2025 13:48 — 👍 0 🔁 0 💬 1 📌 0
Getting access to Cryo-NIRSP data suitable for your science goals requires submitting a proposal during one of the dedicated calls. From what I can tell, this has been well subscribed, showing a great community interest in DKIST.
Existing gata can be accessed by the DKIST data center.
2/n
08.01.2025 13:48 — 👍 0 🔁 0 💬 1 📌 0
Late last year I started a series of posts on science with DKIST Cryo-NIRSP. In this post I discuss my initial experiences of working with the data and show some of its features.
This should nicely lead into the new science posts I am planning in the next few weeks.
1/n
☀️🧪
08.01.2025 13:48 — 👍 7 🔁 1 💬 1 📌 0
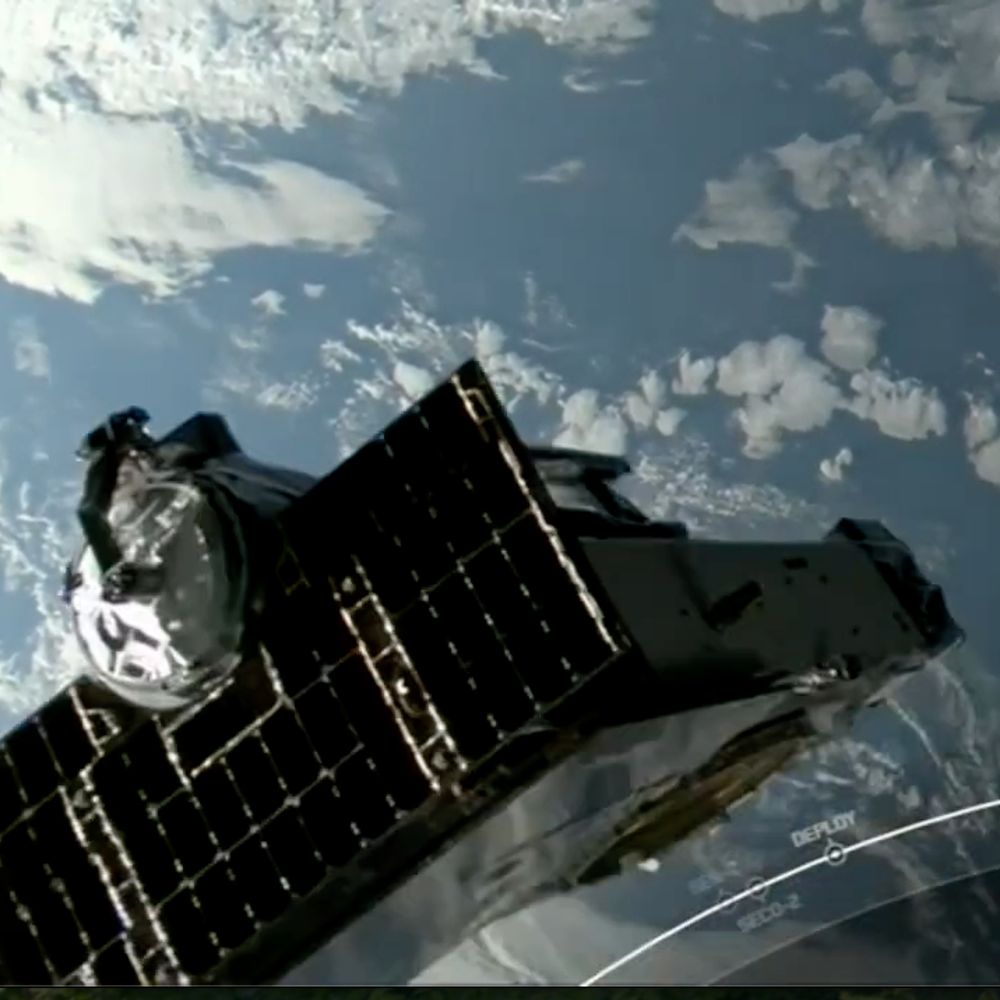
YouTube video by WebsEdge Science
The Never-Before-Seen Sun – Sun Coronal Ejection Tracker (SunCET)
Congratulations to my colleagues James Mason, Dan Seaton, Cristina Kay, Amal Chandran, and Aaron Magner on a phenomenal video on the phenomenal #CubeSat mission #SunCET! Very nice bit of science outreach at #AGU2024! ☀️🧪🛰️🔭🎢
10.12.2024 03:26 — 👍 34 🔁 14 💬 0 📌 1
The Daniel K. Inouye Solar Telescope (DKIST) Cryogenic Near-Infrared Spectro-Polarimeter
If you want to know more about Cryo-NIRSP, the instrument paper is at rdcu.be/d2WnH
The first results are given in a paper by Tom Schad: iopscience.iop.org/article/10.3...
09.12.2024 16:06 — 👍 1 🔁 0 💬 1 📌 0
What makes Cyro-NIRSP special is it can measure spectra fast (every 1s), with a high sensitivity, and a great spectral and spatial resolution. This combination opens up lots of opportunities that previous instruments could not!
In the next (extended) post I will talk about the data itself.
09.12.2024 16:06 — 👍 1 🔁 0 💬 1 📌 0

A picture of the Cryo-NIRSP instrument. Courtesy NSO.
Cryo-NIRSP is a type of spectrometer. Its focus is on measuring coronal spectral lines that are found in the infrared.
It provides multiple spectra at different positions along a slit, so can focus only on a narrow strip of the Sun at any one time.
09.12.2024 16:06 — 👍 1 🔁 0 💬 1 📌 0
There are a range of instruments for studying the Sun but they fall in to two broad categories:
- Imagers: Counts up the photons over a certain wavelength range. Not so bothered about the line's details.
- Spectrometers: Counts photons at different wavelengths to accurately measure the lines.
09.12.2024 16:06 — 👍 0 🔁 0 💬 1 📌 0

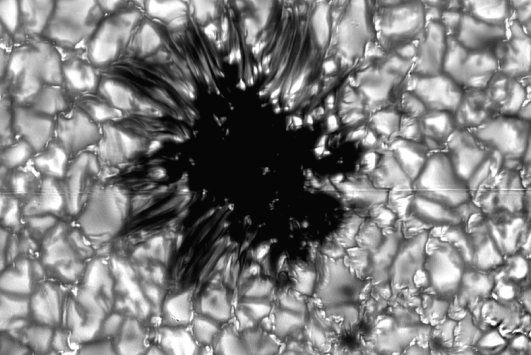
A plot of the hydrogen alpha absorption line.

A picture of chromosphere taken with the Dutch Open Telescope. Courtesy R. Rutten.
The plot shows the Hydrogen alpha absorption line from the spectrum. Note scale is only 1 nm! This line is formed in the chromosphere.
Maybe not so impressive by itself. The image shows what the Sun looks like if we only look at light from this line. Beautiful! You can see a sunspot and filaments.
09.12.2024 16:06 — 👍 1 🔁 0 💬 1 📌 0
At certain wavelengths there is either more or less light than the blackbody. This is largely due to the Sun's atmosphere, which contains elements that do the absorbing or emitting.
09.12.2024 16:06 — 👍 1 🔁 0 💬 1 📌 0
The solar spectrum generally follows a Planck function (B -shown in purple). This is because the photons are created in the Sun's core and reach a near-blackbody state before they leave through the surface.
The Sun's spectrum is a lot more interesting than a blackbody though.
09.12.2024 16:06 — 👍 2 🔁 0 💬 1 📌 0

An plot of the sun's electromagnetic spectrum with the Planck function over plotted.
I am starting with some basics, so hopefully everyone can follow along.
The Sun emits light across a range of wavelengths. Most of the light is in the optical part of the spectrum, wavelengths of 400 nm to 800 nm, shown in the picture of the Solar Irradiance.
09.12.2024 16:06 — 👍 2 🔁 0 💬 1 📌 0
Nature Reviews Methods Primers publishes Primers - introductory reviews on methods and techniques across the life and physical sciences. https://www.nature.com/nrmp/
Four spacecraft, one instrument … imaging almost nothing at all.
PUNCH is a polarizing wide-field imager, distributed across four
orbiting spacecraft, to track space weather (and solar wind) across
the heliosphere. (Non-NASA account for the mission team).
Computer scientist on a life-science mission. Working on pushing bioimage analysis, computer vision, AI/ML methods for the life sciences. Love running and pottery.
Distinguished Scientist at Google. Computational Imaging, Machine Learning, and Vision. Posts are personal opinions. May change or disappear over time.
http://milanfar.org
Assistant Professor at Uni Birmingham. Working on Image processing, denoising, generative image models and other interesting things.
Musician, math lover, cook, dancer, 🏳️🌈, and an ass prof of Computer Science at New York University
An international science team with a focus on “Waves in the Lower Solar Atmosphere” (WaLSA) — https://WaLSA.team
Solar astrophysics PhD candidate ☀️ NASA FINESST ✨ FURST instrument scientist 🚀
drives the IRIS satellite sometimes 🛰️
Montana State University 🏔️
The International Space Science Institute (ISSI) in Bern, Switzerland, is an institute of advanced studies where scientists from all over the world meet to discuss and publish about the most-pressing science topics.
Visit us on www.issibern.ch
Solar Physics. Washington DC. Pamplona.
PhD Student at Austrian Space Weather Office ☀️🪐🚀
Space Weather, Heliophysics and AI Enthusiast 💻🔭🛰️📊
https://hruedisser.github.io
☀️Chasing CMEs at the Austrian Space Weather Office ☀️
🏳️🌈🐴🐈🐓
Astrofísica/Astrophysics: Solar + space plasmas
Teaching + Outreach.
Solar & heliospheric physicist @ UCLA
🥃 Retired: Statistical analyst [Bayes, Chebychev,Taleb, rpart() 🤣], ASQ Certified Quality Engineer, writer, UNLV MA/EPS & adjunct (BGladd.com/unlv), musician, photographer. PD dx: dyskinesiac; Sinemet Still Sux. Grandpa❤️ Great-Grandpa❤️ BGladd.com KHIT.org
Solar Physicist, loves art and literature
Exploring the obscure wavelengths of the solar spectrum.