UEFA Champions League Live Table and Predicted Knockout Opponents | Opta Analyst
Track the chaos of the final round of 2025-26 league-phase fixtures with our live Champions League table and data-powered predictions.
UEFA Champions League: Live Table 📈
This table updates live, showing each team’s probability of finishing in the top eight, reaching the knockout play-offs, and being eliminated. It also shows the potential opponents each team could face in the next round.
theanalyst.com/articles/cha...
28.01.2026 11:44 — 👍 12 🔁 2 💬 0 📌 0

Let's gooooo
theanalyst.com/articles/cha...
28.01.2026 10:58 — 👍 25 🔁 5 💬 0 📌 2
One of those days
21.05.2025 13:33 — 👍 3 🔁 0 💬 0 📌 0
Download Raycast, add Toothpick, set up a hotkey to connect/disconnect your headphones. Instant quality of life upgrade. Especially if you cycle through devices for meetings/music/podcasts
12.05.2025 22:09 — 👍 3 🔁 0 💬 1 📌 0
YouTube video by Dezio Sounds
The Distillers - Coral Fang
Oh man The Distillers were so good youtu.be/P5iSk-6Wdow?...
10.05.2025 18:58 — 👍 4 🔁 0 💬 0 📌 0
So good, started in February and going on to book 4 after I finish Dawnshard. Definitely going to pick up Mistborn after
10.05.2025 16:21 — 👍 0 🔁 0 💬 1 📌 0
Schalke thumped, sun’s out, touching grass at the top of Königsallee with Dozenbier reading Stormlight Archive. Thriving.
10.05.2025 16:02 — 👍 1 🔁 0 💬 1 📌 0

A scatterplot shows Bundesliga clubs’ total personnel costs (log scale) on the x-axis and points earned after matchday 29 of the 2024-25 season on the y-axis. A regression line indicates the average performance trend, highlighting which clubs are overperforming or underperforming relative to their spending. Clubs are color-coded by performance and budget category. Teams like Eintracht Frankfurt and Bayer Leverkusen shown as efficient overperformers, Borussia Dortmund underperforms.
I created this chart but I don’t like one particular finding.
If you correlate budget spent on personnel vs. points gained in the Bundesliga, some Bundesliga clubs are more efficient at turning spending into points than others.
Heja BVB. 🙈⚫️🟡
#30DayChartChallenge #Day13 Clusters 📊 #rstats
16.04.2025 14:23 — 👍 42 🔁 6 💬 4 📌 6
Bundesliga Zwei? 🥹
17.04.2025 19:51 — 👍 0 🔁 0 💬 0 📌 0
Hi Gregers, I'll have a full job description hopefully next week that will include more information on the project and the skills we are looking for but for anything else you can always send me a DM.
17.04.2025 19:48 — 👍 1 🔁 0 💬 0 📌 0
May have some freelance work for an RStats Shiny project on the horizon. Looking for someone for ~15 hours per week over 3 months. #dataviz
17.04.2025 19:00 — 👍 14 🔁 9 💬 4 📌 3
There needs to be some kind of Dunning-Kruger #dataviz for making your own interactive tables from scratch but the slope of enlightenment onwards is just acceptance that a component that can do everything everyone wants but with rigid behaviour everyone expects is really really hard to build
09.04.2025 21:44 — 👍 3 🔁 0 💬 0 📌 0

Should this have been several smaller PRs? Yes. Does it feel great removing all of those LOC in one? Also yes.
04.04.2025 18:01 — 👍 3 🔁 0 💬 0 📌 0
I’ve seen it on my own photos, use it for saving recipes I take a photo of etc… but that was always in the photos app, think it’s the first time I’ve seen it on a separate app though
03.04.2025 21:51 — 👍 1 🔁 0 💬 0 📌 0
Is this a Bluesky thing or an iPhone thing that I can select the annotations in this viz???? 🫨
03.04.2025 20:19 — 👍 1 🔁 0 💬 1 📌 0
This is where I got my professional start with the company and it’s honestly such a cool, impactful job with massive scope for creative thinking
28.03.2025 11:04 — 👍 3 🔁 0 💬 0 📌 0
https://eobe.fa.em2.oraclecloud.com/hcmUI/CandidateExperience/en/sites/CX_1001/job/692/?utm_medium=jobshare&utm_source=External+Job+Share
Stats Perform are looking for someone to join the data analysis team to work along side Jonny Whitmore and Jon Manuel. If you're passionate about football data and want to shape how we see the game through engaging visualisations, be sure to apply! ⚽️📈📊 #dataviz
t.co/lOaOOtBJAY
28.03.2025 11:04 — 👍 11 🔁 6 💬 1 📌 0
Great new mapping tool from the OpenStreetMap team :
view borders throughout history : goes back 4000 years!
www.openhistoricalmap.org/history#map=...
27.03.2025 00:45 — 👍 9 🔁 2 💬 0 📌 0
Oooooooh 😍
27.03.2025 12:57 — 👍 1 🔁 0 💬 0 📌 0
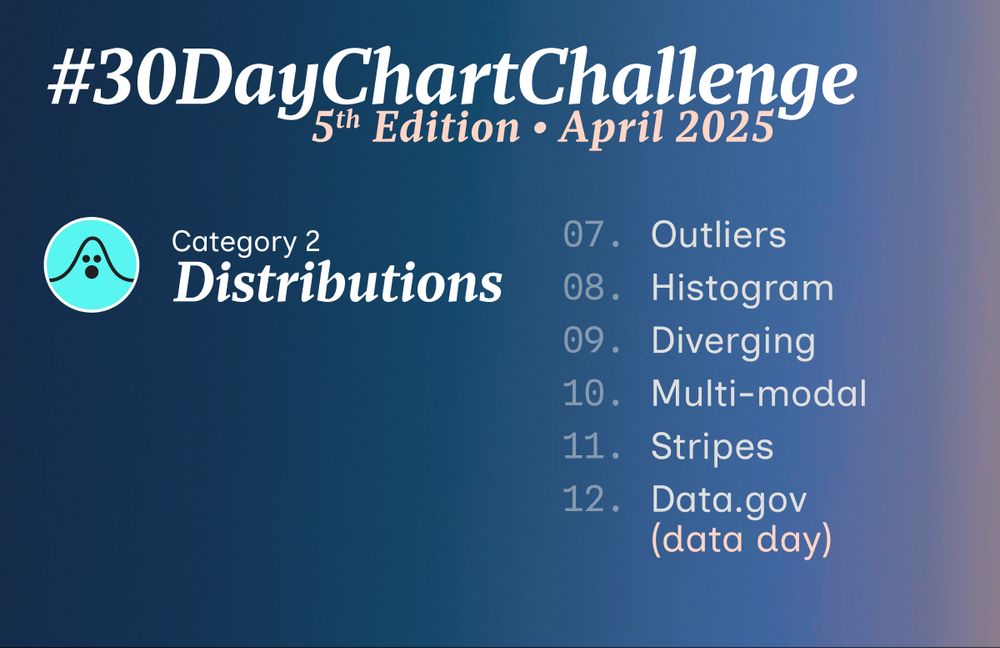
A banner with the prompts for the 2nd category: Distributions
07. Outliers
08. Histogram
09. Diverging
10. Multi-modal
11. Stripes
12. Data.gov (data day)
13 days left ⏳ until the #30DayChartChallenge kicks off. Are you really prepared? 😁📊📈📉
Here are the prompts for the 2nd category: Distributions
More info on Github: github.com/30DayChartCh...
Let us know if you have any further questions!
#dataviz
19.03.2025 19:25 — 👍 11 🔁 6 💬 1 📌 0
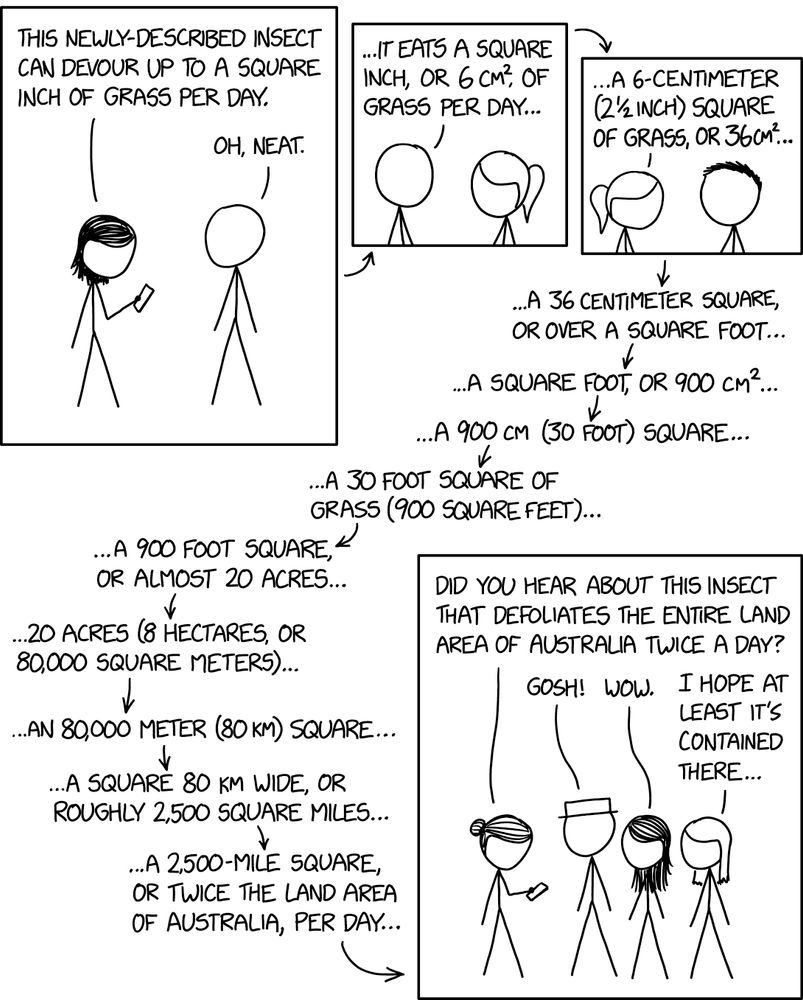
Square Units xkcd.com/3065
19.03.2025 22:55 — 👍 6201 🔁 572 💬 86 📌 29
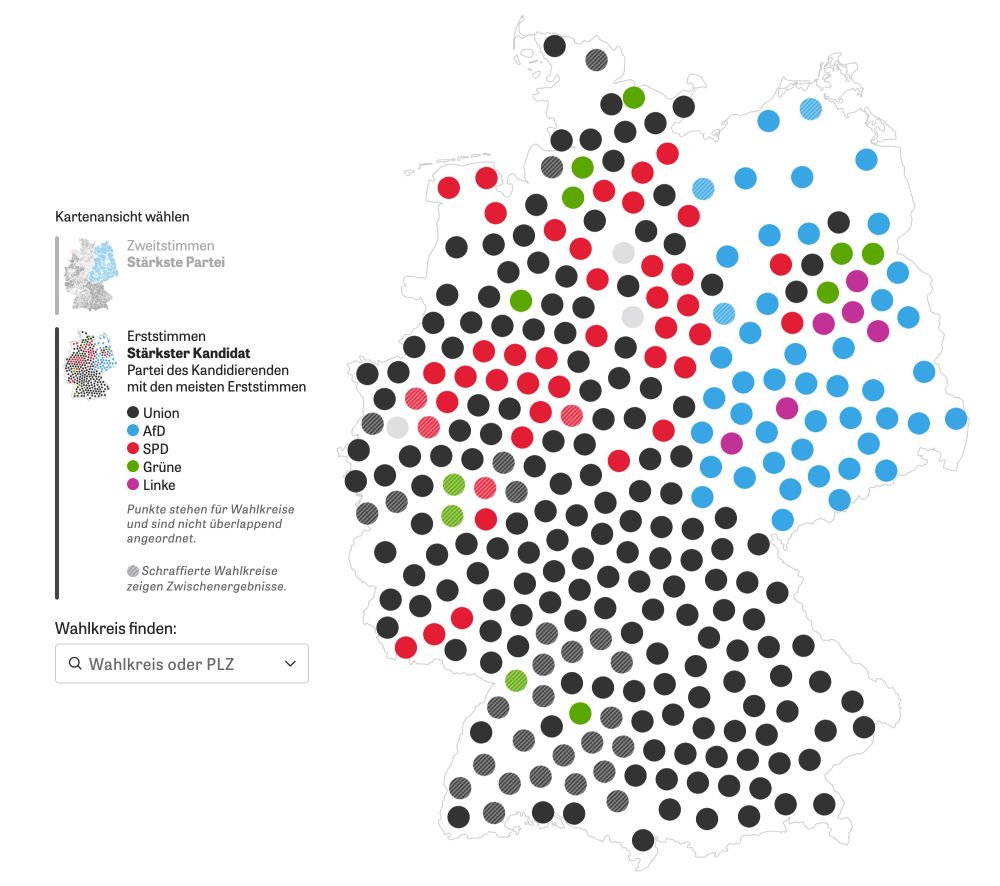
Cartogram of 299 German election districts
For the German election we wanted to use a cartogram of German election districts but didn't find anything good, so we created our own. Here's a little nerd thread how the final algorithm worked 🤓 🧵 #gis #cartogram #election #datavis #cartography
27.02.2025 16:48 — 👍 558 🔁 179 💬 18 📌 25
An honour to be nominated for Digital Sports Publisher, as well as Specialist Sports Publisher and two individual nominations for Data Journalist for @alitweedale.bsky.social
& @davidsegar.bsky.social.
We're just checking with the Opta supercomputer about our projected chances of winning.
27.02.2025 20:24 — 👍 21 🔁 6 💬 0 📌 0
There are publicly available sources for xy data you can check out
23.02.2025 22:25 — 👍 1 🔁 0 💬 0 📌 0
Not dumb at all, it's just a regular 2d svg without any transformations needed for the xys. The viz container is just transformed using rotate3d in css.
22.02.2025 18:42 — 👍 5 🔁 0 💬 0 📌 0
Cooking... #dataviz
22.02.2025 18:05 — 👍 40 🔁 1 💬 3 📌 0
You don't wanna know how long I spent working out why I was getting unexpected rerenders only for it to end up being the curly braces around this sort function fml 🫠
17.02.2025 16:49 — 👍 2 🔁 0 💬 1 📌 0
Love the colour on these
11.02.2025 17:47 — 👍 1 🔁 0 💬 0 📌 0
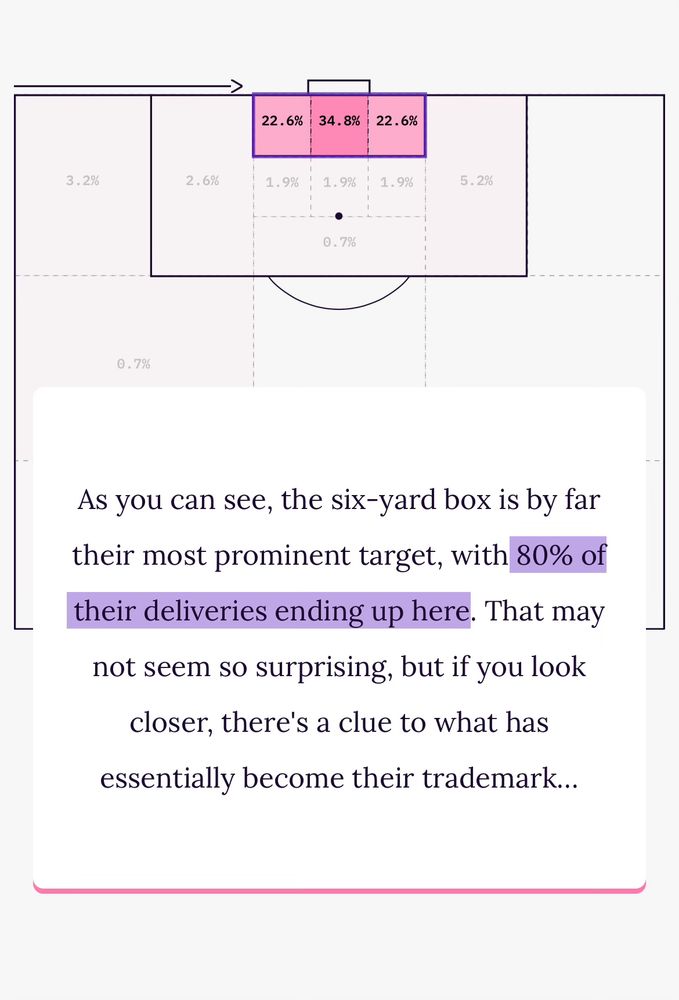
Did a little scroll piece on set pieces in the Premier League with @rbenson92.bsky.social
theanalyst.com/2025/02/arse...
11.02.2025 11:57 — 👍 31 🔁 9 💬 0 📌 0
The influence of set-piece coaches in the Premier League seems to have grown significantly in recent years, but how much of an impact have they had, and is it just a fad?
Here, our new-look interactive article analyses Premier League set-pieces.
Read here: theanalyst.com/2025/02/arse...
11.02.2025 11:47 — 👍 37 🔁 10 💬 1 📌 1
|Photographer |Digital Artist |No OF&DM!
Fine Art Prints✦Book CoverImages✦Image Licensing
🎨Published in various digital and print media worldwide.
https://prints.hitdelight.com/
https://hitdelight.pictorem.com
#FineArt #photography #print #imagelicensing
agile, developer (javascript, nodejs, svelte, react, php, swift, kotlin), tinkerer, maker living in offenburg / black forest, germany with his wife and three sons.
Director Data Analytics, US Soccer (He/Him)
All the sports. Some film, TV, culture & news.
Weekly writing at www.gobb.ie
📌🇮🇪 Cork, Ireland
⚽️ writing & broadcasting with ESPN.
Also host of *The Truth* podcast 🎙️with Dougie Critchley, on the Ranks FC feed. Search for it!
college basketball at https://www.basketunderreview.com/
5x marathoner
Women’s Football Data Analyst @ Chelsea FC
writing: https://beyondthetouchline.substack.com/
music: https://soundcloud.com/csains
Climate visuals @carbonbrief.org
Former pro footballer. Passionate about coaching, sports analytics, #rstats. Teamworks (Zelus) 📊, AshevilleCitySC ⚽️
#dataanalysis #rstats #dataviz
Senior Data Analyst, DTU Food
Views mine
www.gregdubrow.io
www.linkedin.com/in/dubrowg/
https://medium.com/the-polymaths-dilemma
Senior Graphic & Data Designer @CrisisGroup. Formerly @NOHAnetwork @LighthouseRR, @UNHCR. A love for visualising information to give new perspectives.
Covering SF Bay Area Soccer on SoccerBayArea.com Also: SFGate photographer/editor, freelance #photojournalist, p/t soccer writer/fanatic. Published Photo Book of soccer fans of the #fifaworldcup, #USMNT
Data Visualization Designer | Tableau Public Ambassador | #COYI https://public.tableau.com/app/profile/adedamola8122/vizzes
We're on a mission to elevate how business communicates and understands data, tackling complex problems with innovative solutions. JasonForrestAgency.com
CDO @ https://ludonautics.com/
Former Head of Data Science @statsbomb.com
Can occasionally pass the Turing test
https://dvatvani.com
Data art since 2010, collecting data since I was 4yo. Poetic Web. Data and generative artist turning sound and music into visuals. Lecturer, TEDx speaker, tizianaalocci.com | London based | IG: tiz.alocci | Founder of dataviz studio https://necessity.ink/
Data journalist for @economist.com. Interim special-projects editor.
Subscribe to The Economist's data newsletter:
https://theeconomistoffthecharts.substack.com/
➡️ ameliaantzee.com
ℹ️ Old name Trud Antzée
🌸 Pronounced an-TSEE
📈 Creative information designer
🎼 Former musician & teacher
🎧 Dancer & DJ of Argentine social tango
✏️ English & Norwegian nynorsk
🇳🇴 Oslo, Norway
💃🏻 She/her
⛔️ No AI
#️⃣ #AmeliasInspiration
Graphics, design, editing and whatnot at @npr.org