So they have anyone who's either/both an alum or donor.
Yeesh

@gregerskjerulf.bsky.social
#dataanalysis #rstats #dataviz Senior Data Analyst, DTU Food Views mine www.gregdubrow.io www.linkedin.com/in/dubrowg/ https://medium.com/the-polymaths-dilemma

email from hacked donor relations system with the following text: Dear Penn community, The University of Pennsylvania is a dogshit elitist institution full of woke retards. We have terrible security practices and are completely unmeritocratic. We hire and admit morons because we love legacies, donors, and unqualified affirmative action admits. We love breaking federal laws like FERPA (all your data will be leaked) and Supreme Court rulings like SFFA. Please stop giving us money. Warm regards, The University of Pennsylvania

email from hacked university donor relations system reading: Dear Penn community, The University of Pennsylvania is a dogshit elitist institution full of woke retards. We have terrible security practices and are completely unmeritocratic. We hire and admit morons because we love legacies, donors, and unqualified affirmative action admits. We love breaking federal laws like FERPA (all your data will be leaked) and Supreme Court rulings like SFFA. Please stop giving us money.
Somebody at my graduate alma mater's fundraising office's IT team is going to be busy this weekend. 😳
These two plus a third one have all hit in the last 10 minutes or so.
Probably time to change my passwords in the alumni portal.

Front-facing shot of a grey cat with yellow eyes on a human's lap, looking just below the camera lens.
CatGPT thought my language was too verbose & inefficient, and chided me for using map_dfr() as it's been soft-deprecated.
10.10.2025 10:43 — 👍 5 🔁 0 💬 0 📌 0
Side shot of a grey cat sitting on a human's lap at a table. The human's left hand is on a computer keyboard. The cat is seemingly looking at a computer screen with code and a plot
CatGPT helping me debug a custom #rstats plotting function
10.10.2025 10:43 — 👍 37 🔁 3 💬 4 📌 1DDSA = Danish Data Science Academy
ddsa.dk

A view of the canal and parliament building in Copenhagen
Cheers to all who attended and contributed, and to Simone Pasolini for his excellent event management work. Thanks to the staff at Matrikel1 for setting us up in a room with a beautiful view of the canal and Christiansborg.
18.09.2025 21:08 — 👍 1 🔁 0 💬 1 📌 0
Large television screen with slides for a data visualization talk. The screen faces the first row of chairs where the audience will sit

a group of people work together on laptops to visualize data

two people presenting the data visualization they created
A fun afternoon co-presenting the DDSA Data Science in Practice session on data visualization. We had a creative & engaged group who, barely knowing each other, worked in groups to produce insightful data viz on data they hadn't seen before today
Link to slides:
greg-dubrow.github.io/DDSA_DataViz...
Not at the conference so not sure which week of data he's using, but I wonder if you went back & looked at code for people who participated and posted it, if some didn't correct for it somehow, and just got on with it. Maybe assumed it was part of the assignment?
18.09.2025 04:31 — 👍 1 🔁 0 💬 0 📌 0And, not to dismiss any value in the bot...but packages like skimr & DataExplorer and other EDA tools are very effective for data quality checks w/out having to write tons of your own code.
Is it nice to have it embedded in the IDE? Of course.
Is this a new data quality tool? No.
If I were still teaching or if I go back to it, I'd use an exercise like this. A good antidote to students relying on AI to do all the work. While it's sad that AI is negatively impacting the classroom, it's good to see innovative "analog" pedagogical solutions to keep students engaged.
05.09.2025 06:49 — 👍 0 🔁 0 💬 0 📌 0I'm sure he's spent at least 10,000 hours reading about it. 🙄
04.09.2025 06:35 — 👍 2 🔁 0 💬 0 📌 0Plus, it's in Lyngby, which is where I lived for the first 5 years of my life before moving to the US (the bus from campus to the train station goes right by my old house). So it's sort of coming home.
01.09.2025 16:10 — 👍 1 🔁 0 💬 0 📌 0
photo of a desk with, from left to right, a laptop, moleskine notebook with a pen and small wooden bird on it, and two monitors.
New gig, new digs!
First day as Senior Data Analyst at DTU National Food Institute where I'll be helping researchers in nutrition & food science. It leverages my skills & experience in #rstats #dataviz and academic research.
Hah.
"My old work is such sh*t, good luck training your models with them to get useful results"
Worth a check to see if any of your work has been hoovered up to train Anthropic models. The Atlantic story has a link to search Libgen. If you have pirated work, you can join the class action if you like by following the link in the 2nd post.
28.08.2025 11:27 — 👍 1 🔁 0 💬 1 📌 0...including:
* How I got back into a better headspace to do personal data projects after a couple of disappointing job search outcomes
* Plus a few nuggets of advice
composite collage of 4 charts submitted to the 30 Day Chart Challenge
What's the value of contributing to the #30DayChartChallenge ?
I took a moment for self-reflection to think about that & put it into a new post on the blog
www.gregdubrow.io/posts/lesson...
Thoughts on improving my #rstats & #dataviz skills, learning more about education in 🇩🇰 & lots more.. 1/
Had a fun time presenting on social sciences data analysis to the CopenhagenR meetup group this week.
Slides are here: greg-dubrow.github.io/copenhagenR-...
If you're into #rstats & #dataviz the CPH r group is a hyggeligt & informative space. Come to the meetups & even better, present something!
I'll be doing a wrap-up post soon on what I've learned and how working on the chart prompts have improved my skills & taught me so much about education in Denmark.
06.05.2025 11:22 — 👍 1 🔁 0 💬 0 📌 0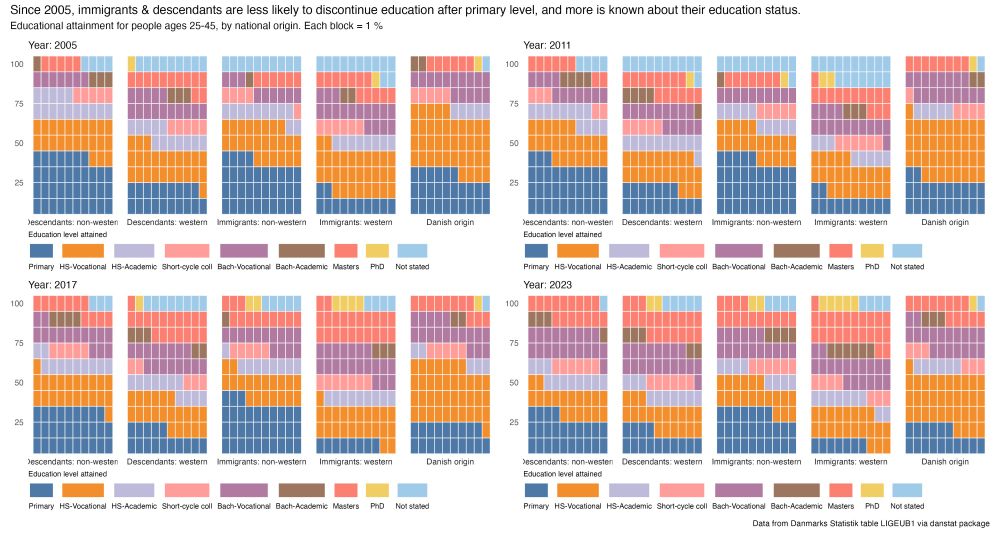
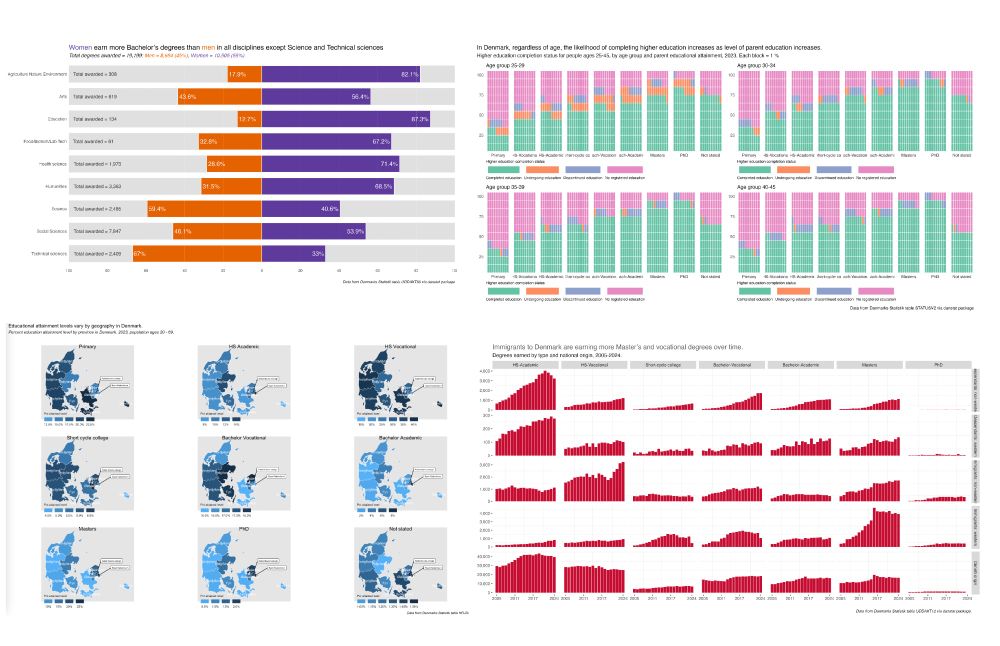
waffle chart of educational attainment in Denmark by national origin in 2005, 2011, 2017 and 2023
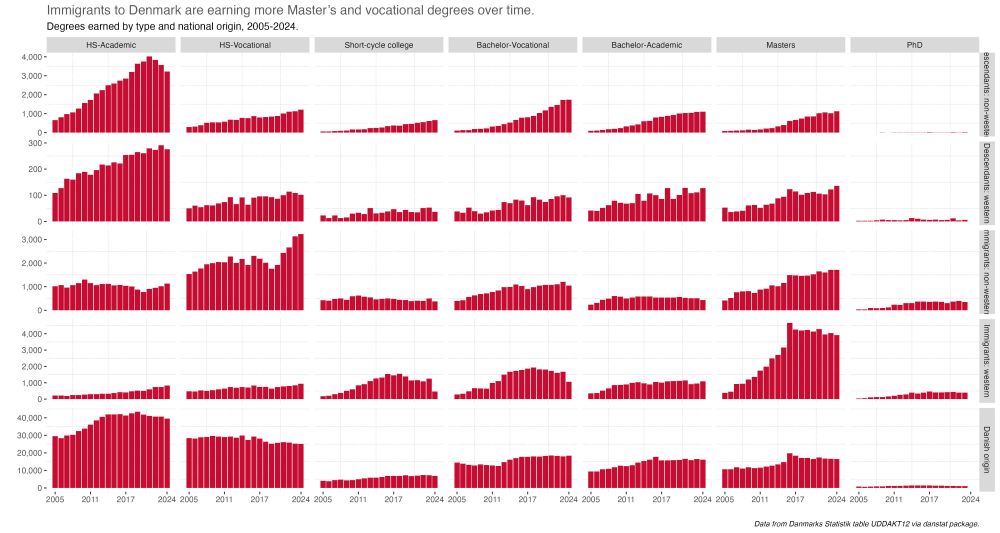
Faceted bar charts of waffle chart of degree types earned in Denmark by national origin from 2005 to 2024
A bit late for my last #30DayChartChallenge some #rstats #dataviz for day 28's prompt - inclusion. Looking at the immigrant experience in the 🇩🇰 education system
tl/dr is more attainment beyond primary level & immigrants rely on vocational degs for social mobility
www.gregdubrow.io/posts/30-day...
What found was Copenhagen has higher percentages of people with Master's and PhDs than other provinces. See more detail in the full post, link will be in the comments.
* or Spanish for "the country"
** the geographic designation in Denmark between city and region.

Plot of 9 maps of Denmark faceted by educational attainment level showing percent of that level by province.
What is educ attainment by province in 🇩🇰? See this (late) post for #30DayChartChallenge prompt 18 El Pais *
#dataviz is maps plotting % by province **. I reused code from a 2024 post, w/ interactivity via g🦒 📦
#rstats data -> 🇩🇰s Statistik via danstat 📦
Full post www.gregdubrow.io/posts/30-day...
random notes...
Plots are interactive, using ggiraph.
The data is a bit messy in early years, so hard to draw any meaningful inference in changes over time.
Oh, in case you're wondering, US rates are in the mid-90s now. Let's see what happens in a few years.

Messy line plots showing measles vaccination rates by country within European subregions, 2000-2023
The #30DayChartChallenge prompts 24 & 25, @who.int & risk
For no particular reason, looking at measles vax rates worldwide. #dataviz in #rstats using rgho 📦
More details in post, but messy data in early 2000s & not sold on design choice for Euro subregion plot
www.gregdubrow.io/posts/30-day...

line graphs showing monthly income for men and women in denmark from 2015 to 2023. there is a gap in wages, with men earning more
A #30DayChartChallenge prompt 23 log scales post turns into a post about gender pay gap in 🇩🇰
#dataviz #rstats via danstat 📦
Sadly pay gaps is common, even in countries like 🇩🇰 w/ wage equality laws & good unions.
Digging deeper by deg type, still a gap. More at:
www.gregdubrow.io/posts/30-day...

📊 #30DayChartChallenge: Steven Ponce’s Contributions
Looking for inspiration? This repo is packed with creative, reproducible R visualizations across themes. A great place to spark your next #dataviz idea!
🔗 buff.ly/FzjGzmm
More R resources 👉 buff.ly/MSQa1kh
#RStats

dotted line chart displaying degrees awarded by sex and major in the technical sciences discipline in denmark from 2005-2024
Prompt 19 | #30DayChartChallenge | smooth
(yes, I did 20 yesterday & today should be prompt 23 🤷♂️)
It's time series #dataviz of bachelor degs in 🇩🇰, overall & by sex. #rstats using danstat 📦
Most interesting thing for me was tech science degs. Read more in the post:
www.gregdubrow.io/posts/30-day...
In terms of a meta #dataviz comment, I'm not sure the stacked bars were ultimately the best way to go on this, perhaps I should have done waffles again. More discussion on that in the post.
22.04.2025 13:25 — 👍 0 🔁 0 💬 0 📌 0
stacked bar chart displaying percent of people in Denmark by educational attainment and municipal group 2008-2023
Prompt 20 | #30DayChartChallenge | urbanization
I wanted to see if more people were moving to larger urban areas & if they were more educated
The answers are yes & yes. More detail & #dataviz thoughts in the post
Data from 🇩🇰 Statistik via danstat 📦 for #rstats
www.gregdubrow.io/posts/30-day...

If you like doing #rstats & #dataviz on social science data, come to my presentation at the May 14 CopenhagenR meetup.
I'll talk about APIs & 📦s & show examples from Danmarks Statistik StatBank.
Location is PROSA offices, Vester Farimagsgade 37A in København
RSVP at www.meetup.com/copenhagenr-...