And sure, with all those arms they'll have an advantage when it comes to sending daily text messages, but will they have the charm to pull off 'cheeky'?
13.11.2025 18:56 — 👍 5 🔁 0 💬 0 📌 1

Unlocking creativity: The economic impact of engagement with arts and culture among young people | PBE
Children and young people in the UK are enduring a wellbeing crisis. Our teenagers record the lowest levels of life satisfaction in Europe, and one-in-four of our 19-year-olds has a probable mental di...
The UK’s young people have the lowest wellbeing in Europe. This comes at a huge cost, with too many children feeling persistently unhappy.
Hear from economists, educators, academics & young people on the difference arts programmes make to wellbeing, & how we measure it ⬇️
📆20 November, 4 pm online
28.10.2025 12:31 — 👍 3 🔁 3 💬 0 📌 0

Senior Research Fellow, IPPR North | IPPR
The Institute for Public Policy Research (IPPR) is an independent charity working towards a fairer, greener, and more prosperous society.
We're hiring!💥
IPPR North are looking for a senior researcher who has big ideas for the future of our regions. Join us at this pivotal time for our economy and democracy.
Based in Manchester, apply by 31st October.
www.ippr.org/jobs/senior-...
15.10.2025 11:11 — 👍 14 🔁 18 💬 0 📌 1
It's ALWAYS Finland with the data
13.10.2025 08:25 — 👍 4 🔁 0 💬 1 📌 0

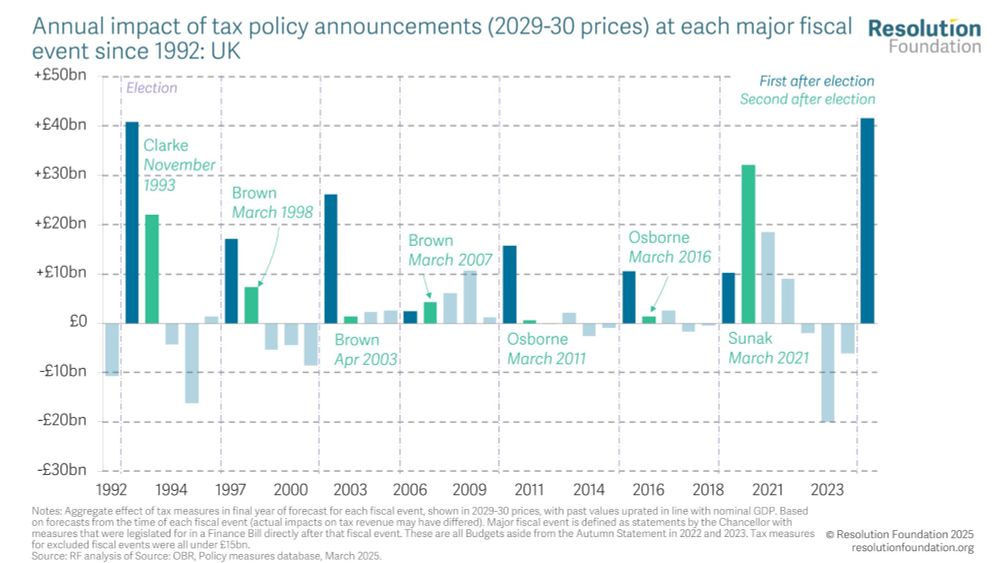
Chart shows net replacement rates in unemployment for a single homeowner with no children. Title states: "Unemployment benefits in the UK are low compared to OECD countries, and contributory benefits are no higher than means-tested benefits."
NEW: The UK social security system offers relatively little income protection after job loss.
THREAD on Martin Mikloš and @xiaoweixu.bsky.social's IFS Green Budget chapter on the options for introducing ‘unemployment insurance’:
09.10.2025 07:05 — 👍 9 🔁 7 💬 1 📌 2

Every LGBTQ+ young person deserves a safe space | PBE
Charlie* was looking for somewhere they could explore their emerging identity and feel supported as they considered socially transitioning – that is, beginning to live and be recognised in everyday li...
Free2Talk offers something vital for LGBTQ+ young people: a safe, identity-affirming space to belong.
@karol122.bsky.social and @charlotteprothero.bsky.social share Charlie’s story, and the value of the programme which could deliver £4 of wellbeing benefit for every £1 spent.
Read it here 👇
22.09.2025 08:10 — 👍 4 🔁 4 💬 0 📌 0

Prioritising wellbeing: A strategic imperative for balanced business outcomes | PBE
By Hannah Pearsall, Head of Wellbeing, Hays UK&I In today’s rapidly evolving work landscape, the question isn’t whether wellbeing should be part of corporate strategy – it’s why any forward-thinking b...
The evidence is overwhelming: prioritising wellbeing drives measurable benefits for employees, shareholders, customers, and wider society.
In her latest article for our ‘Economics to improve lives’ series, Hannah Pearsall, Head of Wellbeing at Hays UK&I says wellbeing is a business imperative.
24.09.2025 07:05 — 👍 8 🔁 4 💬 0 📌 1
I'm not sure re the recordings, so will check..
And agree re the networking. As we grow and develop the network over time we'll want to do some in person events too.
20.09.2025 11:03 — 👍 1 🔁 0 💬 1 📌 0

Wellbeing for the next generation: lessons from Sure Start and beyond | PBE
By Lord David Blunkett I was recently asked in an interview what I thought was the “good life”, which rather threw me. What is a “good life” for one person might be an absolute nightmare for another. ...
What is “the good life”?
Lord Blunkett argues it’s not just about money: dignity, purpose, community & a fair start in life all matter.
His article in the #EconToImproveLives series makes the case for investing in young people’s wellbeing, from early years to employment.
pbe.co.uk/insights/wel...
17.09.2025 08:10 — 👍 3 🔁 2 💬 0 📌 0
Yeah, the timeline can be pretty long sometimes. But if you've got the worst of the pain out of the way early on, told a good story about it all, and can point to things moving in the right direction, then the power of the incumbent means there's a decent chance the 'next' government is also you
16.09.2025 09:32 — 👍 1 🔁 0 💬 0 📌 0
Unpopular *in the short to medium term*, right? Voters might need reminding when the payoff comes, but it will come. That's why, when handed an unexpectedly large majority, a government should be rubbing its hands together and saying "oh boy, now we get to do the unpopular but good stuff"
16.09.2025 08:30 — 👍 22 🔁 1 💬 1 📌 0
📣Calling analysts working in and around the social sector. Come join the next @pbe.co.uk Social Sector Economists Network meeting and explore new work on perinatal depression and on the size of the UK’s impact economy 📣
2 October | 10:00–11:30 | Online
events.teams.microsoft.com/event/7b825d...
12.09.2025 08:15 — 👍 4 🔁 2 💬 1 📌 0

Wellbeing valuation workshop request | PBE
If you are interested in attending the workshop, please complete the form below. We will get in touch after reviewing your request to let you know if we can help.
Online training for analysts on using HM Treasury’s wellbeing guidance
In partnership with State of Life and LSE, the workshop will give you the tools to use wellbeing measurement in business cases, appraisals and evaluations.
4.5 hour workshops across 21 & 23 Oct
Apply to attend👇
10.09.2025 14:03 — 👍 1 🔁 2 💬 0 📌 0
I wonder if that bee has ever encountered a larger comedian
(In the physical sense, that is. The odds are firmly against it having met one with a bigger presence).
08.09.2025 12:37 — 👍 1 🔁 0 💬 0 📌 0
Typically thoughtful - and thought provoking - stuff from @dianecoyle1859.bsky.social on the urgent need to understand how AI disruption is playing out across society (for better and worse) and then respond accordingly. Another great contribution to the @pbe.co.uk 'Economics to improve lives' series
08.09.2025 10:09 — 👍 14 🔁 5 💬 0 📌 0

Economic progress in the age of AI | PBE
By Diane Coyle If you spend less than four hours and 20 minutes a day online, you are below average for the UK. Using apps and online services, many of them free, is part of the fabric of daily life…
"Without suitable measures of organisations’ adoption of AI, policymakers will be unable to shape this powerful technology in ways that benefit society as a whole." - @dianecoyle1859.bsky.social's in her new article for #EconToImproveLives
pbe.co.uk/insights/eco...
08.09.2025 08:23 — 👍 2 🔁 2 💬 0 📌 2
The brilliant 808 State tonight
06.09.2025 00:31 — 👍 0 🔁 0 💬 0 📌 0

Here's a slightly crazy diagram illustrating today's major Cabinet reshuffle
You're welcome
05.09.2025 16:47 — 👍 143 🔁 51 💬 17 📌 6
"Powerpoint Plant" was right there
04.09.2025 15:44 — 👍 1 🔁 0 💬 0 📌 0
Throw in access to the swimming pool and regular ice cream drops from Jack and it starts to sound positively utopian
04.09.2025 10:48 — 👍 1 🔁 0 💬 1 📌 0

Scrap two-child benefit cap to help lift 4m people out of poverty, government urged
Exclusive: Cross-party Poverty Strategy Commission says abolishing limit would be part of its ‘once in a generation’ plan
Out tomorrow: our expert, cross-party Poverty Strategy Commission report. We propose a new social contract & plan to lift 4.2 million people out of poverty, incl 2.2 million stranded in deep poverty. Thanks @patrickjbutler.bsky.social for the insightful write up www.theguardian.com/society/2025...
04.09.2025 08:47 — 👍 21 🔁 15 💬 1 📌 1
Funnily enough, after you'd left Sue said something along the lines of "can we keep him?" which, taken out of context, is pretty kidnappy
04.09.2025 10:14 — 👍 2 🔁 0 💬 1 📌 0


Fascinating paper exploring the economic impact of populist leaders coming to power. Lots in here but two key things for me:
1. Over 15 years GDP/capita decreases by 10%; with
2. No discernible change to inequality over same period.
Paper: iacmr.org/wp-content/u...
HT @justinwolfers.bsky.social
27.08.2025 07:45 — 👍 20 🔁 15 💬 3 📌 2
Have fun everyone! Looking forward to see what you do with our data! Big shout to @jamesdgriffiths.bsky.social and Stuart Perrett for all of their great work on this too!
01.09.2025 09:27 — 👍 14 🔁 3 💬 1 📌 0
Democracy Action Network is a citizen-led organization protecting American democracy through collective action.
https://democracyactionnetwork.com/
https://secure.everyaction.com/LBU7km7T7kaMbUnC9XqpUw2
https://democracyactionnetwork.substack.com/
Director of Welfare grants at the Nuffield Foundation. Views are personal.
Exec Director @ukevaluation.bsky.social Evidence based decision-making and action. V pro #NetZero and #renewables. Chief of Staff to two Lurchers. Love Cymru, where I'm lucky to live. Pessimistic about the world, but hoping hope does spring eternal!
Director of Policy Solutions WWF UK, into economics, trade, innovation and environment policy, opinions my own.
Bit of my heart always in Germany, Derbyshire, Scotland, Canada, East of England, Trinidad, Jamaica and on a rugby pitch. Now in London.
Living life one adventure at a time
📍Los angeles, California
📍Project Europa/Middle East
@BioTech
Our mission—unchanged since 1913—is to promote the well-being of humanity throughout the world by #MakingOpportunityUniversal and sustainable.
Supporting research to transform life, health and wellbeing. We’re taking on three urgent health challenges: mental health, climate change & infectious disease.
The Royal Society is a Fellowship of many of the world's most eminent scientists and is the oldest scientific academy in continuous existence.
National Institute for Health and Care Research - we fund, enable and deliver world-leading health and social care research that improves people's health and wellbeing, and promotes economic growth.
Impact, Innovation, Investment, Inclusion
European Research Council, set up by the EU, funds top researchers of any nationality, helping them pursue great ideas at the frontiers of knowledge. #HorizonEU
The UK’s largest public funder of research
#FundedByYou
Also autoposting to @news.ukri.org, @funding.ukri.org, @blogs.ukri.org and @events.ukri.org. Topic specific feeds coming soon!
Demography nerd at Pew Research Center
Global religious change, sociology
Tea, scones, independent institutions and why they need looking after. Director of Communications @NationalTrust.bsky.social Trustee, City of Birmingham Symphony Orchestra. The posts are just mine.
We are the UK's national academy of academics, learned societies & practitioners in social science & the founder of the Campaign for Social Science. We exist to promote social sciences in the UK for public benefit: www.acss.org.uk
Visiting Fellow Global Systems Institute, Visiting Professor LIBF, Board Advisor, Project Syndicate columnist - looking for more from economics and SWFC. http://markcliffe.com WAWAW (views are mine)
News and analysis with a global perspective. We’re here to help you understand the world around you. Subscribe here: https://econ.st/4fAeu4q
Reforming the state to renew the nation.
To stay updated, join our mailing list: https://futuregovernanceforum.co.uk/contact/
Deputy Mayor of London for Housing • Former London Assembly Member • Former Lewisham councillor • Geriatric Millennial
Deputy ed at Inside Housing
 26.11.2025 13:16 — 👍 6 🔁 0 💬 1 📌 0