Data Visualisation Gallery
Gallery of data visualisations created by Nicola Rennie.
One of the things that has been on my to do list for a very long time, is building a gallery of all of the charts I've made across #TidyTuesday, #30DayChartChallenge, #30DayMapChallenge, and other miscellaneous projects 📊
And it's finally here!
Link: nrennie.rbind.io/viz-gallery/
#DataViz #RStats
26.11.2025 13:32 — 👍 110 🔁 19 💬 6 📌 3
"The difference between the groups is 1.1-2.6 measured using something that is a bit like the median but not quite the median" 😉
21.11.2025 15:21 — 👍 3 🔁 0 💬 0 📌 0
They test different hypotheses though, so the Wilcoxon test isn't a like-for-like replacement for the t-test. A bootstrap t-test is my go-to method for tests about means (using {boot.pval}). It has the added benefit of providing confidence intervals, unlike the Wilcoxon test.
21.11.2025 13:39 — 👍 3 🔁 0 💬 1 📌 0
Students often ask: “Is this model good enough?”
My reply: “For what?” AUC, precision, F1—none of them matter unless you know what decision you're informing. Always tie metrics to action.
#DataScience #MachineLearning #AI #RStats
20.11.2025 00:57 — 👍 7 🔁 2 💬 0 📌 0
It's great to use with pipes! Then everything goes from left to right.
19.11.2025 12:56 — 👍 1 🔁 0 💬 0 📌 0
Very interesting - thanks for sharing!
18.11.2025 09:45 — 👍 1 🔁 0 💬 0 📌 0
I remember seeing a github repo for this a while ago. Might have been this one, but I'm not sure: github.com/AllanCameron...
10.11.2025 13:54 — 👍 2 🔁 0 💬 1 📌 0
If you use git a lot, use Python, or need AI assistants: yes. Otherwise: no, stick with RStudio - it's still great at what it does and keeps getting better.
04.11.2025 07:29 — 👍 1 🔁 0 💬 0 📌 0
Looks really interesting! I might use this as a case study when I teach statistics for biologist next year.
25.10.2025 06:36 — 👍 1 🔁 0 💬 1 📌 0
Thanks Daniel! Very happy to hear it!
24.10.2025 07:09 — 👍 0 🔁 0 💬 0 📌 0
It's the variance of the _estimator_ that matters. This is still true if you estimate higher moments like skewness and kurtosis. The variance of those estimators will be related to the sixth and eight moments of the measurements, but it's still a variance.
24.10.2025 06:12 — 👍 3 🔁 0 💬 2 📌 0
strsplit("this/is/my/path", "/")[[1]]
23.10.2025 07:36 — 👍 2 🔁 0 💬 1 📌 0
Not until all countries adopt the YYYY-MM-DD date standard!
20.10.2025 06:17 — 👍 5 🔁 0 💬 0 📌 0
It should still be using right censoring I think! The survival package is extremely powerful, but the documentation isn't always easy to follow. I've sometimes compared the results to manual calculations in toy examples just to make sure that it was using the model I thought it was.
15.10.2025 06:52 — 👍 1 🔁 0 💬 1 📌 0
The issue could be that for data with consecutive time periods, Surv expects three variables: start time, stop time, event indicator. So Surv(Days_Lag, Days, SurvivalDepressionTotal_Diff) in your case. You may need to remove the rows where Days_Lag is NA as well.
14.10.2025 15:40 — 👍 1 🔁 0 💬 1 📌 1
Depends on what your data looks like. Do you have consecutive time periods for each individual?
14.10.2025 13:02 — 👍 0 🔁 0 💬 1 📌 0
The number of records is much larger than the number of individuals (n), which seems to indicate that you have multiple rows per individual in your dataset. But it's not because of time-varying covariates or multiple events? You're doing something beyond a standard Cox regression, surely? :)
14.10.2025 11:41 — 👍 0 🔁 0 💬 1 📌 0
What model are you using? This looks like the output from a Cox regression with time-varying covariates. Correct? Can patients have more than one event?
14.10.2025 06:33 — 👍 0 🔁 0 💬 1 📌 0
Chernoff faces for penguins. 🐧 This made my day.
13.10.2025 11:10 — 👍 1 🔁 0 💬 0 📌 0

A short tutorial on how to create gt cross-tables in one line of code using the #Rstats package ivo.table:
mansthulin.se/posts/ivotab...
09.10.2025 09:17 — 👍 5 🔁 1 💬 0 📌 0
Happy to hear this. Positron certainly has its merits, but I think RStudio is a much better choice for the quiet majority who use #Rstats for statistical analyses rather than software engineering.
09.10.2025 06:28 — 👍 7 🔁 0 💬 0 📌 0
Yes! Right assignment with pipes *chef's kiss*
25.09.2025 06:28 — 👍 1 🔁 0 💬 0 📌 0
This is a great update! I really like how colour palettes are now part of themes and the ink and paper feature in themes.
11.09.2025 11:50 — 👍 1 🔁 0 💬 0 📌 0
{tinytable} 0.13.0 for #RStats can now draw interactive tables with sorting, filtering & pages!
And the 📦 is still an ultra-simple, powerful, and 0-dep way to create beautiful tables in basically any format: tex, typ, docx, pdf, png, md, etc
Gallery & Docs: vincentarelbundock.github.io/tinytable/
19.08.2025 21:24 — 👍 145 🔁 39 💬 6 📌 1
#rstats #statistics
I've released my new open source book, "Powered by Linear Algebra: the role of matrices and vector space in data science," at matloff.github.io/WackyLinearA....
Turns the classic LA course on its head! Still proves the theorems, but with a deep emphasis on applications.
15.08.2025 16:53 — 👍 83 🔁 23 💬 8 📌 5
Highly recommended! It solves the problems you're having and speeds up the installation of new packages.
14.08.2025 08:11 — 👍 2 🔁 0 💬 0 📌 0

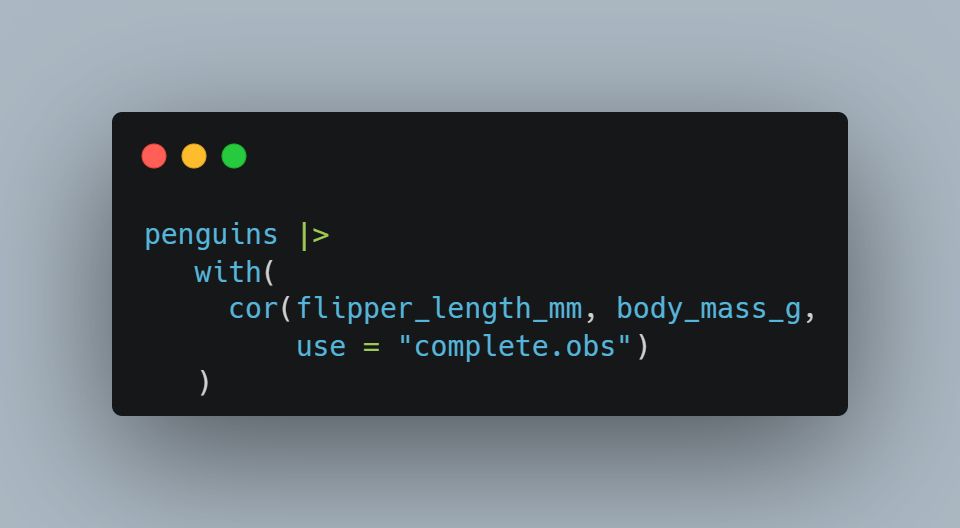
Wow ... I'd never come across this use of with(), which allows combining the pipe and computing a correlation coefficient. Thanks to @mansthulin.bsky.social for explaining this in his fantastic book www.modernstatisticswithr.com!
#Rstats #code #neverknew
22.07.2025 12:22 — 👍 5 🔁 1 💬 0 📌 0
Modern Statistics with R
Modern Statistics with R
I'm extremely biased, but I think Modern Statistics with R is a great choice 😁
www.modernstatisticswithr.com
04.07.2025 20:37 — 👍 6 🔁 1 💬 1 📌 0
Data science 🔭 R 🖥️ education 🎓 industry 🏭 #rstats #Quarto
Computational biologist, data scientist, digital artist | he, him | http://clauswilke.com/ | Opinions are my own and do not represent UT Austin.
Biostatistician @IDEXX formerly at harvardmed, @BIDMChealth, @nasa. Big data, clinical trials, and medical diagnostics. Mainer. Opinions are my own. he/him
Clinical research methodology, placebo, blinding
Data engineer @ countercurrent.ai, former #climatehealth 🌡️ + #datajournalism 🗺️
Building, coding and storytelling with #rstats, #js and #swift for fun and for good 😊
Statistician, Computational Biologist, R |> Bioconductor
https://www.huber.embl.de
Textbook: Modern Statistics for Modern Biology https://www.huber.embl.de/msmb/ (with @sherlockpholmes.bsky.social)
Professor of Statistics at Stockholm University.
25+ years of Bayes and still excited.
Big fan of Julialang, Observable and Linux.
🇮🇹+🇸🇪
The human who says "Thank you!" when you file a feature request or bug for the RStudio IDE. Also a QA engineer at Posit.
@Genentech; Formally @MSKCancerCenter; #rstats pkg dev; http://github.com/ddsjoberg Golden Girls Superfan 🏳️🌈
Research Data Management Consultant | cghlewis.com
Co-organizer @r-ladies-stl.bsky.social
Co-organizer POWER Data Management Hub | https://osf.io/ap3tk/
Author of DMLSER: https://datamgmtinedresearch.com/
RDM Weekly: https://rdmweekly.substack.com/
Run by the R Contribution Working Group: fostering a larger, more diverse community of contributors to #RStats development. #RForwards #RLadies […]
[bridged from https://hachyderm.io/@R_Contributors on the fediverse by https://fed.brid.gy/ ]
Assessing Psychological Constructs Using NLP and Machine Learning
Developer of R-packages: #r-text, #r-topics and #r-talk
Precision Mental health
Well-being and Harmony Research
Based at Lund University and Stony Brook University
Dataviz designer, psychiatrist, PhD student
https://karaman.is
Research Software Engineering Fellow in Statistics, University of Warwick, UK @R_Foundation board member #RStats #RSEng #RLadies
[bridged from https://fosstodon.org/@HeathrTurnr on the fediverse by https://fed.brid.gy/ ]
📊 Data visualisation specialist.
💻 #RStats | #Python | #D3.
🎨 Generative artist.
🏃♀️ Runner.
Website: https://nrennie.rbind.io/
She/her. Views my own.
Data Scientist for Chesterfield Co Public Schools. Interested in education, data science, reading & writing, CrossFit, baking, and good dogs.
ericekholm.com
Cal Poly Statistics student interested in statistical computing/learning and its applications. Especially interested in R, Julia, Stochastics, and Bayesian methods.
visruth.com
Data science (AKA statistics). Likes conditioning on the data (AKA Bayes). Blog at https://www.sumsar.net. Works at http://Normative.io.
Statistician,Mother,Prof,Grandmother(she/her)🇫🇷🇵🇹🇺🇸🧪.
🖋️with @wkhuber.bsky.social:Modern Statistics for Modern Biology (https://www.huber.embl.de/msmb/) #stats,#rstats.OSS,arXiv, microbial ecology,cytof,multi-omics,Bioconductor:phyloseq, DADA2
Software Engineer at Posit PBC.
I mostly post about R, Python, and Deep Learning.
Github: https://github.com/t-kalinowski


