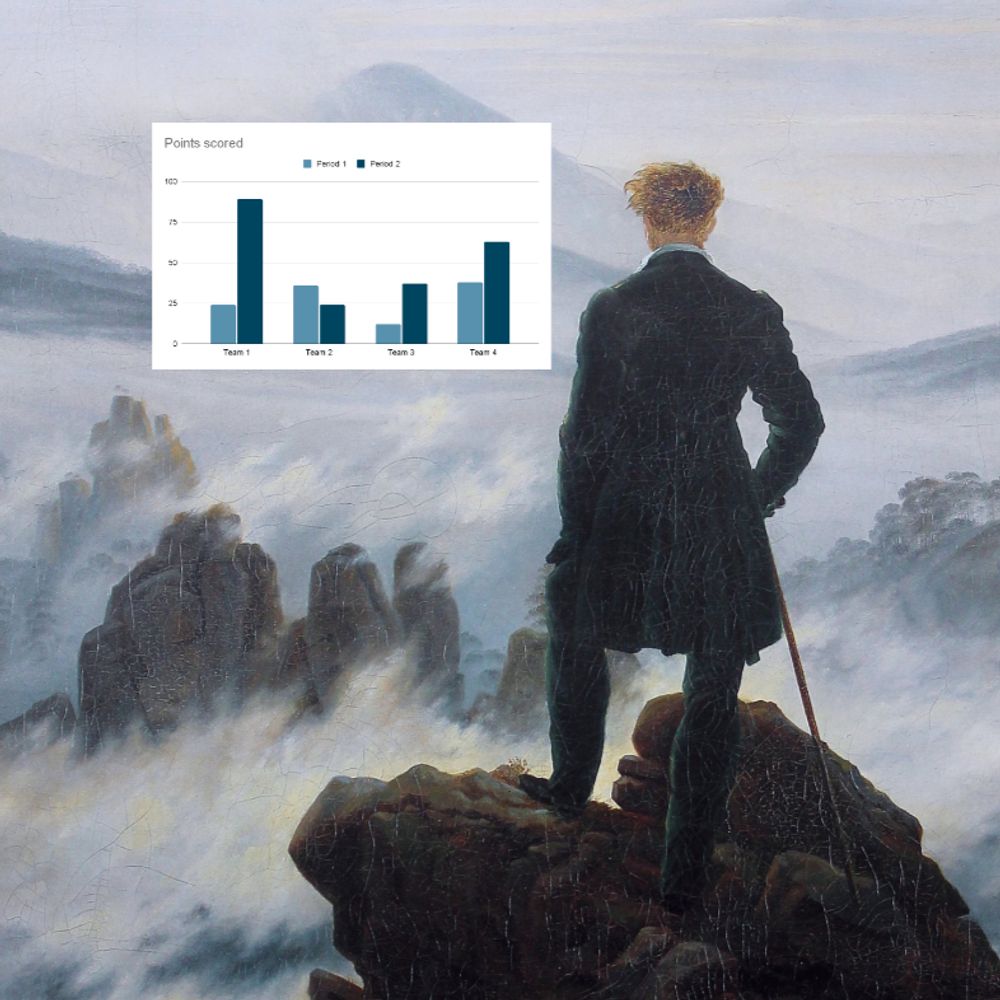
With being pregnant comes.. great opportunities for visualizations! 🤰This column chart captures the excitement of our family, friends, and colleagues as they place their bets on whether the tiniest VIP will be a boy or a girl!
Check it out: shorturl.at/7veK1
#DataFam #Tableau
28.11.2025 12:05 — 👍 1 🔁 0 💬 0 📌 0

#datafam It has been a long time since I posted something but I'm back! For our own internal #ironviz competition I used the #MakeoverMonday dataset to visualize what % of Britons think kidult hobbies and practices are for children.
Check it out: shorturl.at/G5cfu!
25.11.2025 09:58 — 👍 1 🔁 0 💬 0 📌 0

In 2025, this puppy will be ours 😍🥹 meet Dobby, our house corgi ♥️
24.12.2024 19:53 — 👍 0 🔁 0 💬 0 📌 0
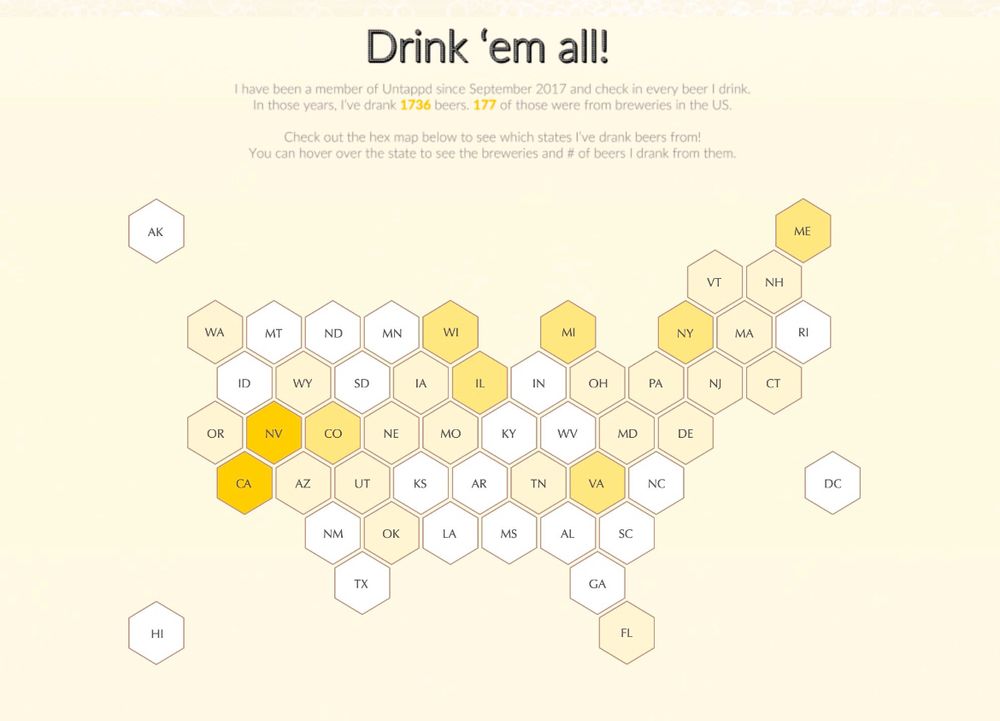
We've done another Iron Viz competition at #SopraSteria! 🤩 l participated in my two favorite categories: Most Creative Visual & Best Dashboard Design.
I'm pleased to say that I won with my hexagon map in the Most Creative Visual category! 🏆 Check it out here: shorturl.at/yku4Y
#Datafam #Tableau
11.12.2024 18:23 — 👍 0 🔁 0 💬 0 📌 0
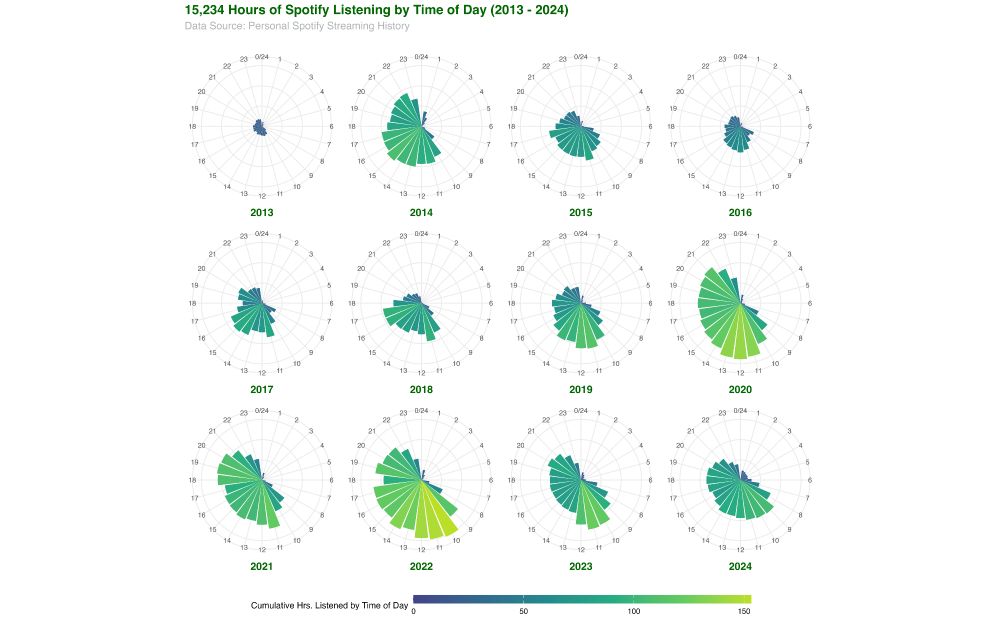
Knowing Spotify Wrapped was imminent I spent a bit of the thanksgiving down time tinkering with my historical listening data.
Maybe i should have bought better headphones on black friday given the amount of time i use this app.
#Spotify #Wrapped #RStats #DataViz #ggplot2 #spotifywrapped
05.12.2024 13:02 — 👍 4 🔁 2 💬 0 📌 0
Hero image for Chart Chat 56, The Top Ten Charts on TV, featurinig Donna Strok from IMdB.
You know when you watch a TV show and see a chart? 📊 And you think "Hmm, that's amazing (or awful) #dataviz"?
If that's you: we're running through our Top Ten TV Charts in #ChartChat LIVE on December 12, with guest Donna Strok from IMdB.
Register here: buytickets.at/datarevelati...
05.12.2024 10:28 — 👍 4 🔁 1 💬 0 📌 0
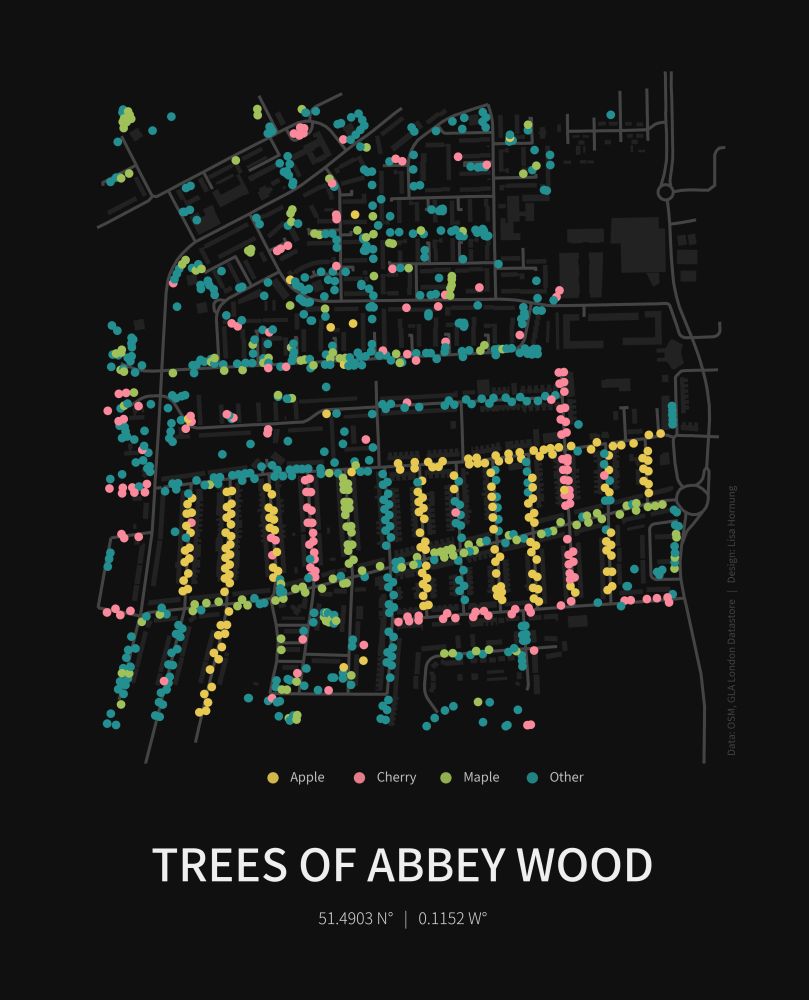
Map of Abbey Wood, London showing a dark basemap highlighting streets and buildings. Overlayed with points of four different colours to display council maintained trees distinguishing Apple, Cherry, Maple and Other
I recently moved house, so I didn’t have time for #30DayMapChallenge. Now that I’m getting settled, I want to start exploring my new area and get back to mapping. Here's belated Day 1 Points with council maintained trees in Abbey Wood, London. 🌳 🗺️
Made in #python, code: github.com/Lisa-Ho/30-d...
03.12.2024 15:04 — 👍 30 🔁 5 💬 2 📌 0
YouTube video by Louis Yu
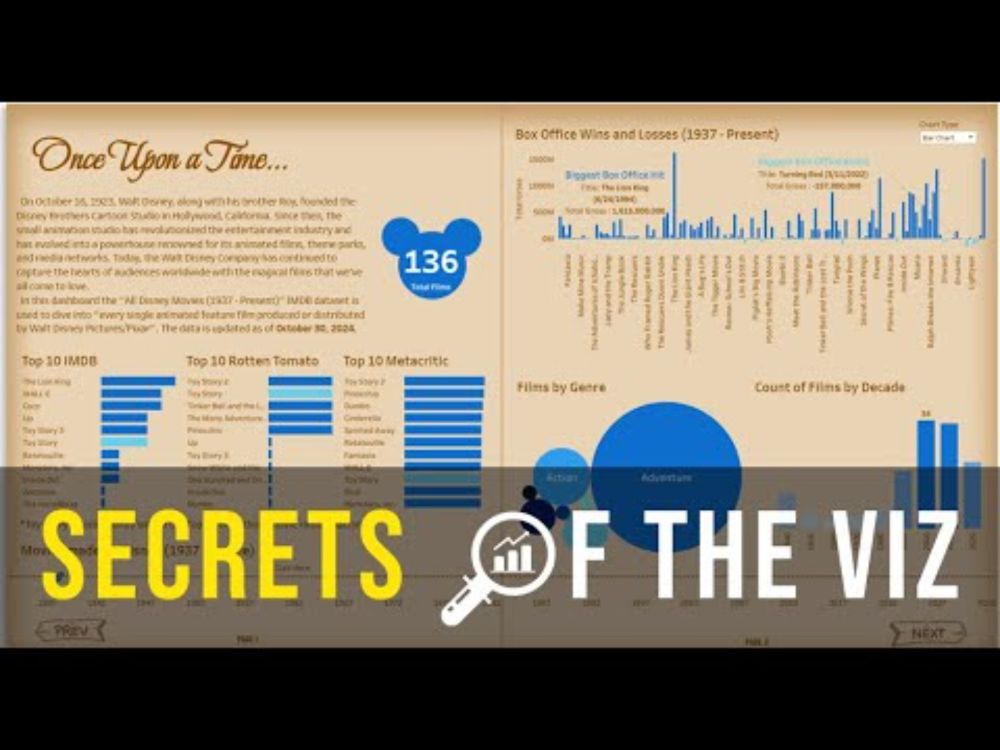
Secrets of the Viz: The Evolution of Disney Animated Movies
Do you love your #disney 🐭 films? So does Priscilla Siow! Join us in this episode of #SecretsOfTheViz, where she shares her learning journey from Tableau Conference to her first #VizOfTheDay and #IronViz entry 📊. It's so inspiring to see #datafam thrive!
youtu.be/58wQcZZ_jlo
03.12.2024 15:50 — 👍 5 🔁 1 💬 0 📌 0
I had such a great time talking with Louis Yu about my #ironviz entry on #SecretsOfTheViz this week! Go give it a watch, and thanks so much to Louis for having me on the show! #datafam #dataviz #tableau
03.12.2024 01:13 — 👍 9 🔁 2 💬 2 📌 0
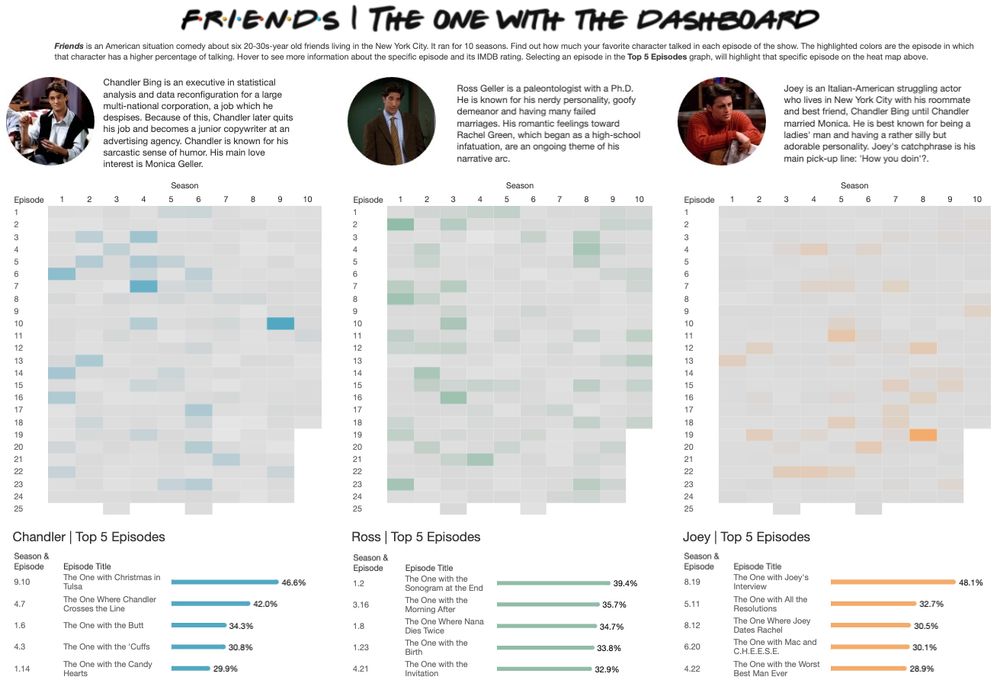
🚨 Hi Data Fam! Feel like I haven't vizzed in forever, so I'm excited to share a new dashboard about the speaking time of the 6 main characters on the TV show Friends!
📊 Check out the viz on Tableau Public: public.tableau.com/app/profile/...
26.11.2024 12:08 — 👍 9 🔁 2 💬 0 📌 0
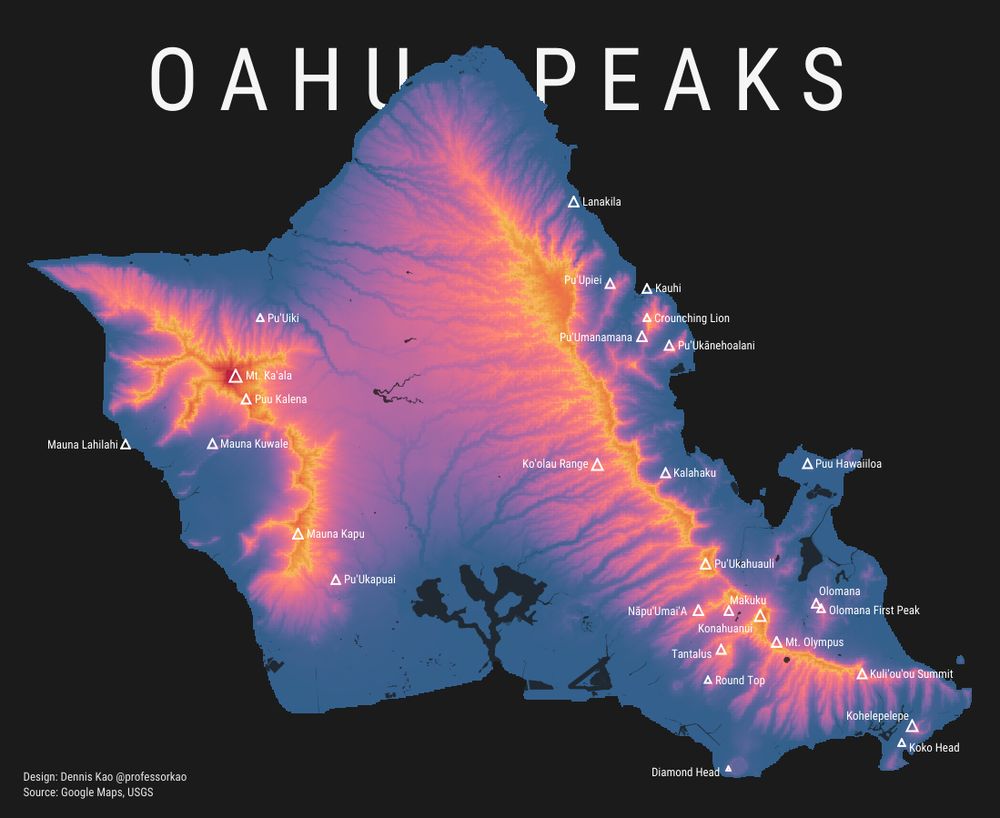
My wife & daughter will be going to Hawaii early Jan, but I can't go...😢
So I'm planning to live vicariously through creating a few maps😅
Here's the 1st map, featuring the elevation & mountain peaks of Oahu...
Link: tabsoft.co/4fG9U4F
Feedback always appreciated!🙏
25.11.2024 14:59 — 👍 15 🔁 1 💬 2 📌 1
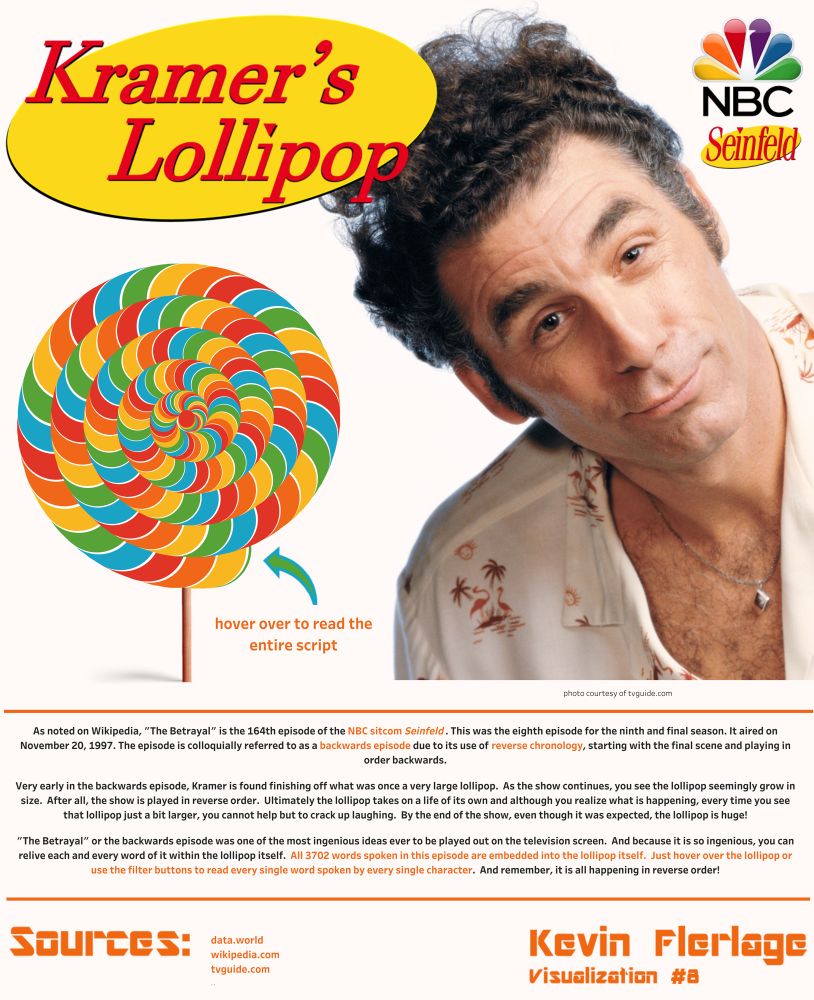
Kramer’s Lollipop! In the famous backward episode of Seinfeld, Kramers lollipop starts off completely eaten and at the end its full size. Go to the link in the notes then hover over each segment of the lollipop to read the entire script of this episode. Link: public.tableau.com/app/profile/...
22.11.2024 14:57 — 👍 6 🔁 2 💬 0 📌 0
It usually could have been a pivot table.
Professional chart stalker turned amateur data artist. Here for the viz vibe 📊
I’m CTO at the International Consortium of Investigative Journalists (@icij.org) where I build interactive stories, data driven investigations and tools.
#PandoraPapers #UberFiles #FinCENFiles #LuandaLeaks and many more.
environmental reporter for NJ.com and @starledger.bsky.social. Born/raised/reside in Jersey City, NJ. Syracuse University alum.
https://www.nj.com/user/srodas/posts.html
Tableau Ambassador | #dataviz 👉 politics, sport, Aussie social issues | #VizforSocialGood Executive Director | Brisbane TUG Leader | #datafam
Information Visualisation 📊📉✍🏼 and Climate @ University of Twente
Core projects:
The Languages of Visualization, with Clive Richards
UT Climate Centre @utclimate.bsky.social
LinkedIn: https://linkedin.com/in/yuriengelhardt
Mastodon: https://vis.social/@yuri
Author: What We Ask Google, May 2026. Data storyteller @Google. Was @Twitter @Guardian. Co-host with Alberto Cairo & Scott Klein of http://datajournalismpodcast.com
Loves data, design and dataviz 📊 🎨
Old-skool Gamer 🕹👾
Proud to play with Lego ✌
Interested in AI 🤖, news and (geo)politics 🌍
Post mostly in Dutch, sometimes in English
# 867.376
Graphics Editor at The New York Times 🇺🇸| former Reuters 🇸🇬 | South China Morning Post 🇭🇰 | La Nacion 🇨🇷
Solopreneur @ IndieVisual
Data geek who loves problem solving
Rambles about fitness & random stuff too
https://indievisual.tech
Data viz at Reuters Graphics
http://samhart.co
👨🏽💻 Head of Football Insights @ City Football Group • 📊 @Tableau Visionary • Formerly: @infolabUK @DataSchoolUK - #DS1 • ⚽️ #ITFC • he/him
Lurking on #dataviz #datafluency #sportsanalytics
Data Analytics & Visualisation | Tableau Ambassador ‘24 | Tableau Public Featured Author ‘23 | 5x VOTD | R | Long-suffering Spurs fan
3x #Tableau Public Ambassador | 5x #VizOfTheDay | 4x #Vizzie Winner | BI Senior Manager | #publicTUG co-lead | #GamesNightViz
https://public.tableau.com/app/profile/ant.pulley/
http://consult-ant.uk
Data Visualiser for the NHS | Co-lead UK Healthcare Tableau User Group | 2024 Tableau Ambassador
data viz nerd | lover of 📚 and libraries | 🏳️🌈 she/her
Data Analyst at The information Lab
Tableau, SQL, Python, R, PBI, Alteryx and more
BI Dev👾 #DataViz+#AI,#ML,#DL #VizLib #QlikSense #Qlik #Tableau #D3js #ScikitLearn #ANN #AIEthics #EthicalAI ✊🏾🏳️🌈🏳️⚧️ #HeForShe #NoHijabDay #UBI #SDGs