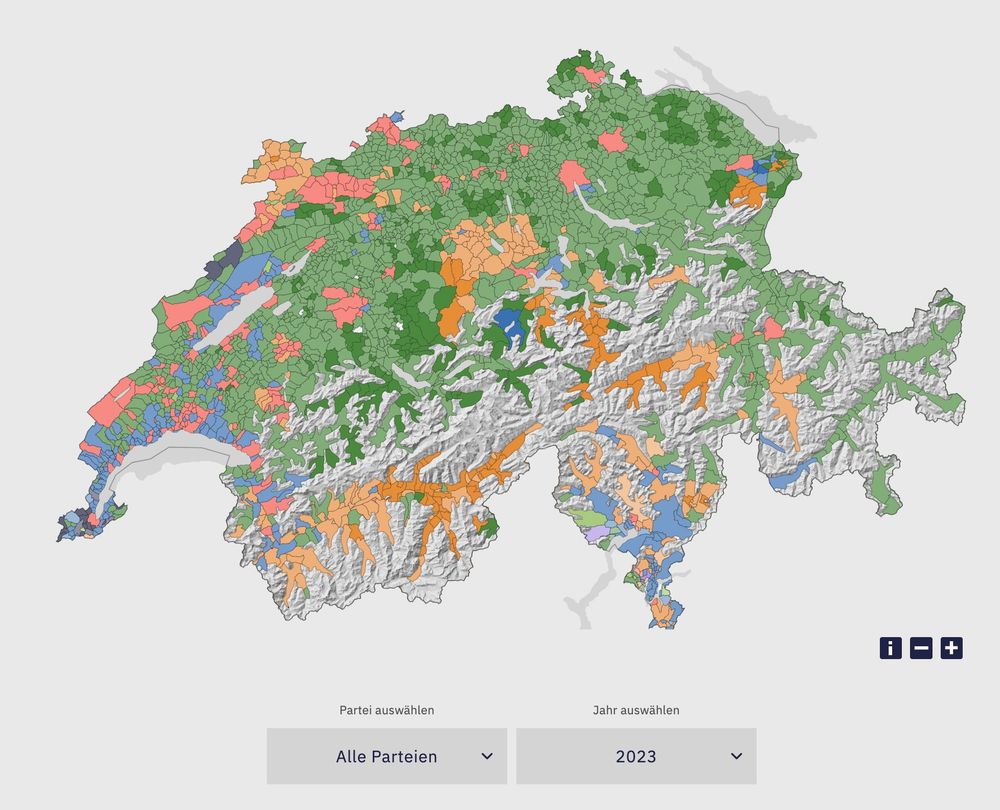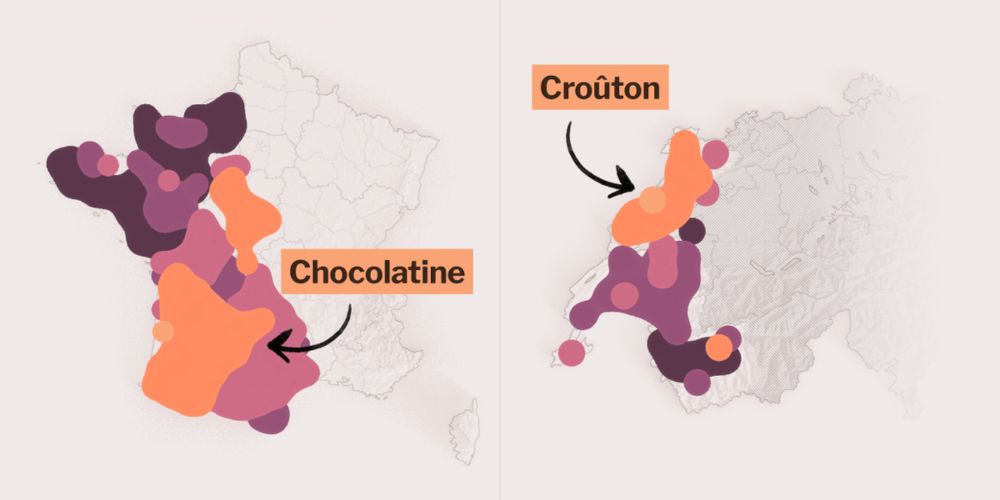
Ce test vous dit d’où vous venez en France, Suisse ou Belgique
Notre test trouve où vous avez grandi et vous situe sur une carte en Suisse, en France ou en Belgique. Faites le test!
Faites le test! Parlez, et nous vous dirons d’où vous êtes ! Notre test de la francophonie vous situe sur une carte et trouve où vous avez grandi en Suisse, en France ou en Belgique. Prêt à jouer ? www.24heures.ch/france-suiss...
07.02.2025 08:54 — 👍 216 🔁 85 💬 131 📌 228
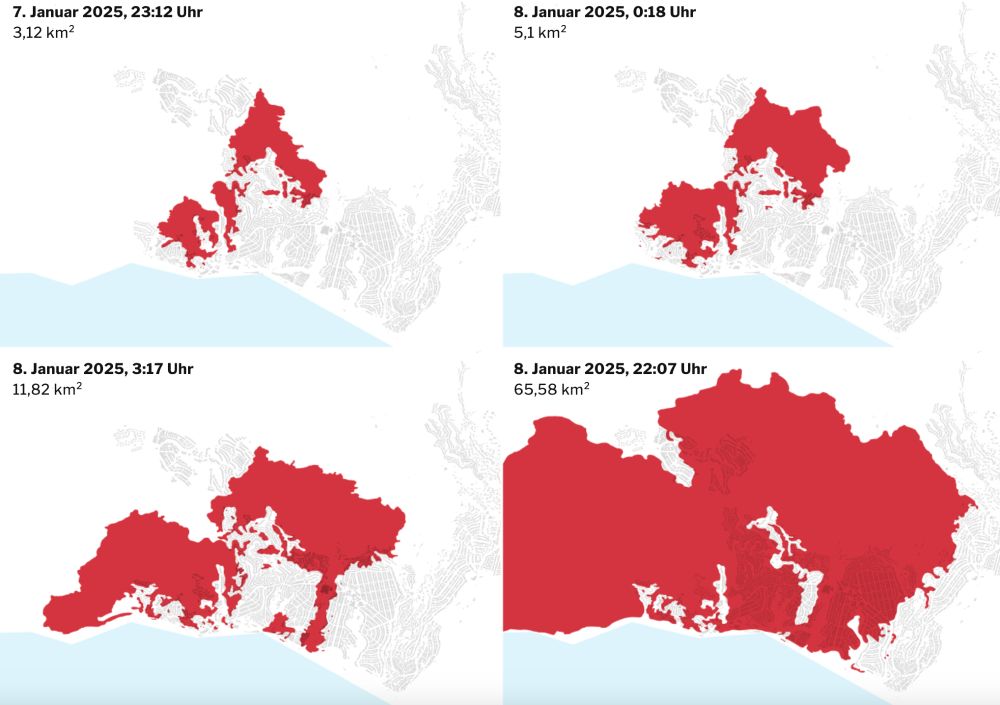
Die Flammenhölle von Los Angeles 🔥 Karten, Satellitenbilder und Videos zeigen das verheerende Ausmass der Brände – hier geht es zu unserer aktuellen visuellen Übersicht
👇
www.tagesanzeiger.ch/feuer-in-los... (Abo) @tagesanzeiger.bsky.social @seebaa.bsky.social @mathiaslutz.bsky.social
09.01.2025 18:10 — 👍 1 🔁 1 💬 0 📌 0
zusammen mit @marcbrup.bsky.social
23.10.2023 10:53 — 👍 0 🔁 0 💬 0 📌 0
@data.ft.com Senior Visual Journalist. Mad about cartography, dataviz and F1! Check out my QGIS youtube channel at http://bit.ly/1MAR2Po
Follow me on Instagram
@stevendbernard
Maps + Design
🌎 https://jonathancritchley.ca
Playing with data, visualizing it for humans at flowingdata.com
Graphics Editor at The New York Times 🇺🇸| former Reuters 🇸🇬 | South China Morning Post 🇭🇰 | La Nacion 🇨🇷
We are a data visualization and cartography studio with over 20 years of experience helping people find and tell more beautiful stories with data. Learn more at stamen.com
Mastodon: vis.social/@stamen
The Pudding is a digital publication that explains ideas debated in culture with visual essays. https://pudding.cool/
Email: sup@pudding.cool
Support us: http://patreon.com/thepudding
Data artist and designer
https://www.c82.net
Creating & writing about data vis for @datawrapper.de
Author: What We Ask Google, May 2026. Data storyteller @Google. Was @Twitter @Guardian. Co-host with Alberto Cairo & Scott Klein of http://datajournalismpodcast.com
Crafting data experiences at http://truth-and-beauty.net
| Husband & dad^3
| head data & visualizations at @spiegel.de
| #Svelte and #D3
| biochemistry & computational biology PhD
| 🇸🇪🇩🇪🇪🇺
| https://spiegel.de/duv
| https://higsch.com
🧙♂️✨📊
Independent Data Visualization Designer, Consultant & Instructor | available for projects and workshops
All things data & design with #rstats, #ggplot2, #Figma, #DataWrapper, #Flourish, and more
Co-Founder of the #30DayChartChallenge
Graphics editor at Scientific American • Author of Building Science Graphics https://www.buildingsciencegraphics.com/ • Formerly at National Geographic
Data visualization designer
krisztinaszucs.com
Visual journalist who works for The New York Times as a visual editor, based in Seoul. He specializes in information graphics and data visualization for international coverage. Past SCMP, Bloomberg in HK https://www.nytimes.com/by/pablo-robles
New Game Pick/Zozoulindies/Interview every Wednesday. Extras on Saturdays. Home of Into the Indies
Run by zaratoth.bsky.social and Zozoulini
https://linktr.ee/indiegamepicks
Showcase & Magazin für Indiegames - Spezialisiert auf handverlesene Previews!
📰 Web: http://www.indiegames-inside.de
⭐ Steam Curator: http://bit.ly/2JYywsz
💛 Support us: https://ko-fi.com/indiegames
The painfully relatable comic about gamedev.
✨ Website ✨ http://devteamlife.com
💛 Shop 💛 http://devteamshop.com
➡️The Book➡️ https://www.studiolounak.com/lounak-shop/lounak-books
Journalistin | schreibt für Sonntagsblick, vorher Tagesanzeiger und Landbote | Threema: MH7R5D32 | http://blick.ch
Reporter. Ressortleiter Politik & Wirtschaft @tagesanzeiger


