Wanted to look at the review history of a JEB paper from a mere two years ago - but hosted on publons so gone forever?
07.10.2025 17:14 — 👍 0 🔁 0 💬 0 📌 0
Thanks Andrew!
09.09.2025 21:52 — 👍 0 🔁 0 💬 0 📌 0
While we all share our sequencing data freely, image datasets like these are still often kept private.
I am only aware of a single other study on guppy coloration (there are many!) where images are available, and it's also from our lab (Morris et al. 2020).
I hope this can improve in the future!
09.09.2025 21:42 — 👍 3 🔁 0 💬 0 📌 0
Our paper on the genetics of guppy color patterns has now been assigned an issue in NEE: doi.org/10.1038/s415...
With this paper, we also publish all 14,100 guppy photos used in the study, including before and after alignment and ornament extraction:
doi.org/10.20383/103...
09.09.2025 21:42 — 👍 56 🔁 12 💬 4 📌 1
Now published @natecoevo.nature.com with @annika-nichols.bsky.social, our latest on the evolution of 𝘴𝘭𝘦𝘦𝘱 across 𝟲𝟬 𝘀𝗽𝗲𝗰𝗶𝗲𝘀 of cichlid fishes! doi.org/10.1038/s415...
with members of the @schierlab.bsky.social and Salzburger labs, as well as the burgeoning Shafer lab @uoftcellsysbiol.bsky.social
28.08.2025 14:17 — 👍 76 🔁 39 💬 1 📌 2

Editorial: Accountability, voice, and trust - responsible use of GenAI in scientific publishing
Over the last few years, the development and rapid advancement of Generative Artificial Intelligence (GenAI) and Large Language Models (LLMs) such as ChatG
Many of us are using LLMs in coding and scientific writing. They are very helpful tools, but we need to be thoughtful as we integrate them into our work flows to preserve accountability, voice and trust. academic.oup.com/evlett/advan.... An editorial at @evolletters.bsky.social for discussion:
22.08.2025 12:52 — 👍 69 🔁 33 💬 2 📌 3
Yes I personally prefer to use “deep learning” over “AI”. Not much use for LLMs for now (but perhaps for eg meta-analyses in a couple of years?), but transformer architecture may still hold a lot of promise for sequence data.. Time will tell.
22.08.2025 06:51 — 👍 2 🔁 0 💬 0 📌 0
And yes, we used unets for segmentation.
22.08.2025 05:57 — 👍 2 🔁 0 💬 1 📌 0

ESEB Day 3! Molecular clocks & identifying ghost lineages; marrying micro & macro evolution; female polymorphism; balancing selection in round-nose grenadier; the genetics of guppy colour polymorphisms; modelling genetic interactions; antagonist selection in flying ants
#eseb2025 #eseb #sciart
20.08.2025 10:36 — 👍 17 🔁 3 💬 0 📌 0
Just in time for her #eseb2025 poster on Thursday, @squarehare.bsky.social 's paper on the Poecilia bifurca sex chromosomes was published today academic.oup.com/g3journal/ad...
20.08.2025 18:42 — 👍 25 🔁 7 💬 0 📌 0
I hate conference apps with a passion.
19.08.2025 10:02 — 👍 2 🔁 0 💬 0 📌 0
This website seems odd, it assumes MEPs will vote along country blocks, not European or individual parties?
15.08.2025 19:27 — 👍 0 🔁 0 💬 2 📌 0
I’m really sorry to be missing #eseb2025, but for those sorting out their conference plan there are several lab talks and posters about what we are up to. Spoiler, they aren't all talking about guppies, or even fish! 1/n
14.08.2025 15:26 — 👍 8 🔁 3 💬 1 📌 0
Thanks Will, hope you’re doing well!
03.07.2025 14:16 — 👍 0 🔁 0 💬 0 📌 0
This is amazing work and a great thread, revealing the hidden genetic complexity behind the equally complex pigmentation patterns. Check it out! 🧪
01.07.2025 18:33 — 👍 22 🔁 2 💬 0 📌 1
Yes I’ll be there.
01.07.2025 21:43 — 👍 1 🔁 0 💬 0 📌 0
Thanks a lot Alex!! Guppies continue to be amazing.
01.07.2025 19:11 — 👍 1 🔁 0 💬 1 📌 0
Thanks Chris!
01.07.2025 18:35 — 👍 0 🔁 0 💬 0 📌 0
Thanks Stephen!! And congrats to you on the new gig!
01.07.2025 18:31 — 👍 1 🔁 0 💬 1 📌 0
This paper is the result of years of hard work, and would not have been possible without all the help from my co-authors. Special thanks to @jacejostles.bsky.social for taking ~8k photos (+fig 1a), and to @judithmank.bsky.social for her unwavering support of this project.
01.07.2025 18:17 — 👍 6 🔁 0 💬 3 📌 0
Overall, the color patterns are made up of a patchwork of ornaments. The genetic architecture is much more complex than previously appreciated.
Duplications from the autosomes to the sex chromosomes play a large role in the evolution of the extreme variation in this species.
01.07.2025 18:13 — 👍 3 🔁 1 💬 1 📌 0
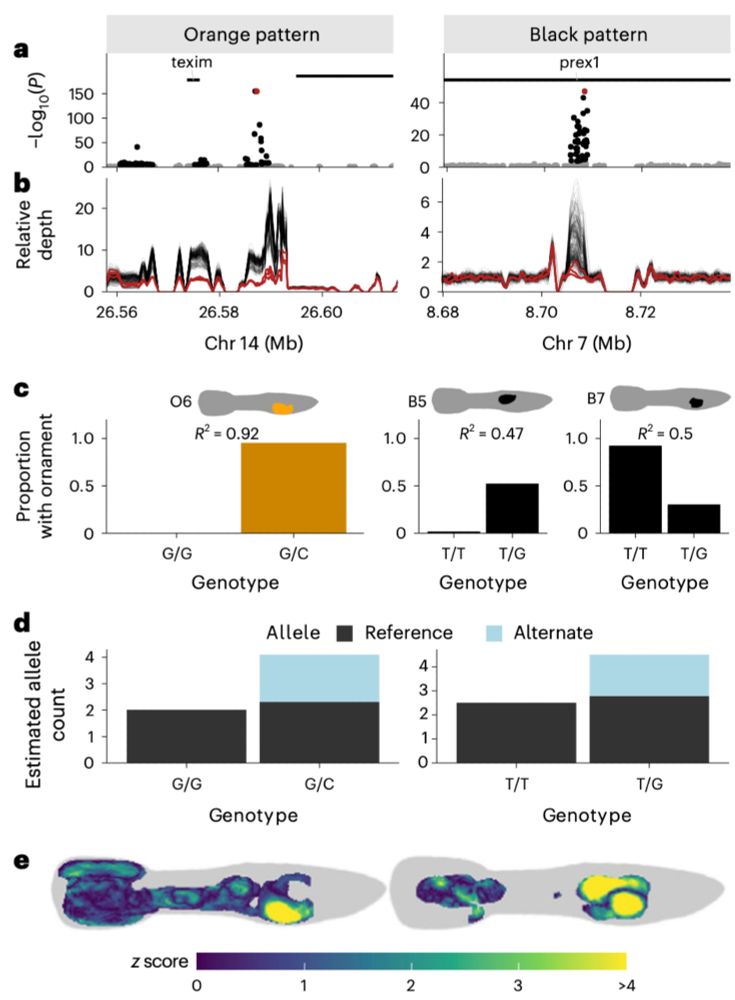
Large-effect CNVs underlie sex-linked variation in colour pattern.
a, GWAS peaks on autosomes with significant loci with sex-linked inheritance, near texim and in prex1. b, The relative coverage (1× = genome-wide sample average) across the region for 297 males (this study) and 3 females, calculated in moving windows of 1 kb, 100 bp apart. c, Phenotypic effects of the top variant (diamond in a) on ornaments O6 (orange pattern) and B5 and B7 (black pattern). The proportion of variation in the phenotype that is explained by the top SNP is displayed as Nagelkerke’s R2 from a logistic regression. d, Median estimated allele counts for the top SNP, based on read depth, for homozygous reference and heterozygous individuals. No heterozygous alternate individuals were found. e, PheWAS heat maps displaying z scores for the effect of the top variant on orange and black colour across the body, controlling for autosomal and sex-linked relatedness.
The sex-linked ornaments instead show loci of very large effect at copy number variants. The locus of largest effect for orange pattern is at texim, a gene with many duplications to the Y. For black, the largest effect loci is prex1, an X-linked CNV with a know role in NCC migration.
01.07.2025 18:13 — 👍 6 🔁 1 💬 1 📌 0
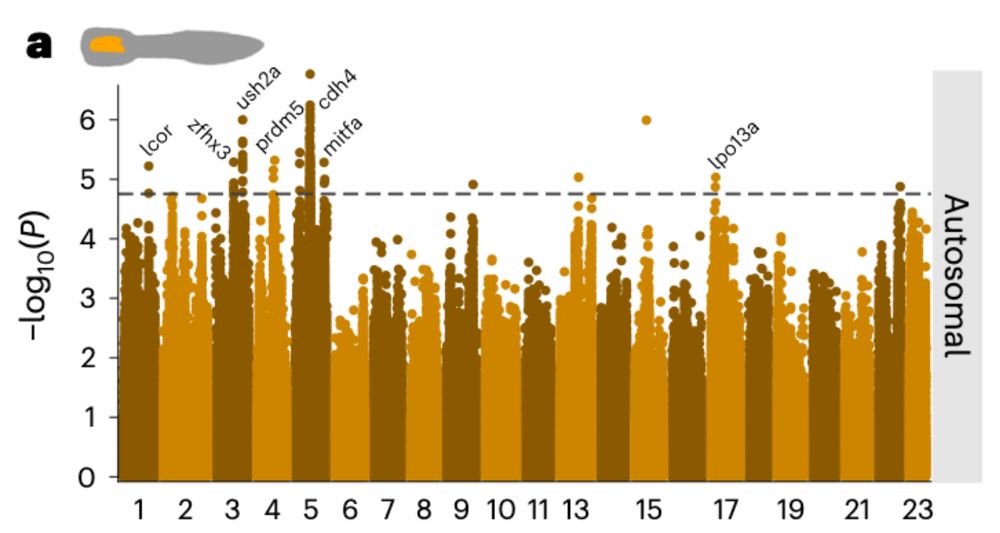
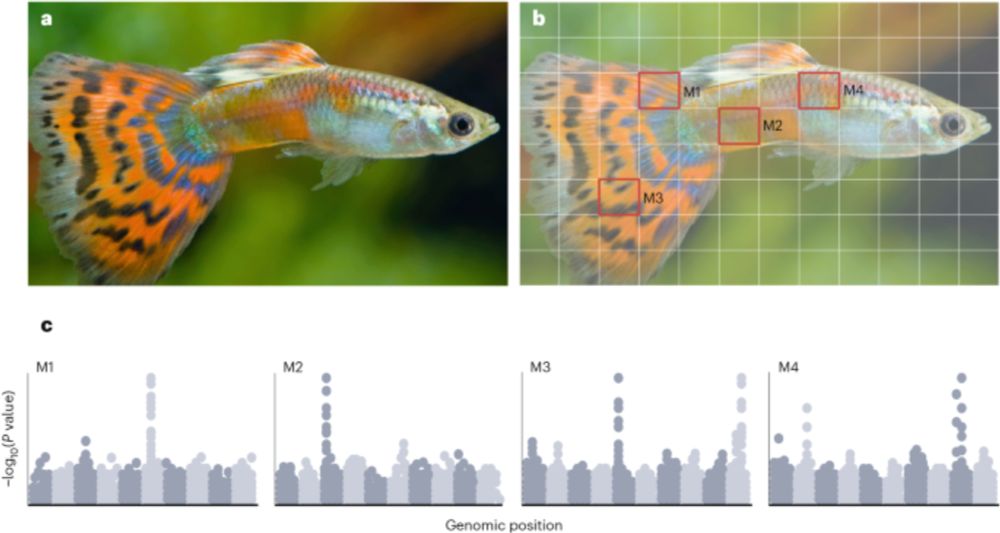
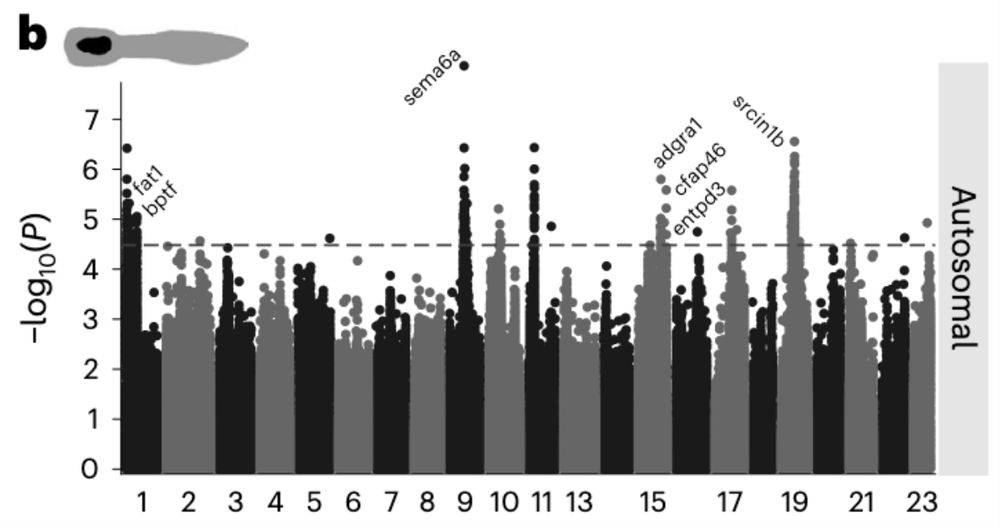
A Manhattan plot showing the association of genomic variants with ornament O2. Points represent genomic variants, with their genomic location on the x axis and the two-sided P value of the association on the y axis (from mixed effects GWAS). P values are displayed as uncorrected for multiple testing, with the dotted line denoting the 5% FDR level.
As the first figure, but for ornament B1.
Next, we sequenced 300 males to map this variation to the genome.
First, for autosomal ornaments we find a polygenic architecture. Many of the loci are near genes involved in neural crest cell migration. These cells later develop into the chromatophores responsible for coloration.
01.07.2025 18:13 — 👍 4 🔁 0 💬 2 📌 0
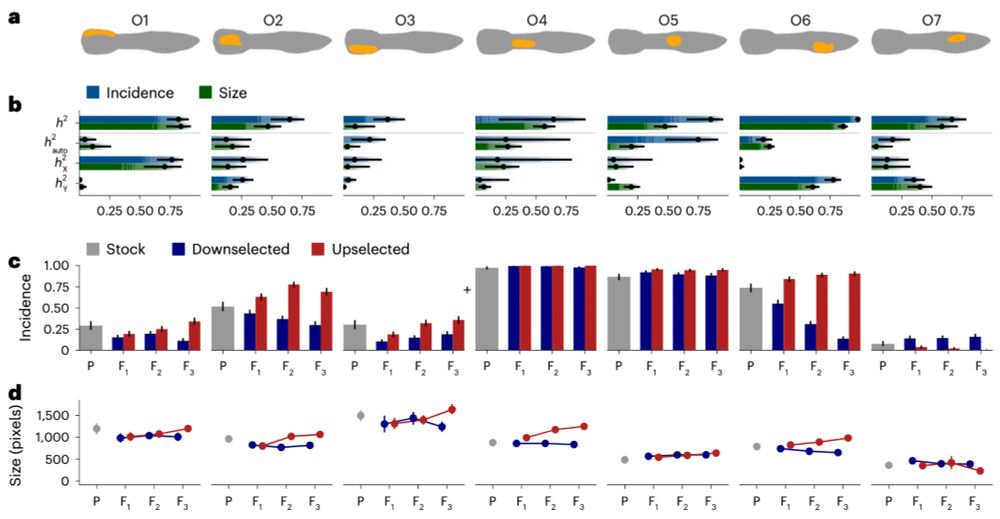
Orange ornaments are strongly heritable, and their incidence and
size responded to selection. a, Pictograms of seven orange ornaments.
b, Heritabilities of the incidence and size (when present) of each ornament. Dots and lines reflect point estimates and 95% credible intervals, and the gradient bars show the cumulative posterior density. c,d, The effect of selection on the incidence and size of orange ornaments. Bars and points represent means, with error bars showing 95% bootstrapped confidence intervals. x axes show consecutive generations. Sample size (number of fish); P generation: 300; downselected F 1, F2 and F3: 453, 570 and 441; upselected F 1, F2 and F3: 508, 513 and 444.
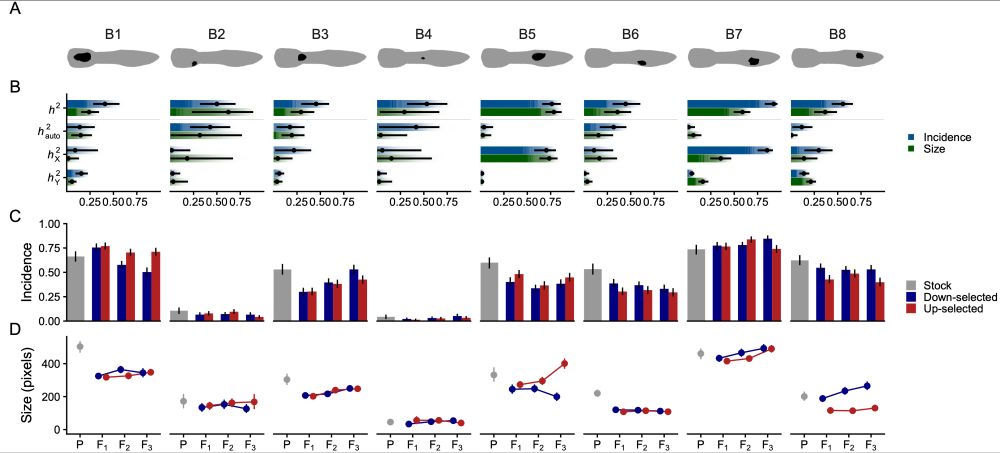
As in the first figure.
Among all this variation, we can distinguish 7 orange and 8 black ornaments. Together, these can combine into 32k different patterns, although we observe just 691.
Each of the ornaments have different contributions from the autosomes and the sex chromosomes. Only 2 show clear Y-linked inheritance.
01.07.2025 18:13 — 👍 4 🔁 0 💬 1 📌 0
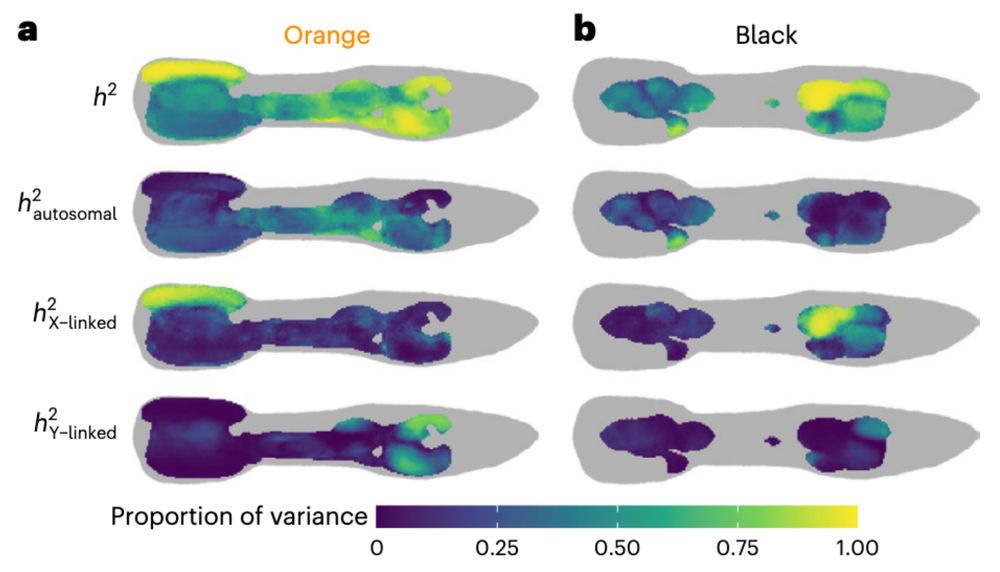
The localized heritability of colour is high, but the architecture is
heterogeneous. a,b, The narrow-sense heritability of the presence of orange (a) and black (b) colour on the guppy body. For each heat map cell, a Bayesian animal model was used to estimate the contribution of additive genetic and environmental factors. Heritabilities are expressed as a proportion of the between-individual phenotypic variance. The autosomal, X-linked and Y-linked heritability add up to the total heritability. Body positions where the incidence of colour is less than 1% are coloured grey.
Combining the pedigree with >14k guppy photos, we can model the inheritance of ornamentation across the body. Localized heritability is very high overall. Each body location has its own genetic architecture. We see clear X- and Y-linked inheritance, but only for a minority of the body plan.
01.07.2025 18:13 — 👍 4 🔁 0 💬 1 📌 0
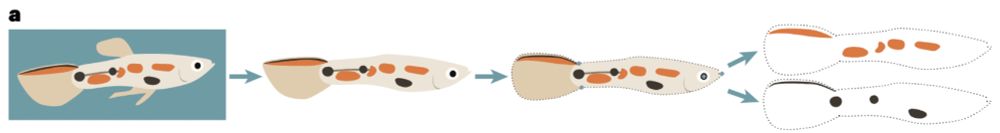
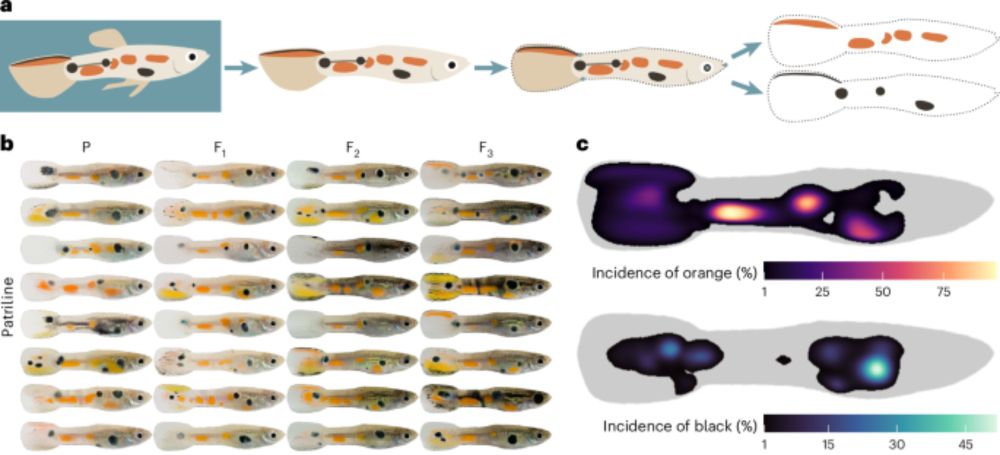
| Quantification of pattern variation. a, An overview of the phenotyping
pipeline. From each photo, the fish is extracted, the body is aligned to a common
reference shape using landmarks, and the position of orange and black colour is
extracted.
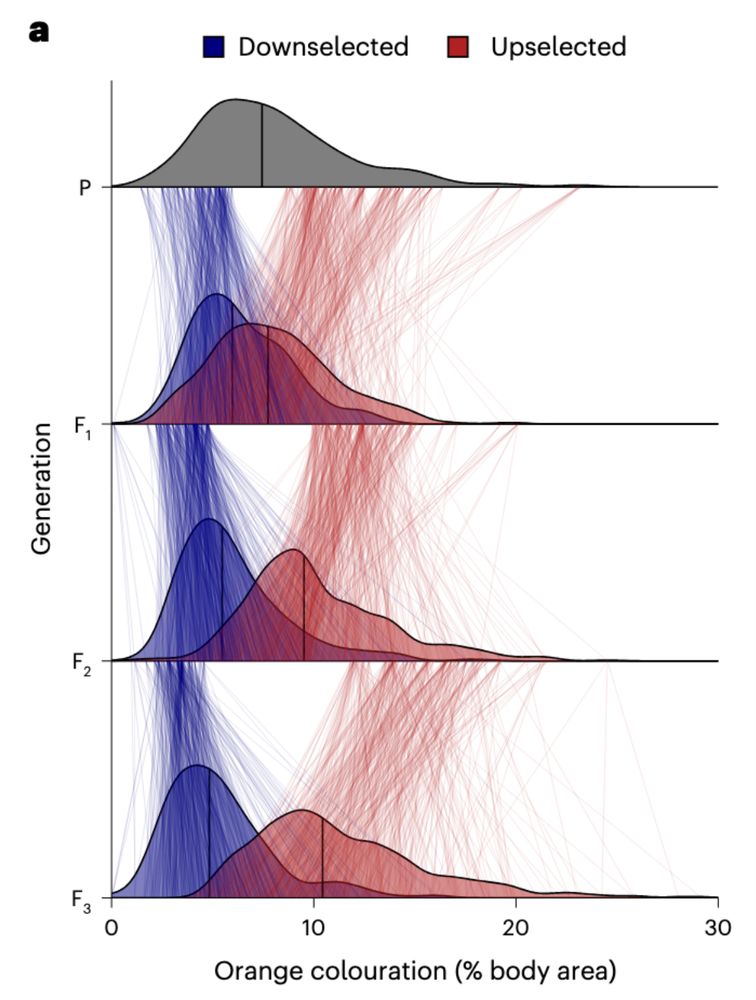
| Orange colour responds rapidly to selection. a, Density plots show
the distribution of the percentage of orange colouration per generation and
selection regime. Thin lines between generations connect fathers to their sons.
Thick lines inside the densities show the median value of colour area.
We set up a selection experiment and phenotyped 3,200 males in a pedigree. Using a deep learning pipeline, we extracted all the ornamentation and aligned the images to a common reference shape.
In just three generations, our selection lines differed by 2x, confirming high heritability.
01.07.2025 18:13 — 👍 6 🔁 0 💬 1 📌 0
Acteur/Regisseur/Presentator/Schrijver
#OnzeJordaan #ChateauPromenade
#Top2000agogo
#TheBestOfPop
Research Fellow at Girton College, Cambridge
Interested in population genomics, invasive species, hybridization, adaptation, speciation
CEO of Bluesky, steward of AT Protocol.
dec/acc 🌱 🪴 🌳
PhD candidate @politicsoxford.bsky.social | Columnist @decorrespondent.nl | Rower @ox.ac.uk | views my own
Expressive probabilistic programming language for writing statistical models. Fast Bayesian inference. Interfaces for Python, Julia, R, and the Unix shell. A rich ecosystem of tools for validation and visualization.
Home https://mc-stan.org/
PhD student | Studying models of coevolution at SFU | He/Him
Statistics in general, #rstats in particular (Core team member). Professor at CBS w/biostats background. Likes cooking and bicycling and socialising in general. Oh, and music: Opera, Jazz, ProgRock.
I am an evolutionary biologist. Broadly interested sexual selection and conflict, genomics, and bioinformatics. | biology | evolution | insects | drosophila | uncharismatic minifauna | climbing | reading | video games
Postdoc at IST Austria, population genetics
PhD candidate @thehoffmanlab.bsky.social working on the genomics of sexual trait expression in black grouse 🧬👩💻🧪
mutation load | inbreeding | population genetics | ecological epigenetics | sexual selection
https://rshuhuachen.github.io/rc/
Evolutionary and population genomics
Assistant Professor in Poznan, Poland 🇵🇱
Evolutionary behavioural ecologist @unito @dbiosunito. Interested in reproduction of 6-to-8-legged creatures. Mom of 2. Big fan of @MacroBeatsRecords
CNRS Researcher - France - Europe
Evolutionary Biology - Genomics - Ecology
I study #socialfluids. Ponderer of the #behavior of myself & other organisms. #SocialInsects / #DistributedMetabolism / #CollectiveBehavior / #CompBio Assoc. Prof @ University of Cambridge; previously Fribourg, Weizmann, Lausanne, Rockefeller, UCSB.
Associate Professor, molecular ecologist @ Utrecht University.
Zombie-making parasites, extended phenotypes, ant behavior, fungal hyper parasites, fungi for sustainable solutions. DEI advocate. #firstgen
Metal head, cat lady, dog mom, BJJ black belt.
Statistical geneticist. Associate Prof at Dana-Farber / Harvard Medical School.
www.gusevlab.org
Evolutionary ecology / Macroevolution /🧠🪰🦌🐟 / NewPI
at Lund University / from 🇯🇵 in 🇸🇪
https://www.masahitotsuboi.com
Lecturer and leader of the wildlife behaviour and ecotoxicology research group @griffith.edu.au
Professor and Behavioural Ecologist at Monash University
https://www.bobwonglab.org
UBC Zoology. PhD student 🦟
2x Olympian 🏊🇨🇦
Gamer, eater, lover 😌