Disclaimers: All opinions are my own. The results shown above were approved for release under Disclosure Review Board (DRB) approval number CBDRB‑FY25‑0280.
14.07.2025 12:38 — 👍 0 🔁 0 💬 0 📌 0
National Experimental Well-Being Statistics Project (NEWS)
Thanks so much to my coauthors Adam Bee, John Creamer, Josh Mitchell, Nikolas Mittag, Elizabeth Pelletier, Carl Sanders, Lawrence Schmidt, and Matt Unrath. See how NEWS affects estimates for different groups at jrothbaum.github.io/news.html and the official release at www.census.gov/data/experim...
14.07.2025 12:38 — 👍 1 🔁 0 💬 1 📌 0
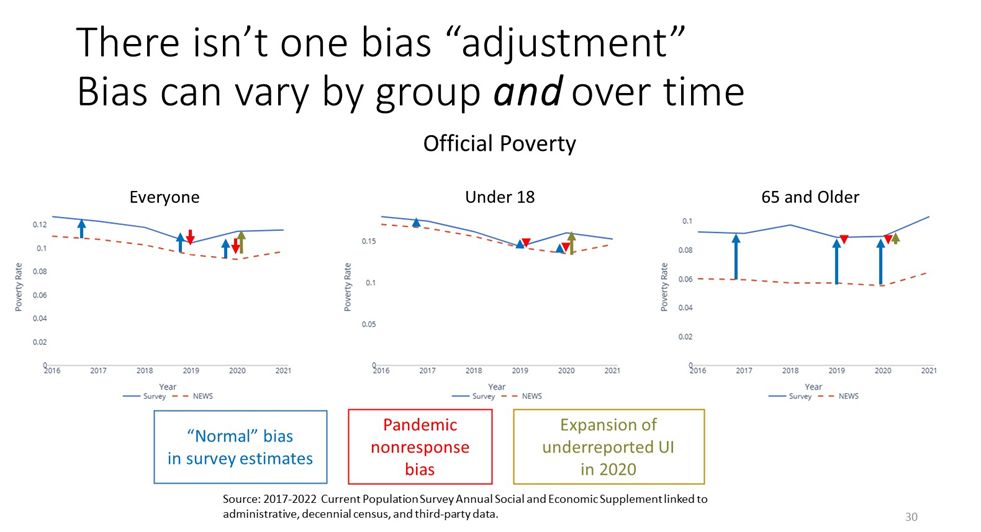
As noted above, the bias can vary a lot across groups and over time. Underreporting of UI benefits can cause bias in child poverty (their parents are likely to work and therefore collect UI in a downturn) but won’t impact elderly poverty much.
14.07.2025 12:38 — 👍 0 🔁 0 💬 1 📌 0
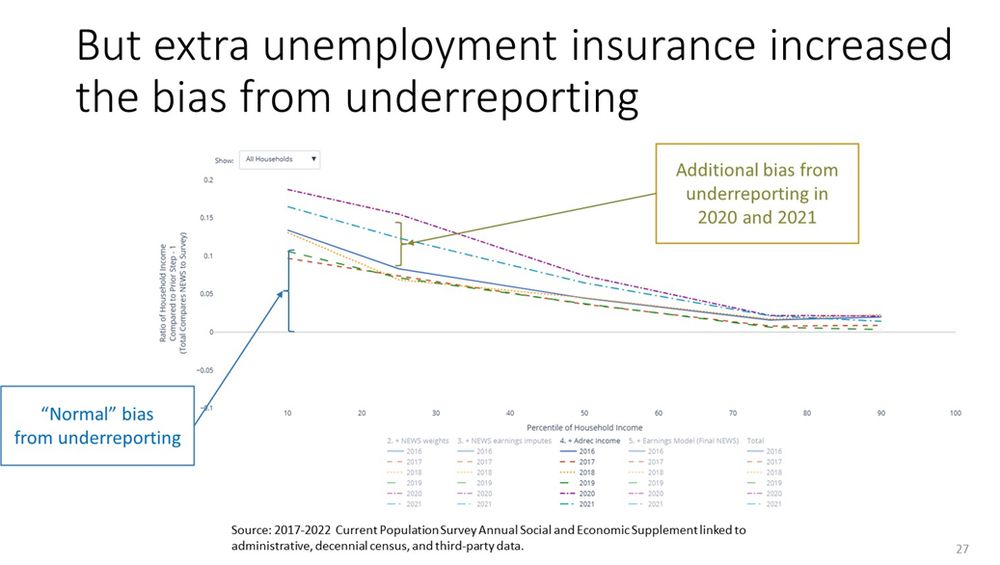
Likewise, we see more missing income, when income shifts from well-reported sources (like wage and salary earnings) to ones with greater underreporting (like unemployment insurance, or UI) in 2020 and 2021.
14.07.2025 12:38 — 👍 0 🔁 0 💬 1 📌 0
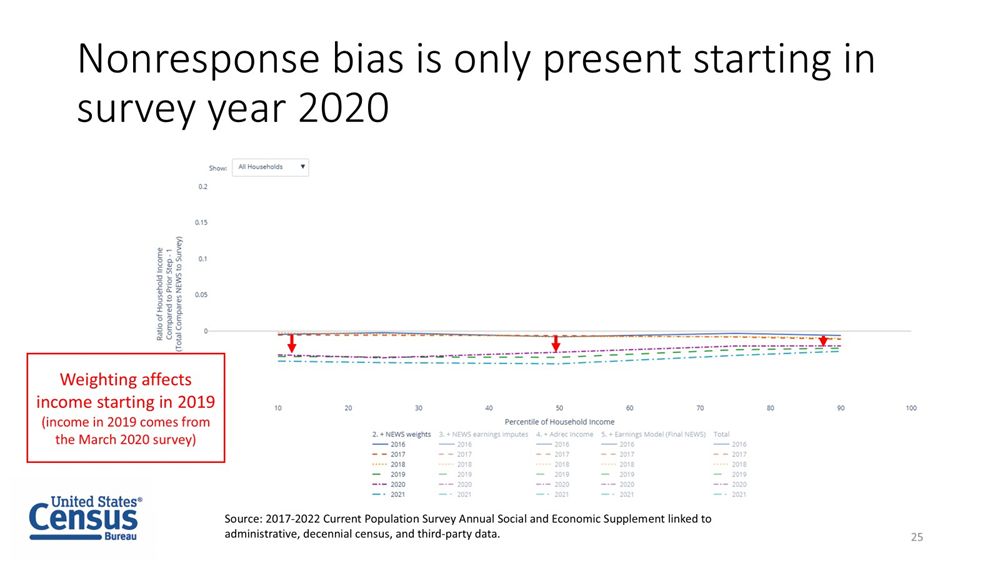
We said Pandemic nonresponse bias started affecting the data in 2020, but how do we know this? We can look at the results after each step. Our weighting adjustment only starts affecting our estimates for surveys conducted in 2020, affecting income estimates from 2019 forward.
14.07.2025 12:38 — 👍 0 🔁 0 💬 1 📌 0
We do several things, including 1) weighting to adjust for nonresponse bias (income may be correlated with survey response), 2) imputation (not everyone answers income questions on surveys), 3) and combining survey and adrec data (what’s the right number when they disagree?)
14.07.2025 12:38 — 👍 0 🔁 0 💬 1 📌 0
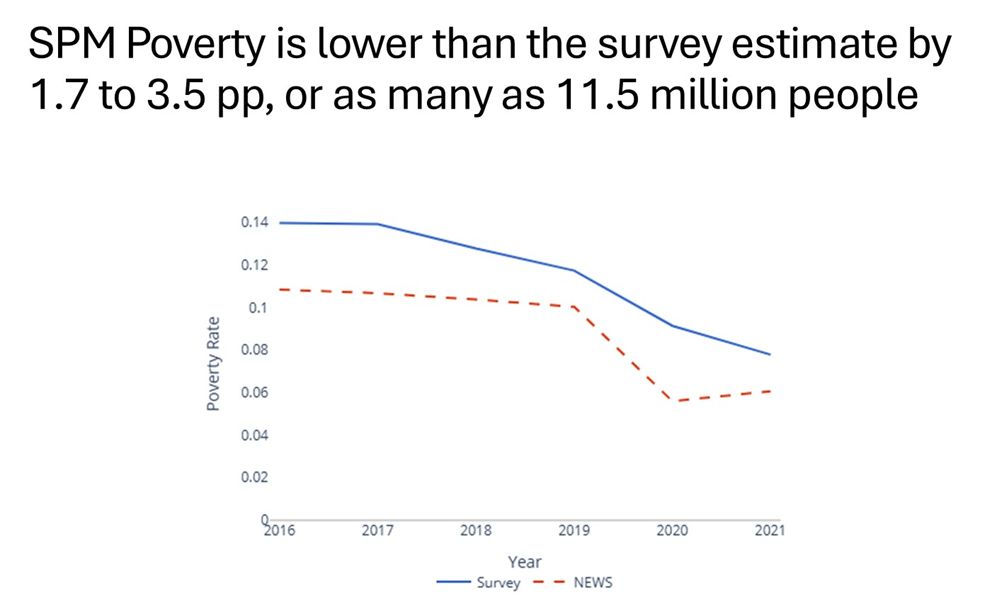
Our post-tax income+in-kind transfer measure mirrors the resource measure used to calculate the Supplemental Poverty Measure (SPM).
The NEWS SPM rate is 1.7 to 3.5pp lower than the survey, depending on the year, with as many as 11.5 million fewer people in poverty.
14.07.2025 12:38 — 👍 0 🔁 0 💬 1 📌 0
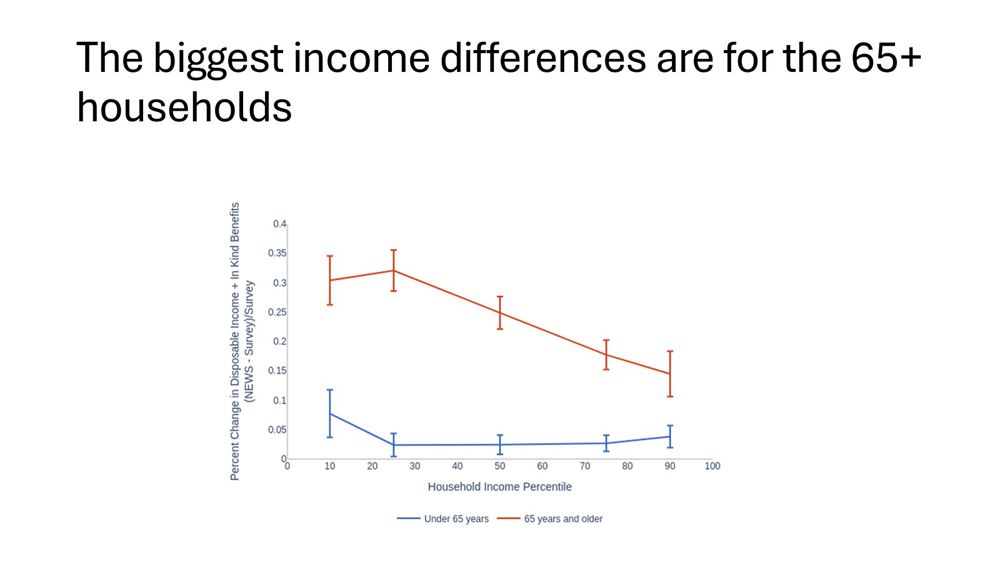
Split the effect by age, and we see the biggest change is among seniors, who tend to underreport other sources of retirement income (from 2018).
14.07.2025 12:38 — 👍 1 🔁 0 💬 1 📌 0
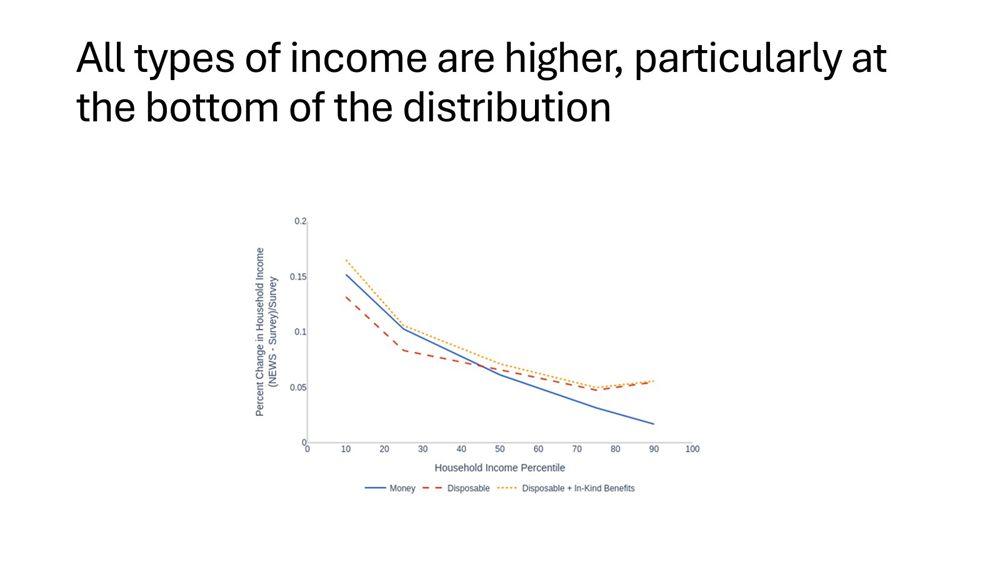
We estimate three income measures: money income, post-tax income, and post-tax income+in-kind transfers (excluding health insurance).
Relative to the survey, our estimates of all three measures increase across the income distribution (shown from 2018)
14.07.2025 12:38 — 👍 0 🔁 0 💬 1 📌 0
In the prior release, we expanded the resource measures we estimate to include taxes, credits, and in-kind benefits. We use linked adrecs to address survey underreporting of multiple safety net programs and linked tax returns to improve estimates of taxes and filing behavior.
14.07.2025 12:38 — 👍 0 🔁 0 💬 1 📌 0
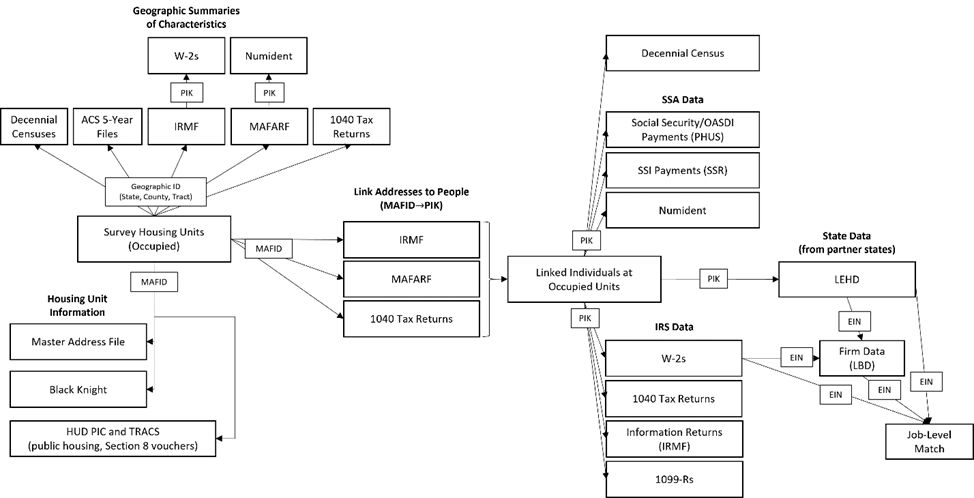
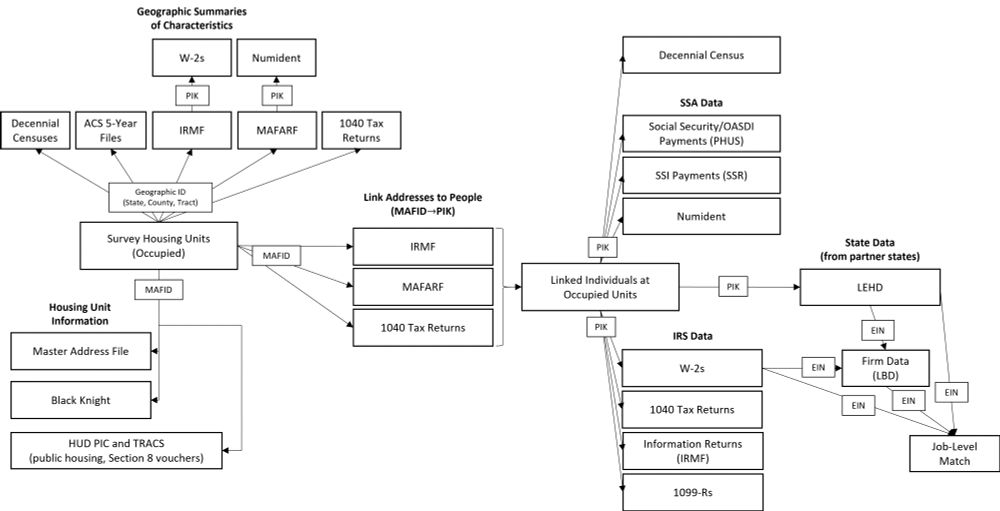
Beyond the tldr;! We use CPS ASEC (source of official income and poverty), 1040s, W2s, info tax returns, LEHD, ACS, census, OASDI and SSI payments, federal and state safety net data (housing assistance, SNAP, TANF, and WIC), firm data, and commercial data on home values.
14.07.2025 12:38 — 👍 0 🔁 0 💬 1 📌 0
This is the third release of the National Experimental Wellbeing Statistics (NEWS) Project at Census. In this release, we use the same methods as the prior one, but cover additional years.
Latest release here: www.census.gov/data/experim...
Prior release here: bsky.app/profile/jlro...
14.07.2025 12:38 — 👍 2 🔁 1 💬 1 📌 0
NEWS - Money Income - By Year
Lots of estimates by group and year, some examples:
• Pre-tax income: jrothbaum.github.io/news/income/...
• + Taxes and credits: jrothbaum.github.io/news/income/...
• Official poverty: jrothbaum.github.io/news/poverty...
• Supplemental poverty: jrothbaum.github.io/news/poverty...
14.07.2025 12:38 — 👍 0 🔁 0 💬 1 📌 0
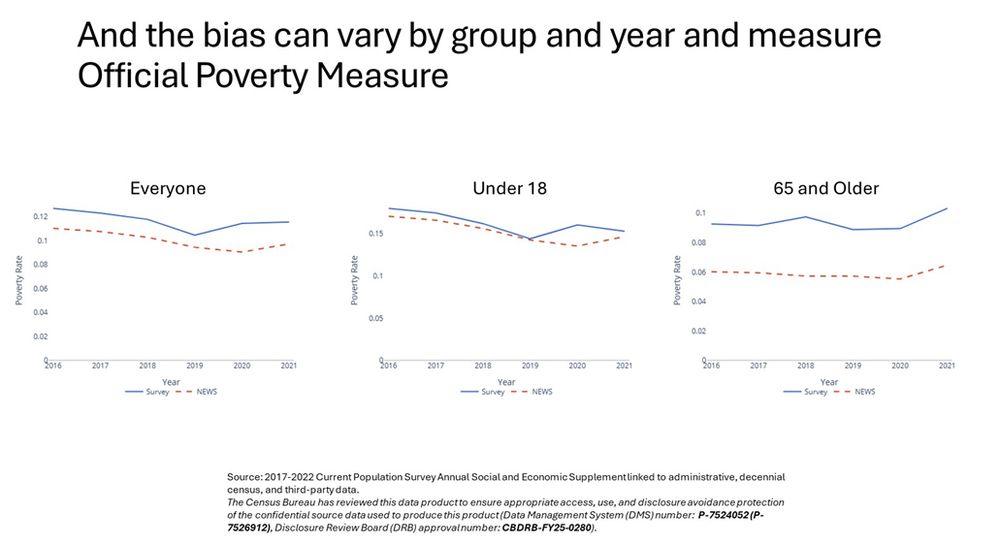
This varies by group. Parents have mostly wage and salary earnings, which is well reported: not much normal bias, but lots of underreporting of UI in 2020. Those 65+ have lots of retirement income: lots of normal bias, but not much change in 2020 or 2021.
14.07.2025 12:38 — 👍 0 🔁 0 💬 1 📌 0
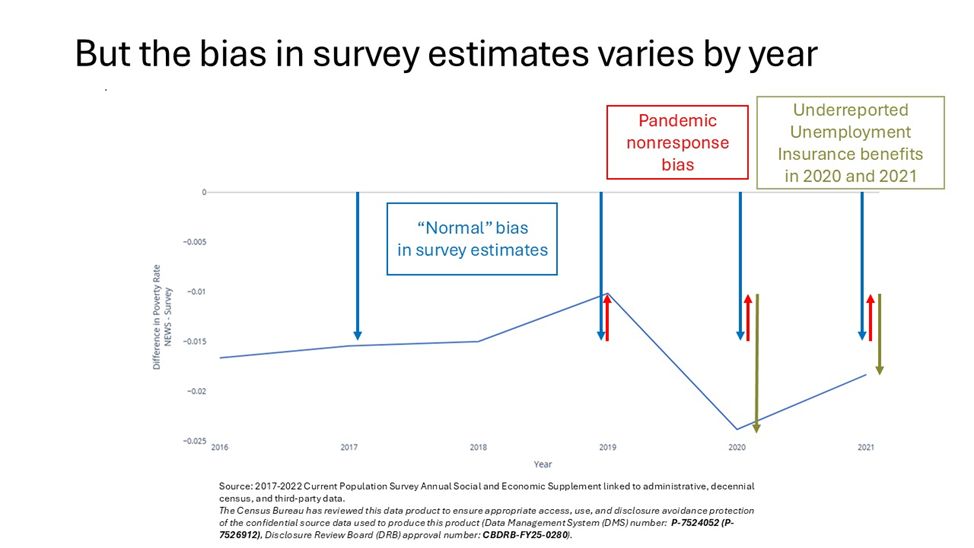
But the bias varies by year 1) in each year there’s “normal” bias from underreporting of income, like pensions, 2) From 2020 on, high income households respond at higher rates, 3) some income is reported better than others, and UI is not well reported, so UI ↑ in 2020 => bias ↑
14.07.2025 12:38 — 👍 0 🔁 0 💬 1 📌 0
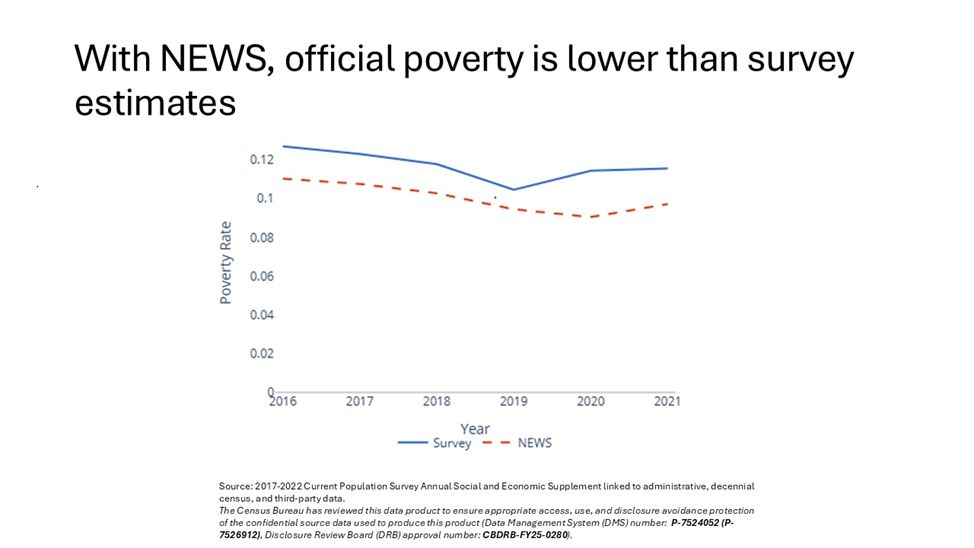
The difference between NEWS and official survey estimates can be large. In 2020, the NEWS estimate of official poverty is 2.4pp lower than the survey, with 8 million fewer people in poverty.
14.07.2025 12:38 — 👍 0 🔁 0 💬 1 📌 0
New research from the NEWS project on income and poverty from 2016-2021
Using survey, census, admin and commercial data, we show that survey estimates understate income and overstate poverty.
Release at www.census.gov/data/experim..., interactive plots at jrothbaum.github.io/news.html
14.07.2025 12:38 — 👍 8 🔁 5 💬 1 📌 1
In my testing it's 2-5x faster than my best attempt to do this using Stata's python integration (and my python-based solution is way faster than the standard code for large files with batched file handling and multiprocessing).
25.05.2025 14:04 — 👍 1 🔁 0 💬 0 📌 0
GitHub - jrothbaum/stata_parquet_io: Read and write parquet files to stata using polars rust
Read and write parquet files to stata using polars rust - jrothbaum/stata_parquet_io
I've done benchmarks (see github.com/jrothbaum/st...). Stata is efficient at loading dta files and I can't match that, but parquet files are faster to load if the file is large and you only need a subset of columns - that's where parquet shines
25.05.2025 13:53 — 👍 0 🔁 0 💬 1 📌 0

What is Apache Parquet?
Learn more about the open source file format Apache Parquet, its applications in data science, and its advantages over CSV and TSV formats.
Parquet is a standard file format with some big advantages: standard format for use in R and python (for multilanguage projects), super compressed relative to dta files (5-10% the size on disk). www.databricks.com/glossary/wha...
25.05.2025 13:53 — 👍 1 🔁 0 💬 1 📌 0
Reposting the image in a different format...
29.01.2025 15:28 — 👍 0 🔁 0 💬 0 📌 0
2) estimating income and poverty when many or all of the adrecs are not yet available, both for timely estimates (some adrecs arrive with months or years of lag) and going back in time, and 3) estimating income and poverty at lower geographic levels (state, county, tract). (n/n)
29.01.2025 15:22 — 👍 0 🔁 0 💬 0 📌 0
We plan to release more years of data later in 2025. And we’re on to the next set of goals: 1) addressing underreporting (in the survey and adrecs) of other items such as self-employment earnings and rental income. (19/n)
29.01.2025 15:22 — 👍 1 🔁 0 💬 1 📌 0
We made lots of other programming improvements to make our estimates better, faster, and more replicable - detailed in the paper. (18/n)
29.01.2025 15:22 — 👍 0 🔁 0 💬 1 📌 0
This allows us to match the distribution of earnings conditional on worker characteristics and the unconditional distribution of earnings (conditional on our model assumptions). That was not guaranteed in our prior approach. (17/n)
29.01.2025 15:22 — 👍 0 🔁 0 💬 1 📌 0
For most respondents, we use their adrec earnings (consistent with the audit results). However, for the others, we either use the survey or impute a “true” earnings value drawn the estimated posterior distribution for that worker. (16/n)
29.01.2025 15:22 — 👍 0 🔁 0 💬 1 📌 0
We improve on prior work with two pieces of info: 1) estimates from randomized audits of how often reported wage and salary earnings are adjusted at audit and 2) more people’s survey and adrec earnings agree than you’d expect from a model of random noise in survey reports. (15/n)
29.01.2025 15:22 — 👍 0 🔁 0 💬 1 📌 0
We updated how we combine survey and adrec wage and salary earnings. Before, we picked the survey or adrec based on which seemed more accurate for each group of workers. Now, we directly model posterior distributions of earnings for each worker. (14/n)
29.01.2025 15:22 — 👍 0 🔁 0 💬 1 📌 0
Still here? There’s more! We made lots of changes under the hood to improve our estimates and our process. (13/n)
29.01.2025 15:22 — 👍 0 🔁 0 💬 1 📌 0
Economic Historian at the Census. 19th & 21st C innovation, sci of sci, urban/spatial, info spread. All views are my own or expressed for rhetorical exposition. Posts before 2025 were imported. (they/them)
Brookline, MA
Senior researcher, Kela Research Department (Finland), PhD in economics. Family policy, mental health and gender gaps
https://rasanentapio.github.io/
Economist. Washington, D.C.
Labor economist @ Carnegie Mellon University. Fan of rail ferries, portage railways, transporter bridges, and funiculars.
Have a PhD. Would never call myself doctor except in jest. PhD is a humbling experience where you learn that you don't know much.
Dad, sportsball fan, nerd stuff, economist. Personal account-views are my own.
Ass prof in econ at the University of Bordeaux
Too much code.
https://sites.google.com/site/laurentrberge/
Dataframes powered by a multithreaded, vectorized query engine, written in Rust.
Head of Content, The Ringer • Host, The Big Picture • Subscribe: http://spoti.fi/2Iwuk26 • See you at the movies
Economics professor at Princeton. I study environmental conservation, gender equality, and (too many) other topics in developing countries.
seemajayachandran.com
bi+, she/her/hers. Economist. My personal opinions. I study the safety net, health, education, & econ. demography. @J_HumanResource, @nberpubs, @IZA_Bonn.
Sr. Economist at Chicago Fed | Professor | ASU💜💛 & JSU💙🤍 Alum | AKA🩷💚| Artist | Chicagoan | views are my own
Lead Economist at the World Bank’s Development Research Group
Development Impact blogger
https://sites.google.com/site/decrgdmckenzie/
Director, @stanforddel.bsky.social
Professor Stanford Institute for Human-centered AI, SIEPR, Stanford department of Economics and GSB
Author https://amazon.com/Second-Machine-Age-Prosperity-Technologies/dp/0393350649
The Bill Simmons Podcast, The Rewatchables, The Ringer, Spotify, HBO’s Music Box, The Book of Basketball. Formerly: Grantland, 30 for 30, ESPN.
ringer // wrote a novel, link’s around here somewhere
host of the Ringer WNBA Show. probably in line for a glizzy as we speak.
Senior staff writer, The Ringer
Be better tomorrow
Editor + Host, Ringer. Eat, eat, eat, eat MCs.