Collaboration. In my experience, many academic collaborators prefer PowerPoint, so that tends to drive the decision - even though I personally find working in Quarto more relaxing and use it for most of my projects.
20.02.2026 15:43 — 👍 0 🔁 0 💬 0 📌 0
I'm happy to announce a new and improved version of my quarto revealjs extension that interfaces with roughnotation
More annotation types, fragment support, works with flourish extension to allow for annotations of code chunks, and reverse animations are all here
github.com/EmilHvitfeld...
#quarto
05.02.2026 20:14 — 👍 62 🔁 15 💬 3 📌 0

If Bilbo had Chat GPT
27.01.2026 16:24 — 👍 3736 🔁 1068 💬 39 📌 40
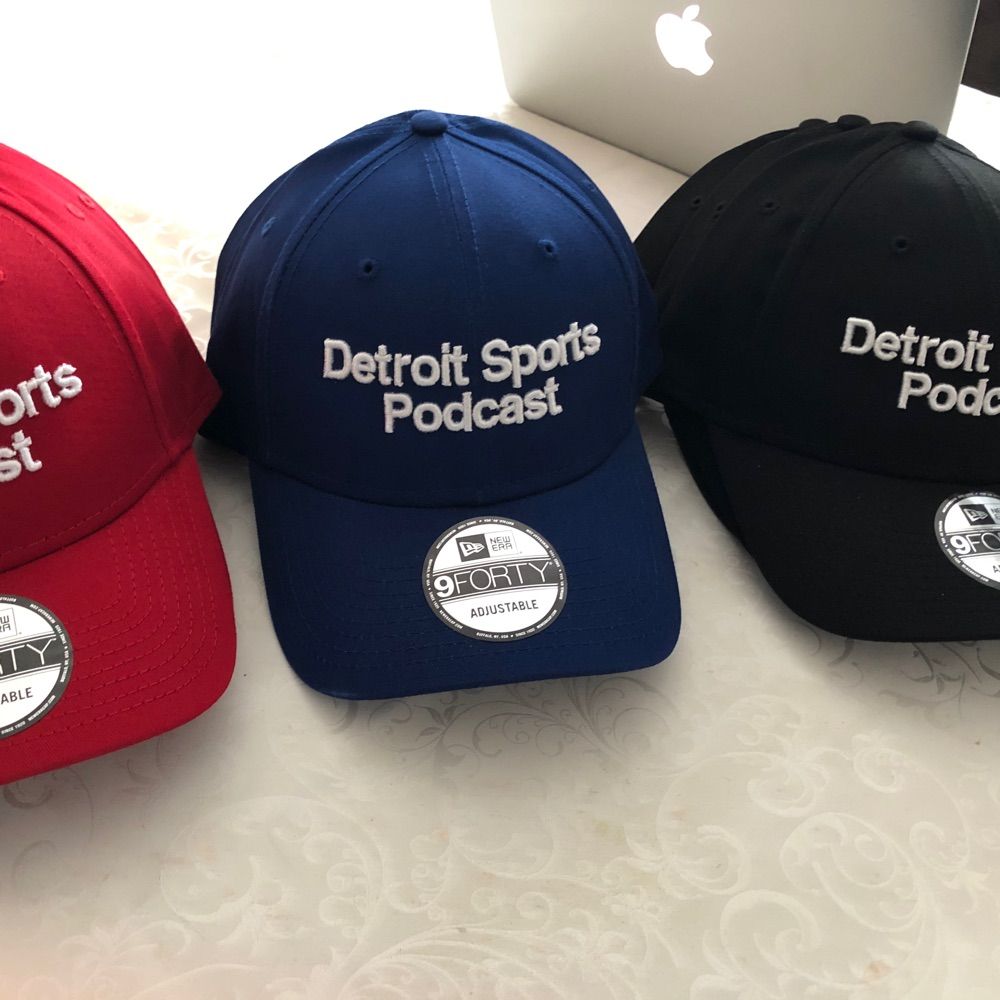
Detroit!!!!!!!!!!!!
08.01.2026 15:58 — 👍 1 🔁 0 💬 0 📌 0
For those who come after
12.12.2025 15:10 — 👍 1 🔁 0 💬 0 📌 0

A 3x3 grid of different ways to visualise the distribution of a variable, including histograms, density plots, gradient fills, and dots plots. The distribution shown is skewed with some outliers.
We're looking at cars in Qatar for #TidyTuesday this week - "an international and modern version of the now-ancient `mtcars`" data! 📊
➡️ 9 ways to visualise the distribution of a variable
Thanks to @andrew.heiss.phd for curating this week's dataset!
#RStats #DataViz
09.12.2025 10:50 — 👍 64 🔁 10 💬 1 📌 1
boooo
13.11.2025 15:55 — 👍 0 🔁 0 💬 0 📌 0

GitHub - hadley/genzplyr: dplyr but make it bussin fr fr no cap
dplyr but make it bussin fr fr no cap. Contribute to hadley/genzplyr development by creating an account on GitHub.
Do you teach #rstats? Do your students complain about how lame and old-fashioned dplyr is? Don't worry: I have the solution for you: github.com/hadley/genzp....
genzplyr is dplyr, but bussin fr fr no cap.
06.11.2025 23:25 — 👍 460 🔁 167 💬 42 📌 55

#TidyTuesday Week 38 - FIDE
Took what I know about ELO ratings and made a beeswarm 🐝 to compare Masters and players (like me) near the 1000 ELO mark. Also added a reference section to my script to 'cite' what scripts I looked at. Maybe it'll catch on
#Rstats #dataviz
Code github.com/nvietto/Tidy...
22.09.2025 21:11 — 👍 16 🔁 5 💬 1 📌 0
The Pac-Man Rule should be adopted at all conferences and meetups - it's so much more welcoming!
Also an excellent use of a pie chart! 📊
17.09.2025 15:50 — 👍 40 🔁 8 💬 2 📌 1

ggplot2 4.0.0
A new major version of ggplot2 has been released on CRAN. Find out what is new here.
I am beyond excited to announce that ggplot2 4.0.0 has just landed on CRAN.
It's not every day we have a new major #ggplot2 release but it is a fitting 18 year birthday present for the package.
Get an overview of the release in this blog post and be on the lookout for more in-depth posts #rstats
11.09.2025 11:20 — 👍 850 🔁 281 💬 9 📌 51
so cool
27.08.2025 14:15 — 👍 1 🔁 0 💬 0 📌 0
Excited to share my newest quarto revealjs plugin: imagemover
Easily reposition and resize images directly in your quarto revealjs slides for a much smoother slidecrafting experience
github.com/EmilHvitfeld...
#quarto
13.08.2025 19:20 — 👍 205 🔁 50 💬 6 📌 10
 31.07.2025 16:54 — 👍 1 🔁 1 💬 0 📌 0
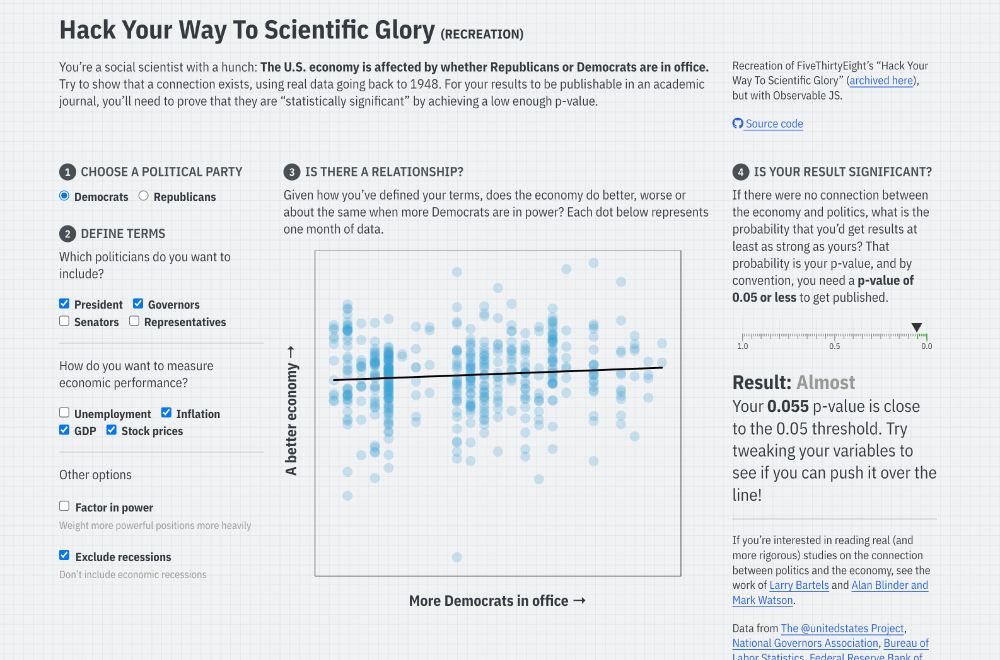
Screenshot of the linked Quarto website, with input checkboxes to change different conditions for a regression model that predicts economic performance based on US political party, with a reported p-value
I’ve long used FiveThirtyEight’s interactive “Hack Your Way To Scientific Glory” to illustrate the idea of p-hacking when I teach statistics. But ABC/Disney killed the site earlier this month :(
So I made my own with #rstats and Observable and #QuartoPub ! stats.andrewheiss.com/hack-your-way/
20.03.2025 18:30 — 👍 1465 🔁 437 💬 57 📌 29
Extra Credit - Generative Art with {aRtsy}
Here’s a fun extra credit assignment I made that uses R/Posit Cloud for generative art with {aRtsy}. I’ve used it in stats, methods, even crim theory. Students love it. I do a mini art show before the final lecture lol. Feel free to use it!
#academicsky #rstats
nvietto.quarto.pub/extra-credit...
21.03.2025 15:48 — 👍 21 🔁 3 💬 1 📌 0
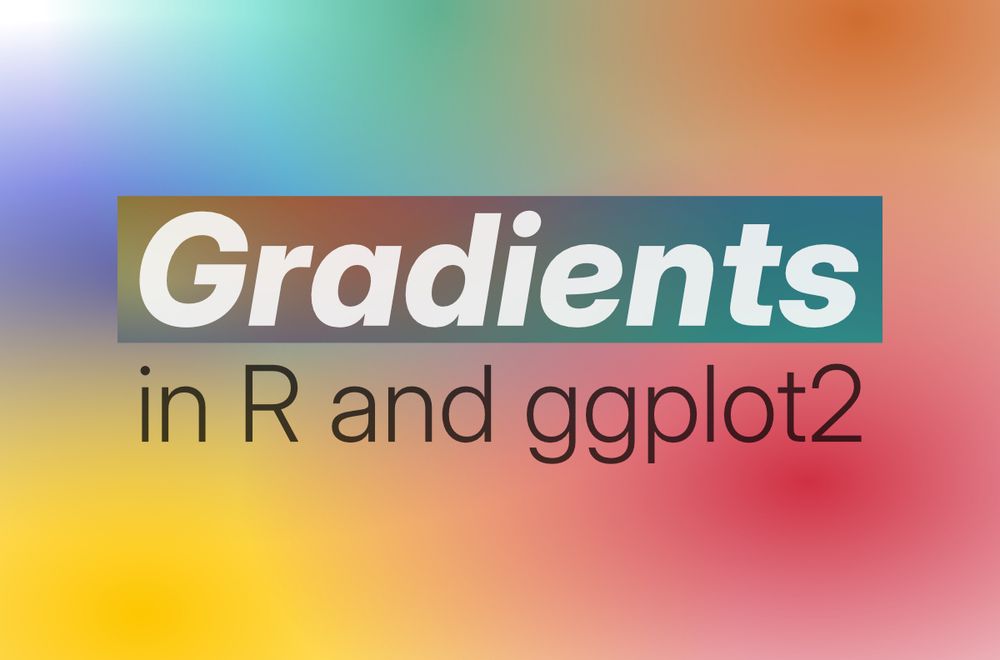
The guide to gradients in R and ggplot2 – James Goldie
Visualising data and building things for fun and for change. #climatehealth → #datajournalism
I’ve been using the new gradients and patterns in #rstats and #ggplot2 quite a bit for recent package, so here’s a deep dive! Everything from the basics of using gradients in your plots through to sophisticated visual effects.
jamesgoldie.dev/writing/stac...
17.03.2025 21:08 — 👍 98 🔁 22 💬 6 📌 4
Logo for the #TidyTuesday Project. The words TidyTuesday, A weekly data project from the Data Science Learning Community (dslc.io) overlaying a black paint splash.
TidyTuesday is a weekly social data project. All are welcome to participate! Please remember to share the code used to generate your results!
TidyTuesday is organized by the Data Science Learning Community. Join our Slack for free online help with R and other data-related topics, or to participate in a data-related book club!
How to Participate
Data is posted to social media every Monday morning. Follow the instructions in the new post for how to download the data.
Explore the data, watching out for interesting relationships. We would like to emphasize that you should not draw conclusions about causation in the data.
Create a visualization, a model, a shiny app, or some other piece of data-science-related output, using R or another programming language.
Share your output and the code used to generate it on social media with the #TidyTuesday hashtag.

A hex logo for the pixarfilms package. A light blue background inside a black hexagon, with the Pixar desk lamp in the center of the hexagon below the text pixarfilms.
Curator: @jonthegeek.com
@dslc.io welcomes you to week 10 of #TidyTuesday! We're exploring Pixar Films!
📁 https://tidytues.day/2025/2025-03-11
🗞️ https://erictleung.com/pixarfilms/articles/pixar_film_ratings.html
#RStats #PyData #JuliaLang #DataViz #tidyverse #r4ds
10.03.2025 13:36 — 👍 14 🔁 5 💬 0 📌 1
Will start contributing regularaly to #tidytuesday again, once I finish this nightmare dissertation blah.
09.03.2025 15:35 — 👍 2 🔁 0 💬 1 📌 0
 05.03.2025 21:26 — 👍 3 🔁 1 💬 0 📌 0
YouTube video by StatQuest with Josh Starmer
Gradient Descent, Step-by-Step
I'm currently working through a dissertation section that involves describing gradient descent, and Josh Starmer's explanation is by far the clearest I've come across. And I had a great ML teacher, but his explanation is a simple and straightforward, highly recommend.
www.youtube.com/watch?v=sDv4...
03.03.2025 20:19 — 👍 1 🔁 0 💬 0 📌 0

Where to find a data job for a good cause
Finding data jobs for good causes can be difficult. Learn strategies, job lists, and tips to find organizations with open positions working on causes you care about.
Got this in my email today from DrivenData, seems like a useful resource if you're looking for data science positions that center on helping fix social and environmental problems.
#datascience #dataBS
drivendata.co/blog/where-t...
25.02.2025 14:30 — 👍 5 🔁 0 💬 1 📌 0
tried downloading kafka’s diaries but there was a bug
12.02.2025 04:56 — 👍 269 🔁 35 💬 7 📌 1

As A24 re-releases the Colman Domingo Oscar contender #SingSing in movie theaters this week, the indie studio is also making the film available to nearly a million incarcerated people across the U.S. bit.ly/4hfud9f
14.01.2025 21:22 — 👍 45 🔁 8 💬 1 📌 1
#genuary5 prompt: Isometric art.
It's game of life. History goes down. I've seen a visualization like this last year and wanted to recreate it.
Made with #PyScript:
ambv.pyscriptapps.com/genuary-prom...
#genuary2025 #genuary #GenerativeArt #CreativeCoding #WebGL #Python
05.01.2025 16:11 — 👍 79 🔁 6 💬 3 📌 0

Back. To. Back.
06.01.2025 04:44 — 👍 2195 🔁 466 💬 45 📌 55
Hmm. That could be pretty cool. I might have to give that a try next time around.
21.12.2024 20:17 — 👍 0 🔁 0 💬 0 📌 0
Here for R, MLOps, Energy, & local LLMs
Climate scientist at the National Centre for Atmospheric Science, University of Reading | IPCC AR6 Lead Author | MBE | Views own | https://edhawkins.org
Warming Stripes: http://www.ShowYourStripes.info
We teach Python to everyone.
Join us : https://whatsapp.com/channel/0029Va5BbiT9xVJXygonSX0G
economics-talking guy, R enthusiast
Tired but hydrated. Lead Data Analyst for the Boston Red Sox. Recovering physicist. Formerly: Argonne, CERN (ATLAS), NIU, Murray State, St. Louis-ish
The world's largest chess website.
With over 180 million players, you'll always find a game! 💚
Senior Digital Editor for MeidasTouch.com
Clips made with SnapStream
Internet Hooligan...
girl dad, justice reform advocate, Boston sports fan, 🇮🇳🦁 // 👇🏽my views // (he/him)
Apocalyptic shit disturber elephant trainer -
This is the only account . 👈 If I share something it doesn’t necessarily mean I agree
Founding board member
@Freedom.press please follow https://linktr.ee/freedomofpress
@johncusack on twiiter
Est. 2013 Sports Podcast Network-Went from Basement to Lions On SI http://si.com/nfl/lions Entertainment powered by @tapnbarrelgrill
Sociologist studying how our social structures make sexual violence more likely to occur. Author of ON THE WRONG SIDE. Co-founder of Beyond Compliance Consulting. PhD UMich.
Owner of MSW Media, host of The Daily Beans, UnJustified, and Cleanup on Aisle 45 podcasts. #Leguminati. Veteran. She/Her Substack: muellershewrote.com Secure contact: FedOath@pm.me
Signal: muellershewrote.23
Podcast: https://link.chtbl.com/TheDailyBeans
Reporter at Bloomberg | co-host of Triple Click | New York Times bestselling author of Play Nice + Press Reset + Blood, Sweat, and Pixels | jschreier@gmail.com
Epidemiologist. Professor Emerita. Workplace Wrecker. Blue in Arizona, forged in the Burgh.
Banner quote by @amandagorman
1elizabethtjacobs1@gmail.com
@defendpublichealth.bsky.social
https://www.defendpublichealth.org
Associate Professor and Research Dean at UVA School of Data Science, #Rstats enthusiast, dad, runner, guitar noise-maker. Views my own.
Web: https://datascience.virginia.edu/people/stephen-turner
Newsletter: https://blog.stephenturner.us
Horology Fan | Novice Potter | ΚΑΨ👌🏾| Partial To All Things Data | Opinions = My Own
Menswear writer. Editor at Put This On. Words at The New York Times, The Washington Post, The Financial Times, Esquire, and Mr. Porter.
If you have a style question, search:
https://dieworkwear.com/ | https://putthison.com/start-here/
Head of data journalism at The Economist