
Journal of Psycholinguistic Research is doing some major shaping up; Brysbaert and Folk outline new editorial guidelines to promote robust, reproducible quantitative research with strong conceptual foundations:
link.springer.com/article/10.1...

@dylanburton.bsky.social
Assistant Professor at Georgia State University. MSU and Lancaster alum. My research focus is on language testing and assessment. Learn more about me here: https://dylanburton.hcommons.org
Journal of Psycholinguistic Research is doing some major shaping up; Brysbaert and Folk outline new editorial guidelines to promote robust, reproducible quantitative research with strong conceptual foundations:
link.springer.com/article/10.1...

Check out my new article! Here I look at nonverbal behaviors that listeners mention most often when listening to L2 speech and how they perceive their function in communication.
onlinelibrary.wiley.com/doi/10.1002/...

Check out Lynda Taylor's piece in #LanguageTesting on what it means to be a member of a professional association in our field. doi.org/10.1177/0265... (1/2)
18.12.2025 05:16 — 👍 3 🔁 2 💬 1 📌 0
This pioneering Virtual Special Issue by Salomé Villa Larenas on the #GlobalSouth is consequential in bringing to light regional disparities in our journal and field and in shifting the focus to underrepresented contexts. doi.org/10.1177/0265... (1/4)
18.12.2025 05:12 — 👍 2 🔁 2 💬 1 📌 0
screenshot of my post
Big new blogpost!
My guide to data visualization, which includes a very long table of contents, tons of charts, and more.
--> Why data visualization matters and how to make charts more effective, clear, transparent, and sometimes, beautiful.
www.scientificdiscovery.dev/p/salonis-gu...
Do you know Zoom & other companies are encouraging discrimination against employees for things like "pausing too long" or not sounding sufficiently "charismatic"? Read all about our dystopian present in my new paper, out today in JASA!
(Seriously, read it. It's important)
doi.org/10.1121/10.0...

How do untrained listeners report using nonverbal behavior in their perceptions and judgements of L2 ability? I explore this topic and more in my latest article just out in The Modern Language Journal. Read more here: onlinelibrary.wiley.com/doi/10.1111/...
11.11.2025 15:06 — 👍 3 🔁 0 💬 0 📌 0Congrats to guest editors Eunice Jang, Yasuyo Sawski & all authors on this blockbuster issue of #LanguageTesting on the AI revolution! It’s a hefty issue with 7 articles, an opening Editorial & an insightful post-script by @lukeharding.bsky.social. Now out here: journals.sagepub.com/toc/LTJ/curr...
28.10.2025 07:28 — 👍 6 🔁 2 💬 0 📌 0We recruited a large number of layperson listeners to complete transcriptions (one utterance at a time) and comprehensibility ratings of archived Aptis responses and compared those listener-based measures to official scores. Methodologically this is one of my favorite projects!
17.10.2025 18:53 — 👍 0 🔁 1 💬 0 📌 0
Our new study on intelligibility and comprehensibility in the @britishcouncil.bsky.social Aptis General exam is out now in SiLA. Intelligibility distinguishes A1/above A1, but it's generally comprehensibility that is associated with higher levels of performance.
www.altaanz.org/7_sila_14_1_...
Sycophantic LLMs rob us of the chance to practice what makes us human: thought, revision, interaction, introspection. I’m much more worried about everyone losing those skills than I am about a Terminator-style end of the world.
17.10.2025 12:11 — 👍 80 🔁 28 💬 2 📌 1
Accurate.
#academia #academy #philsky #philosophysky #philosophy #science
Happy to announce that our article (w/ Sandra Götz & @pekkalintunen.bsky.social) exploring L1 & L2 speech #fluency in monologue + dialogue is now out in SSLA (OA)! Part of the recently completed #FDF2 project (funded by the Research Council of Finland). #FlowLangGroup @utu.fi doi.org/10.1017/S027...
08.10.2025 13:07 — 👍 12 🔁 2 💬 1 📌 0ggplot2 4.0.0 is out and the new `paper`, `ink`, `accent` theme variables look super cool! Just pick 2-3 colors 🎨 to make your plots look great! I'm excited to hook this up to brand.yml 😉
11.09.2025 12:49 — 👍 72 🔁 18 💬 1 📌 0Have One On Me compite con Vulnicura por disco de desamor ❤️
27.08.2025 13:37 — 👍 1 🔁 0 💬 1 📌 0
Models as Prediction Machines: How to Convert Confusing Coefficients into Clear Quantities Abstract Psychological researchers usually make sense of regression models by interpreting coefficient estimates directly. This works well enough for simple linear models, but is more challenging for more complex models with, for example, categorical variables, interactions, non-linearities, and hierarchical structures. Here, we introduce an alternative approach to making sense of statistical models. The central idea is to abstract away from the mechanics of estimation, and to treat models as “counterfactual prediction machines,” which are subsequently queried to estimate quantities and conduct tests that matter substantively. This workflow is model-agnostic; it can be applied in a consistent fashion to draw causal or descriptive inference from a wide range of models. We illustrate how to implement this workflow with the marginaleffects package, which supports over 100 different classes of models in R and Python, and present two worked examples. These examples show how the workflow can be applied across designs (e.g., observational study, randomized experiment) to answer different research questions (e.g., associations, causal effects, effect heterogeneity) while facing various challenges (e.g., controlling for confounders in a flexible manner, modelling ordinal outcomes, and interpreting non-linear models).

Figure illustrating model predictions. On the X-axis the predictor, annual gross income in Euro. On the Y-axis the outcome, predicted life satisfaction. A solid line marks the curve of predictions on which individual data points are marked as model-implied outcomes at incomes of interest. Comparing two such predictions gives us a comparison. We can also fit a tangent to the line of predictions, which illustrates the slope at any given point of the curve.

A figure illustrating various ways to include age as a predictor in a model. On the x-axis age (predictor), on the y-axis the outcome (model-implied importance of friends, including confidence intervals). Illustrated are 1. age as a categorical predictor, resultings in the predictions bouncing around a lot with wide confidence intervals 2. age as a linear predictor, which forces a straight line through the data points that has a very tight confidence band and 3. age splines, which lies somewhere in between as it smoothly follows the data but has more uncertainty than the straight line.
Ever stared at a table of regression coefficients & wondered what you're doing with your life?
Very excited to share this gentle introduction to another way of making sense of statistical models (w @vincentab.bsky.social)
Preprint: doi.org/10.31234/osf...
Website: j-rohrer.github.io/marginal-psy...

cover of the journal Studies in Second Language Acquisition
New issue of Studies in Second Language Acquisition now available
📚 cup.org/47eF6ql
#SSLA #appliedlinguistics #LangSky
While I'm dispensing computer advice, to any new graduate students:
Save all your article PDFs using the same template. I like LASTNAME YEAR SHORT TITLE/DESCRIPTION, like
Labov 1963 Marthas Vineyard
Save them all in just one giant folder, not piecemeal by class. Thank me when you're tenured.
The new Cracker Barrel logo is the visual version of a 50 year old saying skibidi.
21.08.2025 22:14 — 👍 1 🔁 1 💬 0 📌 0
{tinytable} 0.13.0 for #RStats can now draw interactive tables with sorting, filtering & pages!
And the 📦 is still an ultra-simple, powerful, and 0-dep way to create beautiful tables in basically any format: tex, typ, docx, pdf, png, md, etc
Gallery & Docs: vincentarelbundock.github.io/tinytable/
Papers often conclude "more research is needed" without explanation. This is a missed opportunity. You are the expert. This is your time to shine. Explain what the remaining uncertainties are, and give justified recommendations on what the research needed to resolve them should look like.
11.08.2025 07:01 — 👍 159 🔁 30 💬 13 📌 6
I've said it before, and I will say it again:
It's astonishing how emotionally aversive revisions are, even in the best possible case (reviewers are positive and have very actionable remarks).
Or at least that's how I work; if anybody has some good recommendations for coping, do let me know 😂
I shouldn't wade into this discourse, but LANGUAGE CHANGES and old people always hate what kids are doing. This is fine, especially if the author intends it to be euphemistic. Language policing always ends in systematic discrimination against marginalized people. We don't want to go down this road!
07.08.2025 01:22 — 👍 105 🔁 18 💬 7 📌 6
Now available in OnlineFirst, Shungo Suzuki and colleagues propose a new approach to weakness identification for L2 speaking skills in diagnostic language assessment (DLA), with an AI-driven DLA program that uses contextualized diagnostic feedback to improve lexical use. doi.org/10.1177/0265...
05.08.2025 03:38 — 👍 1 🔁 1 💬 0 📌 0
At this point, I might as well --
Here's an infographic showing different ways to include age as a predictor. The top shows two extremes, just as a plain old numerical predictor (imposes linear trajectory) vs. categorical predictor (imposes nothing whatsoever). And then three solutions in between!
Call for Special Issue abstracts is now open! The Language Testing Special Issue theme of 2027 is “Language Assessment and Policy”. Abstract submission deadline: October 1, 2025. journals.sagepub.com/page/ltj/spe...
08.07.2025 20:57 — 👍 2 🔁 3 💬 0 📌 1
Our study of English proficiency tests in US R1 university admissions circa late 2023 has been published in #LanguageTesting. Some highlights:
- TOEFL, IELTS, DET, PTE are most widely used
- Most institutions accept around 5 different tests
- Some mismatches in cut scores across tests
...
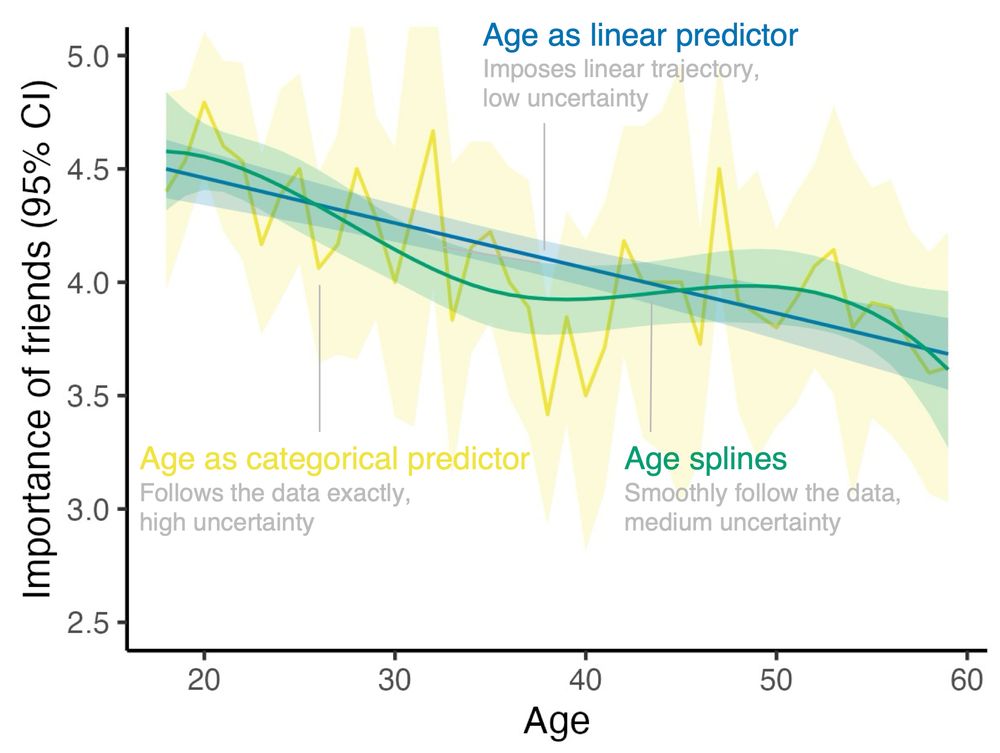
Plot that depicts the average importance people in my data assign to their friendships (y-axis, on a scale from 1 to 5, depicted with 95% confidence intervals) by their age (x-axis, from 18 to 60). Depicted are 3 different ways to model importance of friends as a function of age. Using age as a linear predictor: this imposes a linear trajectory which comes with very tight confidence intervals (i.e., uncertainty is low). Using age as a categorical predictor: this imposes no trajectory whatsoever but instead simply reproduces the means by age. The confidence intervals are very wide, in particular for those ages not well represented in the data (i.e., uncertainty is high). Age splines: This results in a smooth trajectory that follows some of the bumps in the data, but not all of them. The confidence intervals are somewhere between the linear and the categorical case (i.e., uncertainty is medium)
Let's say you want to include age as a predictor in your model. How do you do that?
Here's an illustration of three options -- it's for a paper I'm working on (so if you feel like anything could be tweaked...).
Now available in Online First, Michael Suhan and Mikyung Kim Wolf compare the performance of GPT-4, human ratings, and an existing automated writing evaluation model in scoring the writing responses of young EFL learners on the TOEFL Junior Writing rest.
journals.sagepub.com/doi/10.1177/...
![What can be learned when multiple analysts arrive at different estimates
Kowall et al. (2025) have brought the multi-analyst approach to epidemiology, with instructive results. With this approach, multiple researchers analyze the same data set to answer the same research question. Or, at least, what appears to be the same research question. In fact, the very first paper that popularized this approach [1] has been criticized for using a vague research question (“Are soccer referees more likely to give red cards to players with dark skin tone than light skin tone?”), which apparently led the analysts to try to answer quite different questions—from a simple question about a bivariate statistical association to much more complex causal questions about racial bias [2].
In contrast, the research question passed on to analysts in Kowall et al. (2025) seems less ambiguous: Does marital status influence the incidence of cardiovascular disease? But less ambiguous does not equal unambiguous. Considerable...](https://cdn.bsky.app/img/feed_thumbnail/plain/did:plc:gz53felr7btxgmbxae5aooxi/bafkreidvs4c7wvoh63tr2ptmvnnl5hya246ofttwyzlvotkmqhnpwgbf4a@jpeg)
What can be learned when multiple analysts arrive at different estimates Kowall et al. (2025) have brought the multi-analyst approach to epidemiology, with instructive results. With this approach, multiple researchers analyze the same data set to answer the same research question. Or, at least, what appears to be the same research question. In fact, the very first paper that popularized this approach [1] has been criticized for using a vague research question (“Are soccer referees more likely to give red cards to players with dark skin tone than light skin tone?”), which apparently led the analysts to try to answer quite different questions—from a simple question about a bivariate statistical association to much more complex causal questions about racial bias [2]. In contrast, the research question passed on to analysts in Kowall et al. (2025) seems less ambiguous: Does marital status influence the incidence of cardiovascular disease? But less ambiguous does not equal unambiguous. Considerable...
Kowall et al. published a multi-analyst epi study on the effect of marital status on cardiovascular disease (link.springer.com/article/10.1...). What can be learned from this effort? Check out our new commentary! link.springer.com/article/10.1...
with @mendelrandom.bsky.social & Marcus Munafò
