CATL has been an impressive company long before Trump 2.0
20.05.2025 04:50 — 👍 1 🔁 0 💬 0 📌 0
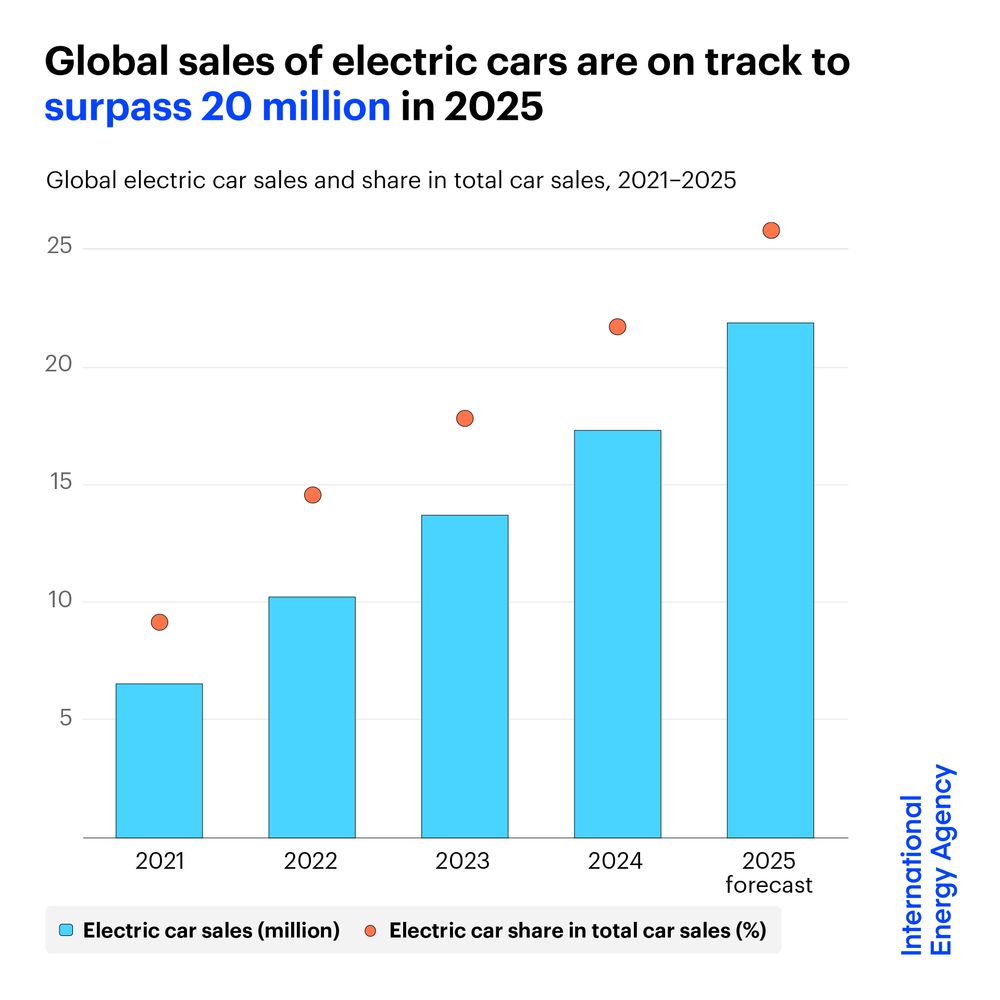
Global sales of electric cars continue to break records 🚘
In 2024, 1 in 5 cars sold worldwide was electric. In 2025, it's set to be more than 1 in 4.
Total electric car sales are on track to exceed 20 million this year despite economic uncertainties → iea.li/4mfHty3
19.05.2025 13:15 — 👍 16 🔁 11 💬 1 📌 0
Besides, UK fishing industry accounts for only about 0.03 per cent of Britain’s national output 🤷♂️
19.05.2025 11:46 — 👍 1 🔁 0 💬 0 📌 0
Thanks, had no idea the two deals were linked
17.05.2025 10:33 — 👍 1 🔁 0 💬 0 📌 0
Why would that be the case? I understand the country show has been going on since 1967, and it’s a completely different setup
17.05.2025 08:59 — 👍 0 🔁 0 💬 1 📌 0
Current planning law allows for 28 days a year of commercial activities.
De-installation of the festivals meant temporary commercial usage of the park was expected to be 37 days this year.
Hence the judge’s decision.
17.05.2025 06:55 — 👍 0 🔁 0 💬 0 📌 0
From the FT today: “Protect Brockwell Park has maintained that it is not opposed to festivals being held in the park and has pointed to their lucrative commercial aspects.”
17.05.2025 06:53 — 👍 1 🔁 0 💬 2 📌 0

Beautiful to see resistance to the privatisation of public space in Brockwell Park spreading! 🔥
14.05.2025 21:04 — 👍 32 🔁 3 💬 3 📌 0
Great write-up from the FT on the role of flexibility in the UK energy system.
Proposed angle for a follow-up explainer article: “How can technology help Britons save on bills and support the energy system - without asking them to change behaviour?”
14.05.2025 13:44 — 👍 1 🔁 0 💬 0 📌 0

I cycled across London to an event this morning, and the many cycle superhighways were all delightfully full of cyclists whizzing (at various speeds, but all faster than the cars) past the car traffic. Londoners clearly want to cycle and it works... more cycle infrastructure, please!
13.05.2025 18:35 — 👍 147 🔁 18 💬 5 📌 0

The parklet in Valley rd is now gone. Anyone knows what happened? It was there yesterday seems unlikely that Lambeth would remove it on a Sunday… @liveablewells.bsky.social @heartstreatham.bsky.social @streathamstuff.bsky.social
11.05.2025 18:29 — 👍 1 🔁 0 💬 2 📌 0
“Why Amazon didn’t show increase from inflation”… the sheer ignorance leaves me speechless
29.04.2025 14:57 — 👍 4 🔁 0 💬 0 📌 0
Starting May I’ll change my weekend subscription to Saturday only 👎
27.04.2025 13:49 — 👍 0 🔁 0 💬 0 📌 0

Only for Italians…
13.04.2025 06:37 — 👍 1 🔁 0 💬 0 📌 0
who moves to Italy expecting lower taxes 🤡
06.04.2025 07:30 — 👍 0 🔁 0 💬 0 📌 0
Donald Trump is Liz Truss
04.04.2025 17:59 — 👍 176 🔁 26 💬 29 📌 3
These damned DEI hires
24.03.2025 20:47 — 👍 1 🔁 0 💬 0 📌 0
Just receive an email from @rippleenergy.bsky.social suggesting they are closing down the business. No official comms here, website etc. Anyone knows more?
20.03.2025 09:26 — 👍 0 🔁 0 💬 0 📌 0
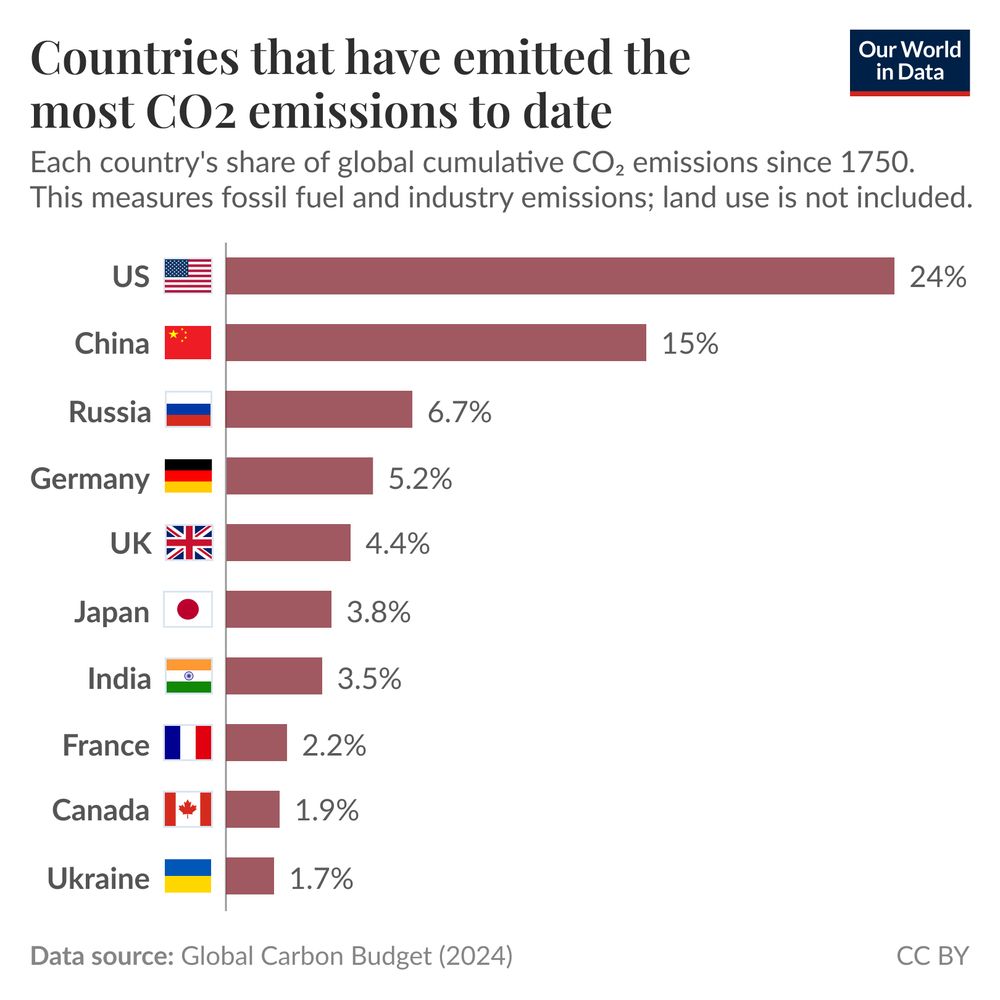
Bar chart titled "Countries that have emitted the most CO2 emissions to date," showing each country's share of cumulative global emissions since 1750. The USA leads with 24%, followed by China (15%), Russia (6.7%), Germany (5.2%), and the UK (4.4%). Other notable countries include Japan (3.8%), France (2.2%), Canada (1.9%), and Ukraine (1.7%). Data reflects fossil fuel and industry emissions, excluding land use, sourced from the Global Carbon Budget (2024).
Which countries have contributed the most to historical CO₂ emissions?
17.03.2025 16:49 — 👍 130 🔁 53 💬 9 📌 4
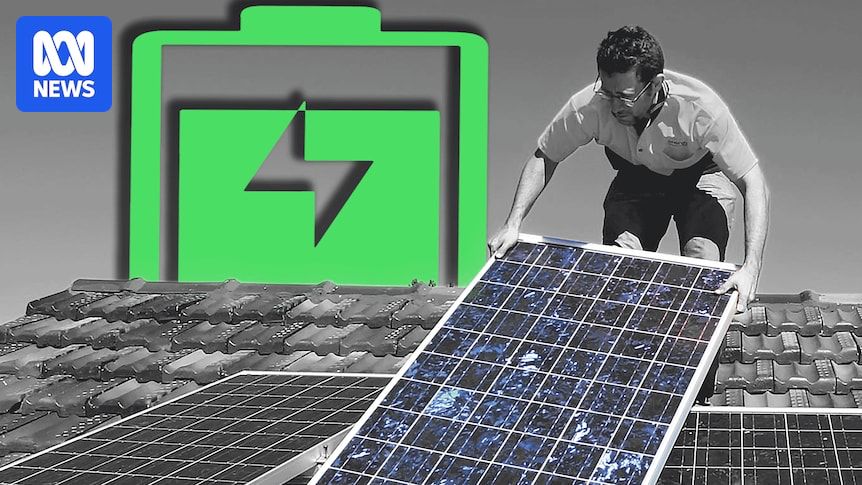
Awesome! Now try adding a battery 🤩
09.03.2025 07:36 — 👍 0 🔁 0 💬 0 📌 0
Are these the same green groups that shut down nuclear in Germany? 🤣
07.02.2025 20:51 — 👍 1 🔁 0 💬 0 📌 0

The world is set to move rapidly into the Age of Electricity
In recent years, electricity rose 2x as fast as total energy demand
But from now to 2035, it's set to grow 6x as fast, driven by EVs, air conditioners, AI & more
More in #WEO24 ➡️ https://iea.li/3EwlYHI
04.02.2025 14:15 — 👍 6 🔁 4 💬 1 📌 0

The world is set to add a huge 5,500 GW of renewable capacity between now & 2030 — even outperforming governments' own national targets
This is equal to the current total power capacity of China, India, the US & the EU combined
More in Renewables 2024 → https://iea.li/42DzwLA
04.02.2025 17:05 — 👍 12 🔁 6 💬 0 📌 1
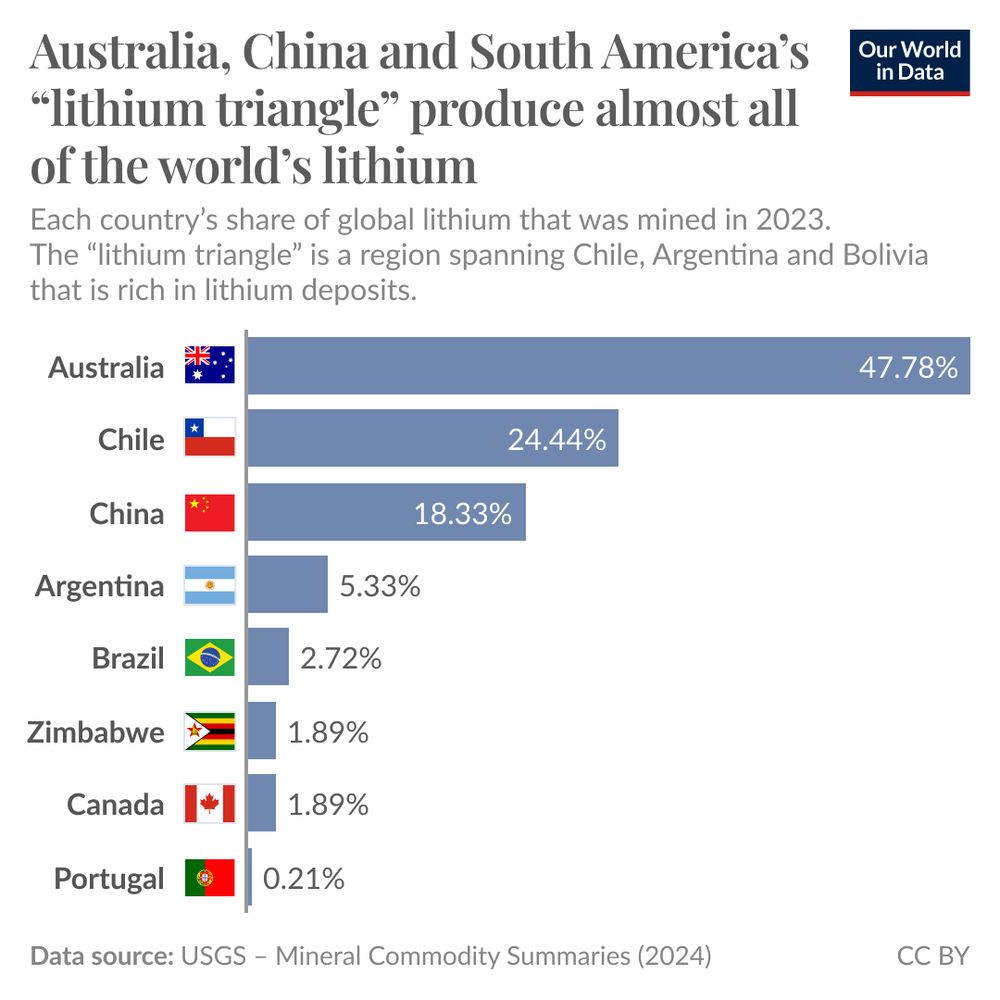
Bar chart showing the global lithium production by country in 2023. Australia leads with 48% of global production, followed by Chile at 24% and China at 18%. Argentina contributes 5.3%, Brazil 2.7%, Zimbabwe 1.9%, Canada 1.9%, and Portugal 0.21%. The chart highlights that Australia, China, and the "lithium triangle" (Chile, Argentina, and Bolivia) dominate lithium production.
The world’s lithium is mined in just a handful of countries
03.02.2025 17:45 — 👍 76 🔁 15 💬 5 📌 3
Darwinism at its finest 👌
01.02.2025 13:16 — 👍 0 🔁 0 💬 0 📌 0

Poland has long had the reputation of Europe's climate laggard.
Not anymore - Poland reduced the share of coal in its electricity mix from 95% in 2000 to 54% in 2024.
Wind+solar are up from 0% in 2000 to 23% in 2024.
Source is @ember-energy.org
31.01.2025 08:14 — 👍 297 🔁 74 💬 11 📌 9
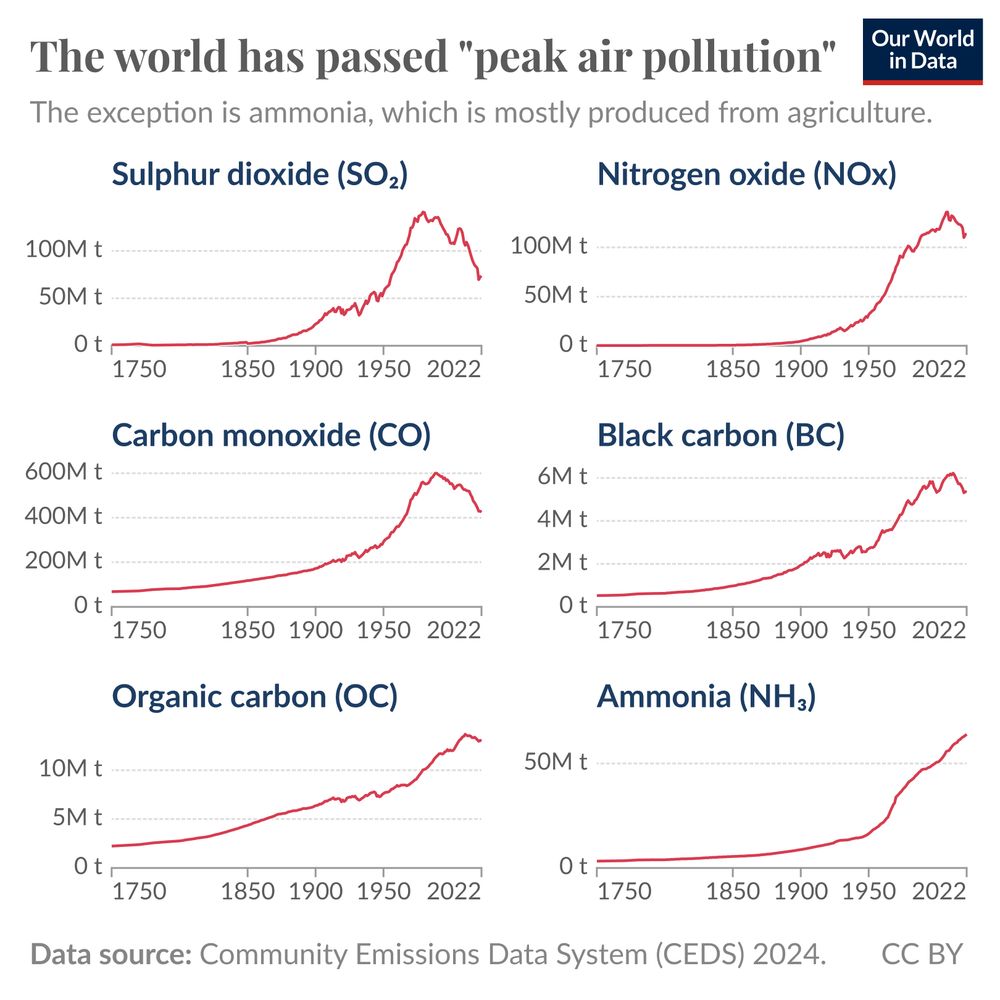
The image shows a series of six line graphs depicting the trends in global emissions of different pollutants from 1750 to 2022. The title reads "The world has passed 'peak pollution'," indicating that emissions of several pollutants have declined since their peak levels, except for ammonia.
The pollutants shown are:
- Sulphur dioxide (SO₂) – peaked in the mid-20th century and has since declined.
- Nitrogen oxide (NOx) – followed a similar pattern, peaking around the late 20th century and then dropping.
- Carbon monoxide (CO) – peaked mid-20th century and declined.
- Black carbon (BC) – shows a rise until recently, followed by a drop.
- Organic carbon (OC) – has risen steadily with a recent plateau.
- Ammonia (NH₃) – continues to rise without a recent decline.
The world has probably passed “peak air pollution”
28.01.2025 19:09 — 👍 332 🔁 132 💬 7 📌 19
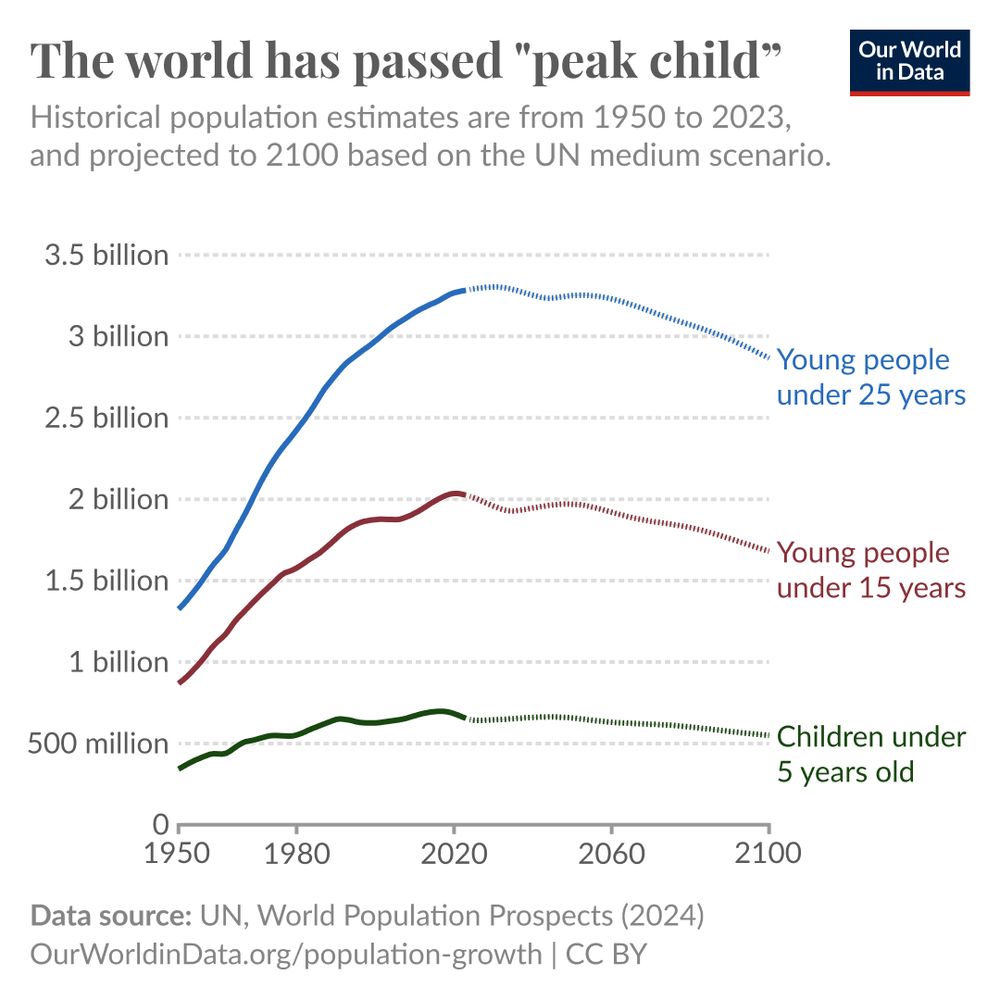
This chart titled "The world has passed 'peak child'" shows the historical and projected population of three age groups: young people under 25 years, young people under 15 years, and children under 5 years. Data spans from 1950 to 2100, based on UN estimates and projections.
The blue line represents the population under 25 years, showing steady growth until around 2050 when it starts to slightly decline.
The red line represents those under 15 years, peaking around 2020, and then gradually declining after that point.
The green line shows children under 5 years, which has largely plateaued since the 1990s and is projected to decrease over time.
The chart indicates that the global number of children has reached its peak, and a long-term decline in younger populations is expected.
The world has passed “peak child”
13.01.2025 18:18 — 👍 223 🔁 80 💬 10 📌 34
The Friends of Streatham Hill Theatre (FoSHT) are campaigning to save this "sleeping beauty" theatre for the community. Find more at http://streathamhilltheatre.org
The inside track on Labour party news + debate.
News, tipoffs, op-eds or ideas to share? We're at mail@labourlist.org.
Labour is the party of working people.
labour.org.uk
Unofficial account until Labour make an official BlueSky account.
Independently championing Labour Party values for a fairer society. Not affiliated with official Labour Party. Join us in amplifying voices, championing policies, and working towards a brighter future.
At E.ON Next, we make new energy work. For customer support, contact us on WhatsApp 0808 501 5200.
Doting grandmother, among other things.
Co-founder at Asana and Good Ventures.
Independent magazine celebrating Streatham and sharing local news and views. Read the latest issue online https://linktr.ee/Heartstreatham
London’s Walking & Cycling Commissioner
Working with the Mayor, TfL & boroughs to build a safer, greener & healthier city.
Posts, errors & typos all mine.
Informal Streatham updates
Labour councillor in Lambeth (inner London borough UK). Deputy Leader & Cabinet lead for Sustainable Lambeth & Clean Air. Social & policy Researcher. Interested in public health & behaviour change.Trade Unionist. Fan of tactical urbanism (and cats!) 🐈⬛ 🌳🐝🌹
whatever you love, you are
BBC US Special Correspondent | MSNBC Contributor | Host, The Rest is Politics US | NYT Bestselling Author
https://youtube.com/@restpoliticsus?si=jWe9uSTQSAWtk5dE
Katty Kay + Anthony Scaramucci's insider/outsider take on politics. Uncovering secrets from inside the Biden and Trump inner circles. Powered by Fuse Energy⚡️
linktr.ee/restispoliticsus
A view on politics at home & abroad, while bringing back the lost art of disagreeing agreeably with Rory Stewart & Alastair Campbell. Powered by Fuse Energy⚡
https://linktr.ee/RestIsPolitics
Artist whose mediums include film, tv, and soda. www.StillersSoda.com
Believe in yourself! Work hard, never give up & anything's possible! OR: Kick back, relax & aim low: You'll never be disappointed...😜 I IGNORE ALL DMs!