Introducing the Data Explorer in Positron!
Quickly view raw data files (CSV, Parquet, etc.) or dataframes from your #Python / #RStats sessions with a data grid, summary panel, and filter bar.
Learn more: positron.posit.co/data-explore... #Positron
30.07.2025 18:39 — 👍 85 🔁 15 💬 3 📌 2
die Abstandsregeln halten ~ to follow the social distancing rules or only Abstand halten ~ keep distance.
05.06.2025 16:53 — 👍 1 🔁 0 💬 0 📌 0
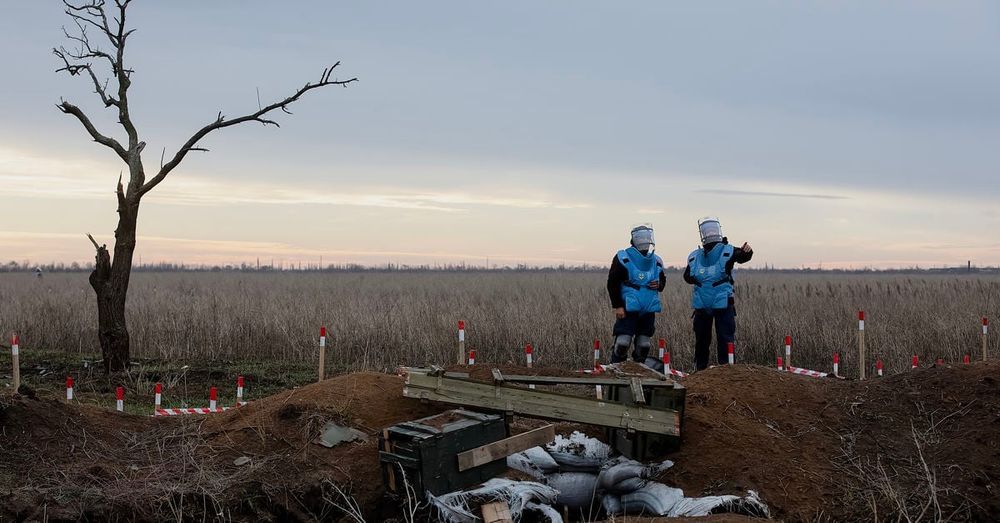
2025 Global Report on Internal Displacement (GRID)
The 2024 Global Report on Internal Displacement (GRID) report presents the data and analysis behind the 75.9 million people living in internal displacement as of the end of 2023. It is the ninth editi...
🚨 OUT NOW: Global Report on Internal Displacement 2025
A record 83.4 million people were living in internal displacement at the end of 2024. Over the past six years alone, this number has doubled.
Explore the data, trends & insights from #GRID2025 👇
bit.ly/3YIDHTP
13.05.2025 05:14 — 👍 4 🔁 4 💬 0 📌 2
Gottfried Achenwall - Wikipedia
#TodayinHistory #dataviz #Onthisday #OTD 📊
💀May 1, 1772 Gottfried Achenwall died in Göttingen, Germany 🇩🇪
1748: First use of the term "statistik,'' meaning numbers of the state. Some call him the 'father of statistics'
bit.ly/4m2w3O8
02.05.2025 00:21 — 👍 7 🔁 3 💬 0 📌 0

Portrait of C. F. Gauss on a 10 Mark German banknote, with a normal distribution superimposed on the Göttingen observatory
#TodayinHistory #dataviz #OTD 📊
🎂Apr 30, 1777 Johann Carl Friedrich Gauss born in Braunschweig, Germany 🇩🇪
Discoverer ~1800 of least squares method (w/ Legndre) & connection with the normal (Gaussian) distribution;
later extended to the Gauss-Markov theorem: LS gives best linear unbiased estimate.
01.05.2025 01:06 — 👍 7 🔁 2 💬 0 📌 0
Thank you very much Noah. The points also multiply when clicking, which I implemented to reflect the complexity of the data and how they find some structure and patterns. I will dedicate some time these days to resolve the issue with the points staying behind the text.
19.03.2025 16:24 — 👍 4 🔁 0 💬 0 📌 0
Thank you very much
19.03.2025 16:15 — 👍 3 🔁 0 💬 0 📌 0
I also built this for a research project:
jatorresmunguia.github.io/disease-outb...
19.03.2025 14:44 — 👍 4 🔁 0 💬 0 📌 0
I recently built my website using Quarto, hopefully you find it useful for your workshop:
juan-torresmunguia.netlify.app
19.03.2025 14:43 — 👍 8 🔁 1 💬 5 📌 0
Thank you
19.03.2025 02:54 — 👍 2 🔁 0 💬 0 📌 0
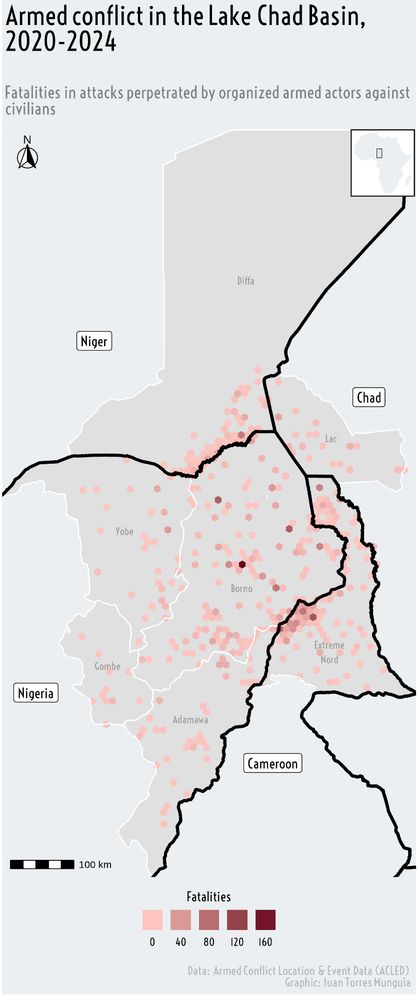
For this week's #TidyTuesday I share a map on armed conflict in the Lake Chad Basin
#humanitarian #conflict #rstats
18.03.2025 22:00 — 👍 8 🔁 2 💬 1 📌 0
Hi, thanks for your comments. Here my answers:
1. Exactly, one block = one country. I will add this note in a newer version of the plot.
2. Definitely warmer and wetter weather contributes to its geographic expansion. I particularly observed this with the Oropouche virus.
15.03.2025 18:19 — 👍 1 🔁 0 💬 1 📌 0
Thank you Libby, I will try to be sharing plots every week.
14.03.2025 02:00 — 👍 0 🔁 0 💬 0 📌 0
Thank you very much
14.03.2025 01:57 — 👍 2 🔁 0 💬 0 📌 0
Thanks
13.03.2025 18:55 — 👍 0 🔁 0 💬 0 📌 0
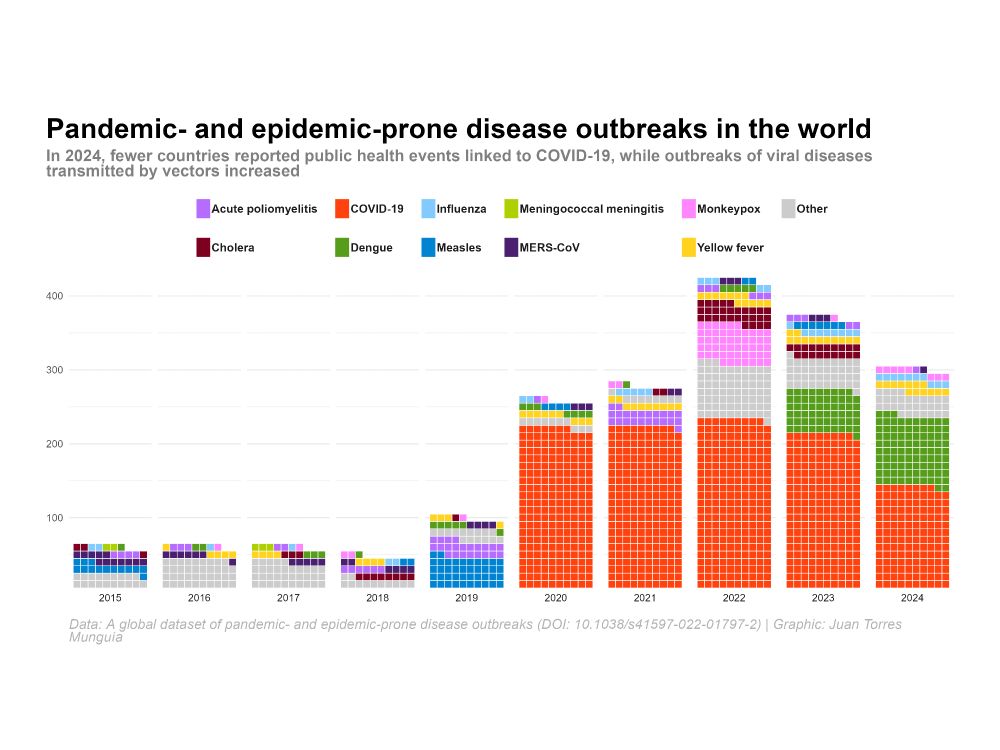
The image is a graphical representation of pandemic- and epidemic-prone disease outbreaks around the world in 2024. It highlights that fewer countries reported public health events linked to COVID-19, while there was an increase in outbreaks of viral diseases transmitted by vectors. The diseases listed include Acute poliomyelitis, COVID-19, Influenza, Meningococcal meningitis, Monkeypox, and others such as Cholera, Dengue, Measles, MERS-CoV, and Yellow fever. The data source is the global dataset of pandemic- and epidemic-prone disease outbreaks, and the graphic was created by Juan Torres Munguía.
Hello Bluesky and #Rstats Community! 🌍
My first post ever is for #TidyTuesday! I created a waffle chart to visualize the distribution of disease outbreaks around the world in 2024.
12.03.2025 22:15 — 👍 23 🔁 4 💬 4 📌 0
The American Statistical Association, the world’s largest community of statisticians and second oldest, continuously operating professional society in the US.
The UK’s largest collection of UK and international social, economic and population data. Funded by UKRI through the ESRC. https://ukdataservice.ac.uk/
We compile and produce high-quality statistics and data through innovation and international collaboration.
🔵 X: @OECD_Stat
🔵 LinkedIn: @OECD Statistics
🔵 Website: oecd.org/en/data
Cuenta oficial del Instituto Nacional de Estadística de España
data; sports; memes; #RStats
qntkhvn.netlify.app
Social Scientist @NotreDame.
Studies misinformation, media literacy, & AI.
Author of Misguided: https://mybook.to/MisguidedBook
https://matthewfacciani.substack.com
www.matthewfacciani.com
survey statistician at blue rose research 🏕
economist, VoxUkraine editor
Data Visualisation Manager at a health think tank 👩💻 Mostly talk about data, #dataviz, #opendata, #maps, #python and #data4good 📈 Into cycling, yoga, sourdough, puns and more. Views my own.
Also active on Mastodon + Linkedin
Statistician (she/her) | #rstats | Posts primarily about statistical ecology and fisheries (and pet chickens)
Interdisciplinary research Center of Excellence based at Charles University. We study international conflict, peace and security.
Writing a data-driven newsletter about economics @ apricitas.io
Nuance? In this Economy
Full Employment Stan, Brazilian Coffee Tariff Victim |
RCSA supports early career researchers in the physical sciences (astronomy, chemistry, physics) at colleges and universities in the U.S. and Canada. Founded in 1912, RCSA is the nation’s oldest foundation dedicated solely to science.
PhD Student in bioinformatics applied to ecotoxicology 🧬🤖 | Passionate about R, Quarto, and reproducible research | I like to draw, hike and collect rocks 🪨
https://ellfranklin.com
Historian. PhD Researcher: University of Amsterdam / NIOD-Institute for War, Holocaust & Genocide Studies. Researching historical narratives in international criminal trials ( #Rwanda / #Cambodia / #ICC)
Professional Association for Memory Scholars
Based in the Netherlands with members from more than 40 countries.
Join the MSA: http://goo.gl/GM5uBb
Deputy Director @UNUWIDER and Professorial Fellow @IDS_UK (on leave). Views are my own.
https://patriciajustino.net/
Prof of Policy & Quantitative Methods at Queen Mary University of London.
PhD Economics, University of Cambridge. Political economy, conflict, migration, gender violence, applied economics.
In my free time, I run, swim, cycle, row & play tennis.
Official account of the Faculty of Economics and Statistics at the University of Innsbruck, Austria.
https://www.uibk.ac.at/en/econstat/