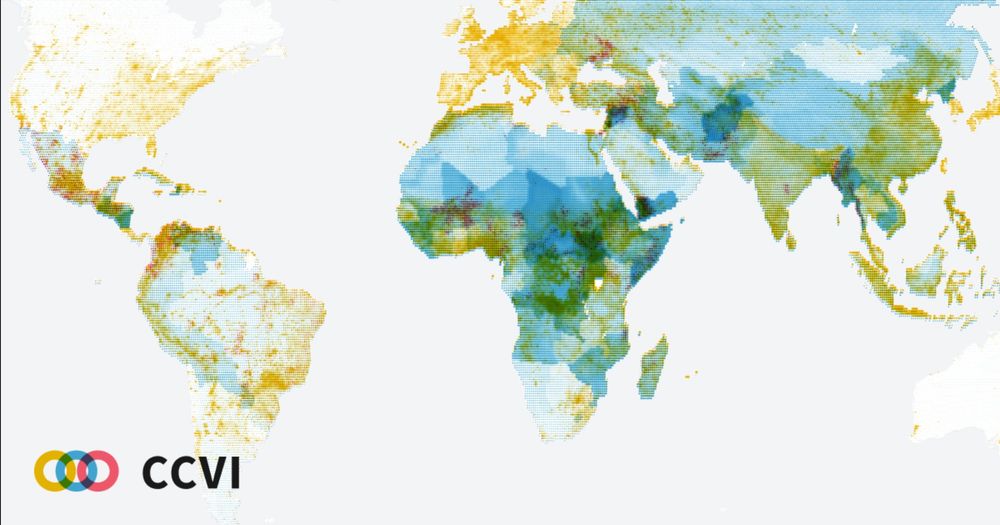
Climate—Conflict—Vulnerability Index (CCVI)
The Climate—Conflict—Vulnerability Index (CCVI) maps current global risks by integrating climate and conflict hazards with local vulnerabilities.
Hi-fives to @laesser.bsky.social, Flavio Gortana and @janjohannes.bsky.social, the team at @diplo.de (@kachumbali.bsky.social, Melchior Reihlen-Börgers, ...) and our research partners at the UniBW Munich and @pik-potsdam.bsky.social!
Find more info about our project here: climate-conflict.org
30.12.2024 13:46 — 👍 9 🔁 1 💬 0 📌 0
@astrodotbuild any tips to create an i18n page with Astro?
28.06.2021 14:57 — 👍 2 🔁 0 💬 0 📌 0
I found a silly bug so that most comic previews looked brownish. It now represents more accurate colors. https://moebius.colortheft.com/#comics/ #moebuis #datavis
01.10.2020 09:20 — 👍 0 🔁 0 💬 0 📌 0

New Project 🥳 I had the pleasure of supporting @moritz_stefaner in the last months. We created a couple interactive and static print charts for the upcoming 175 year anniversary issue of @sciam. It was a pleasure @ChristiansenJen @JenLSchwartz...
18.08.2020 16:29 — 👍 1 🔁 0 💬 1 📌 0

What an honor 😃 Paola Antonelli (MoMA) and Alice Rawsthorn (Chisenhale Gallery) mentioned my covid project "DIE ZEIT und das Coronavirus" at their Design Emergency IGTV: https://www.instagram.com/p/CB3lADblPdX/
#COVID19 #Corona
27.06.2020 07:52 — 👍 1 🔁 0 💬 0 📌 0

So langsam wird auch den Ausbreitung des #Coronaviruses in der Wochenzeitung @DIEZEIT zurückgedrängt ;) Details zur aktuellen Ausgabe unter: http://lab.laesser.net/coronazeit/ #COVID19
15.04.2020 18:13 — 👍 1 🔁 0 💬 0 📌 0
DIE ZEIT und das Coronavirus
Wann und wie hat sich DIE ZEIT mit dem Coronavirus angest...
Die neue @DIEZEIT ist ab heute erhältlich und als Leser habe ich mir angeschaut, wann und wie sie sich mit dem #Coronavirus angesteckt hat. https://lab.laesser.net/coronazeit/#/ #COVID19 #datavis
02.04.2020 08:46 — 👍 0 🔁 0 💬 0 📌 0

My latest lab project is online 🥳 Color Theft lets you steal colors of your favorite artists and make custom pallets. Happy 🔴🟡🔵 picking on tablet and desktop — https://colortheft.com/ #colors #art #threejs #svelte
29.01.2020 14:17 — 👍 0 🔁 0 💬 0 📌 0

Hey, lovely #threejs crowd. I have a short question: I want to identify a particular sphere inside a buffer geometry, The raycaster provides me with a face of a sphere with a faceIndex that doesn’t fit the underlying object/order. What I do wrong ? :)
23.01.2020 16:23 — 👍 0 🔁 0 💬 0 📌 0


The artist color picker is growing. I added a collection preview and export view. I’m looking forward to publishing the first beta in the next week or so. #threejs #sveltejs
23.01.2020 09:07 — 👍 0 🔁 0 💬 0 📌 0

My current spare time project: It is about #artists, their #colors, and finding a way to steal them. #threejs #svelte
20.01.2020 15:51 — 👍 2 🔁 0 💬 0 📌 0
@InfoPlusConf thanks for the great conference. All the people behind the conference did a really great job. You created an open space where we could feel welcome and were able to share ideas. Thanks alot! #infoplus2018
21.10.2018 16:56 — 👍 0 🔁 0 💬 0 📌 0
.@HerrStange and I finalised our prototype for the 3DH project (http://threedh.net/ ). It was interesting to work with the researchers. I learned a lot about user expectations and how to transform them into a working environment. #digitalhumanities #dataviz #prototype
11.06.2018 07:50 — 👍 0 🔁 0 💬 0 📌 0
.@steffenhaensch shows how to combine a design in @figma with an @observablehq notebook to generate a mockup scene
07.06.2018 07:30 — 👍 0 🔁 0 💬 0 📌 0


Small sneak preview of 3DH. @HerrStange and I work on a text annotation #dataviz tool for the University of Hamburg. The tool allows researchers to explore their annotation through different layout to find new correlation. #wip
25.05.2018 13:57 — 👍 0 🔁 0 💬 0 📌 0

Is it okay to fake data for your personal benefit? Looki is first mobile app that simulates user behaviours to protect privacy and open up new possibilities. Get early access at: https://fictional.systems/looki/
22.05.2018 12:31 — 👍 0 🔁 0 💬 0 📌 0

I'm slowly getting to something tangible with my #fictional iphone app. I started with the visual design and thanks to @steffenhaensch it has a name.
09.05.2018 15:53 — 👍 0 🔁 0 💬 0 📌 0

I’m working on my first #fictional iphone app. It imitates user behavior based on generated fake data in order to protect users or give them new possibilities. https://www.instagram.com/p/BiMBhtmjiyn
30.04.2018 08:38 — 👍 0 🔁 0 💬 0 📌 0


An other #Kardashian exploration. You see how they changed the content of their instagram photos over years. The color indicates the day of the year. The second picture shows all 18k photos since 2011. #tsne
05.04.2018 20:42 — 👍 0 🔁 0 💬 0 📌 0


I'm exploring the visual possibilities of machine learning and tsne. Here the Instagram fingerprints of the #Kardashians. The color indicates the age of the image, circle area the likes and thickness of the lines the distance between the clusters.
05.04.2018 08:18 — 👍 0 🔁 0 💬 0 📌 0
Das erste fertige Projekt des Jahre :) Ich hatte die Chance @brandeinswissen bei ihrem Artikel über die Innovativsten Firmen Deutschlands mit Visualisierungen zu unterstützen. Viel Spass beim explorieren! #dataviz
16.02.2018 11:24 — 👍 0 🔁 0 💬 0 📌 0

I feel very honored that you can see my @datastories project, besides works of @kimay, @chrispiecom, @tillnm, @NadiehBremer, @moebio, @bndktgrs and many others, at the exhibition "The Art of Networks" in Boston - http://www.theartofnetworks.com
17.01.2018 08:53 — 👍 0 🔁 0 💬 0 📌 0
#dataviz
08.01.2018 17:42 — 👍 0 🔁 0 💬 0 📌 0

Learning of the day: Double check your data and the insights. I did a small project on shopping pattern and thought that the receipt is ordered by time. No. I rather visualized the supermarket categorization than the interesting shopping patterns: http://a.datavis.club/shopping...
08.01.2018 17:42 — 👍 0 🔁 0 💬 1 📌 0
Scientific content aggregator with custom content feeds. Science news, jobs, events and more. Sign up at https://www.scientific.today.
Visualization researcher based at Inria and Université Paris-Saclay in France.
Attempted Whimsy. Novel experiences.
FILWD on Substack: https://filwd.substack.com/. Weekly post on data visualization and beyond (quite some AI lately).
Data visualizer (teaching, researching, divulging, etc.) Faculty at Northeastern University. Italian. Father of 3.
Professor for Interaction Design at the Fachhochschule Potsdam, Co-Director of the research group Urban Complexity Lab
https://interface.fh-potsdam.de
https://uclab.fh-potsdam.de
https://esono.com
Playing with data, visualizing it for humans at flowingdata.com
Designing, developing, researching and teaching visualizations. Research Professor for visual analytics at Technische Hochschule Mannheim. Co-editor of Making with Data.
https://www.hdilab.org
Professora, atuando com educação especial, esquerda desde que nasci, Lula sempre, por mais educação, cidadania, comida no prato. Nordestina com orgulho. 🚩🚩🚩🇧🇷🇧🇷🇧🇷
Schläft, isst, spielt, denkt, schimpft manchmal, lacht auch, redet auf www.gamespodcast.de über Spiele, liest, guckt, stolpert zuweilen, tut und macht. Wartet darauf, sich endlich wie ein Erwachsener zu fühlen. Das kommt doch jetzt bald, ja?
Shooting the messenger will not solve the problem
Redakteur Investigativ und Daten | Investigative Reporter @DIEZEIT
PGP: 5356 E18D 028D 2A17 D95C 00A9 3816 1797 D451 8B42
Threema: PHT4ZBYM
@kaibiermann@mastodon.online
Product Coach & Consultant
Throwing stickies at Mapper.club
Washington, DC
Award-winning Data Visualization Designer & Data Artist | Founder of Visual Cinnamon | Graduated Astronomer ✨ | Author of "CHART" & "Data Sketches" | 🇳🇱
VisualCinnamon.com
I make art with code http://media.mit.edu http://sfpc.io http://openframeworks.cc http://eyewriter.org http://yesyesno.com email: zach at http://sfpc.io
Data visualization research group at FH Potsdam situated between design, computing, and the humanities.
https://uclab.fh-potsdam.de
Visual Journalism | DDJ | EdTech | OSINT
Das Visuals-Team der Neuen Zürcher Zeitung @nzz.ch
Visualization & data analysis research at the University of Washington. In a prior life was the Stanford Vis Group. https://idl.uw.edu