white leaves on a albino redwood sprout.
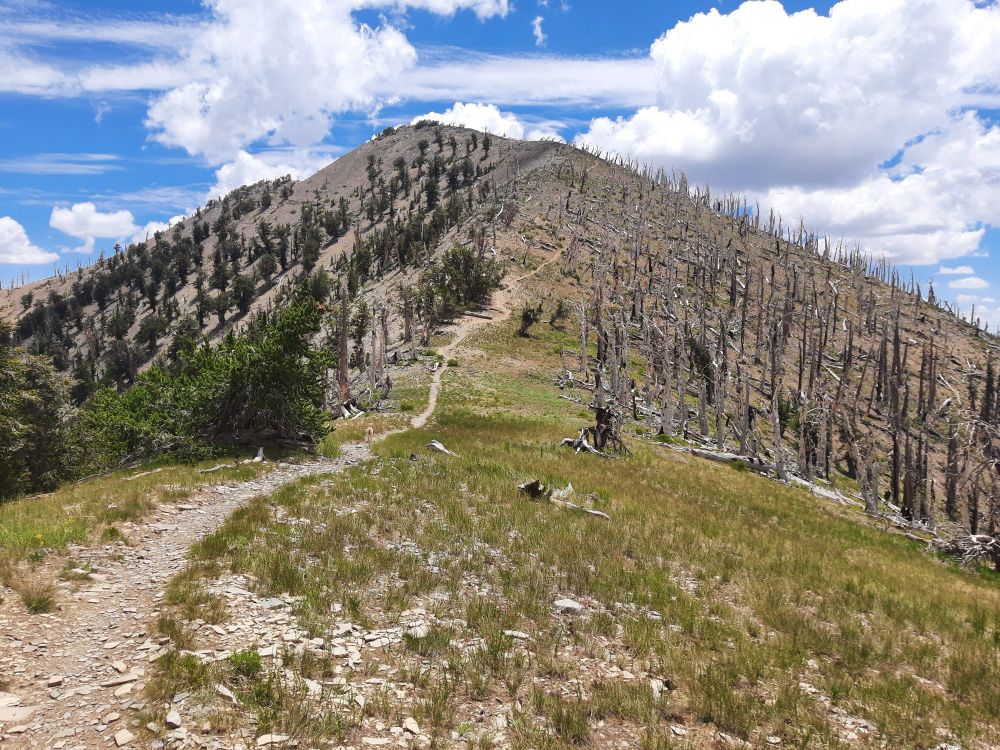
Burned and unburned bristlecone pine along a ridgeline.

Flux tower in Yellowstone National Park
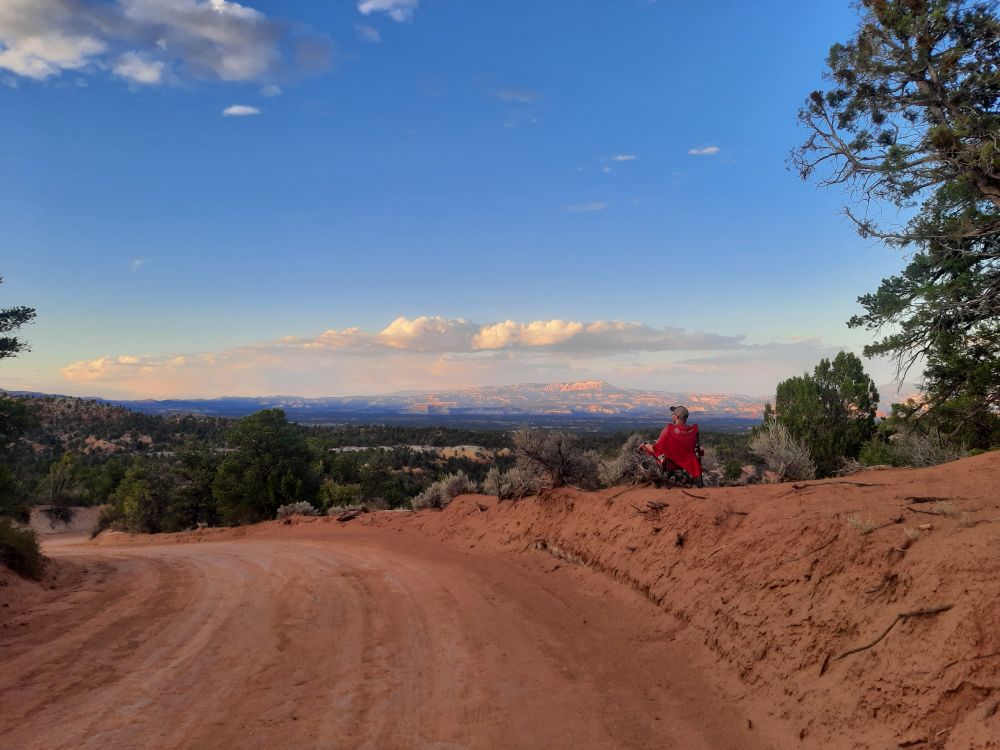
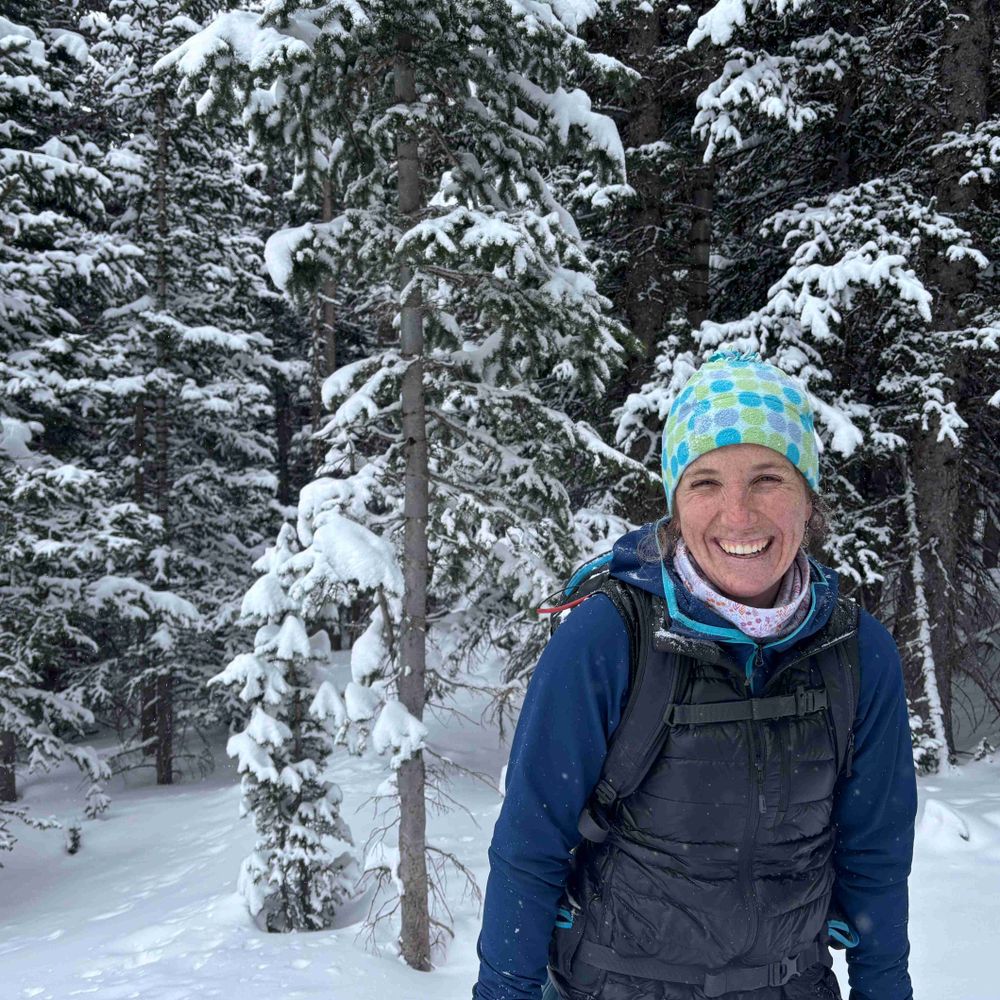
A new phd student enjoying the perks of fieldwork in Grand Staircase Escalante National Monument.
It's possible I will recruit a PhD student this year: If you are interested in tree physiological ecology, Bayesian modelling, carbohydrates, hydraulics, or desert/arid ecology please email with a description of your experience. Application deadline December 15. www.unlv.edu/graduatecoll... 🌏
30.09.2025 16:10 — 👍 18 🔁 8 💬 0 📌 0

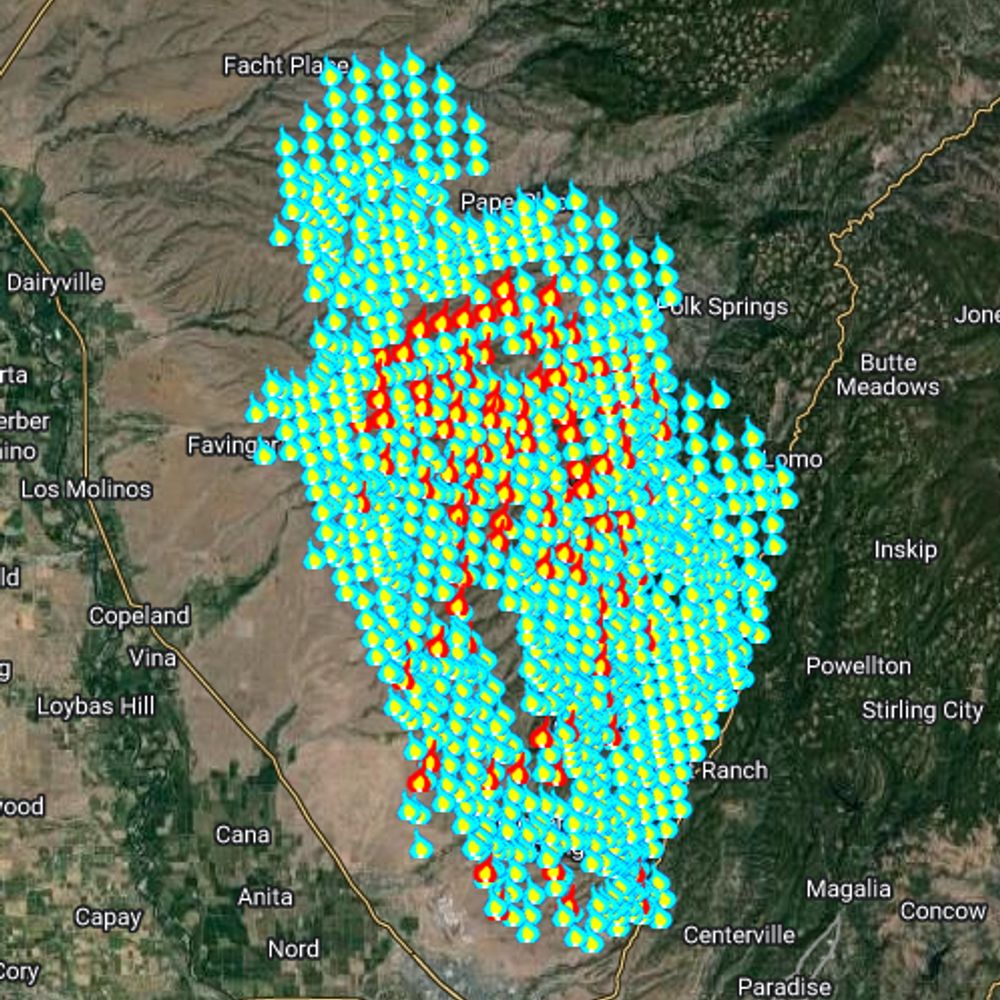
🔥 #AGU25 Session B055
"The Role of #Fire in the Earth System: Understanding Drivers, Feedbacks, and Interactions with the Land, Atmosphere, and Society"
🔗 Submit your abstract by July 30:
agu.confex.com/agu/agu25/pr...
21.07.2025 23:43 — 👍 4 🔁 3 💬 0 📌 1

LA is in a high fire risk region & fire weather conditions are complex. So we @wwattribution.bsky.social looked at many lines of evidence. All show: our burning of fossil fuels increased the likelihood of such extreme fire weather conditions www.worldweatherattribution.org/climate-chan...
29.01.2025 08:04 — 👍 320 🔁 151 💬 7 📌 22

This graphic shows four line graph time series and each are monthly from January 1984 through January 2024. The first graph is a 12-month running mean of global mean surface temperature anomalies. Anomalies are computed relative to a 1991-2020 baseline using ERA5 data. The second graph is monthly carbon dioxide abundance. The CO2 graph is the Keeling Curve. Current levels are 423 ppm. The third graph is monthly global methane abundance. Current levels are 1933 ppb. The fourth graph is monthly global nitrous oxide abundance. Current levels are 337 ppb. The three greenhouse gases show seasonal cycles and long-term increasing trends using data from NOAA ESRL. The global mean surface temperature anomaly record also exhibits decadal variability and a long-term increasing trend. All graphs are rising and shown in four different colors, including white, yellow, orange, and pink.
My climate change dashboard is updated to kick off 2024...
Higher resolution graphic available at zacklabe.com/climate-chan...
25.02.2024 14:26 — 👍 73 🔁 36 💬 0 📌 0