A visualisation of the wine regions of New Zealand three ways.
#rayshader adventures, an #rstats tale
terence
@tterence.bsky.social
smitten with #rstats · associate prof · political economy · the #rayverse's number one fan
@tterence.bsky.social
smitten with #rstats · associate prof · political economy · the #rayverse's number one fan
A visualisation of the wine regions of New Zealand three ways.
#rayshader adventures, an #rstats tale

A visualisation of Shiretoko National Park, Hokkaido, Japan as a series of lines
Shiretoko National Park, Hokkaidō. In lines.
#ggplot2 adventures, an #rstats tale

A visualisation of the wine regions of Spain
A visualisation of the wine regions of Spain.
#rayshader adventures, an #rstats tale


Hive mind, please help me out!
I need a more informative and explicit subtitle for my upcoming #RStats book "Model to Meaning"
The premise is that analysts should often transform coefficient estimates into more meaningful / interpretable quantities like predictions, risk differences, slopes, etc.
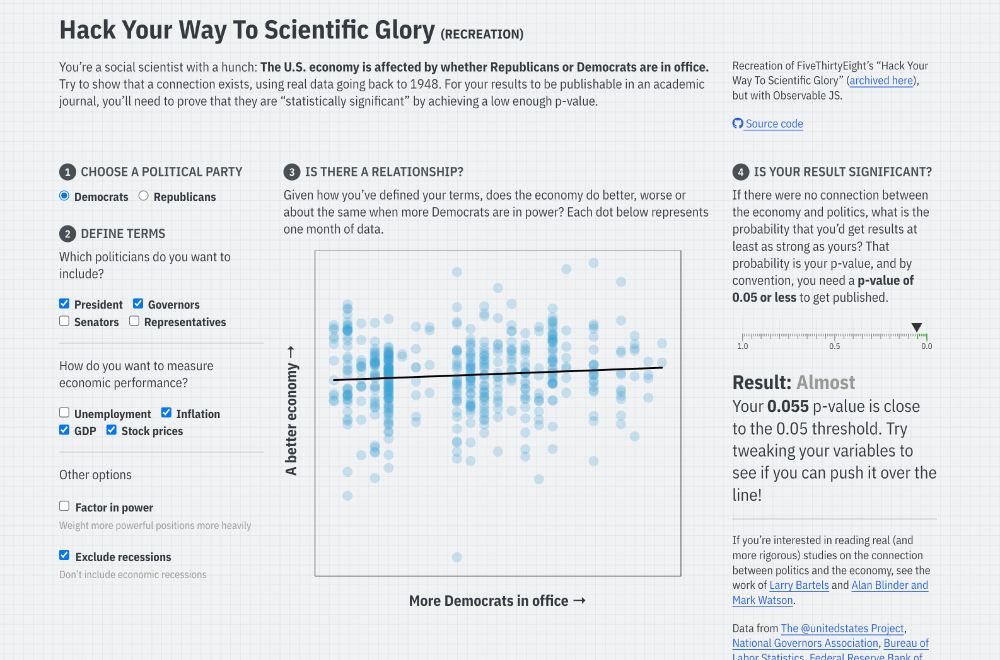
Screenshot of the linked Quarto website, with input checkboxes to change different conditions for a regression model that predicts economic performance based on US political party, with a reported p-value
I’ve long used FiveThirtyEight’s interactive “Hack Your Way To Scientific Glory” to illustrate the idea of p-hacking when I teach statistics. But ABC/Disney killed the site earlier this month :(
So I made my own with #rstats and Observable and #QuartoPub ! stats.andrewheiss.com/hack-your-way/

Excited to announce my hands-on & in person workshop: "Introduction to 3D maps and data visualisation with Blender". You will learn how to create memorable 3D visualisations that stand out. #dataviz
Register here: lu.ma/gtg2elht

A visualisation of country borders in a 1980s retro style of illuminated green lines
Retro world map.
#rayshader adventures, an #rstats tale
I've been working on a history of the tidyverse for an upcoming special issue of the Australia/New Zealand Journal of Statistics celebrating 25 years of R. I'd love to get your feedback! What have I missed?
hadley.github.io/25-tidyverse...
#rstats
Thanks, it's here: zenodo.org/records/7369...
07.02.2025 15:21 — 👍 2 🔁 1 💬 0 📌 0Yes, I keep forgetting. It's here: zenodo.org/records/7369...
07.02.2025 15:20 — 👍 1 🔁 0 💬 1 📌 0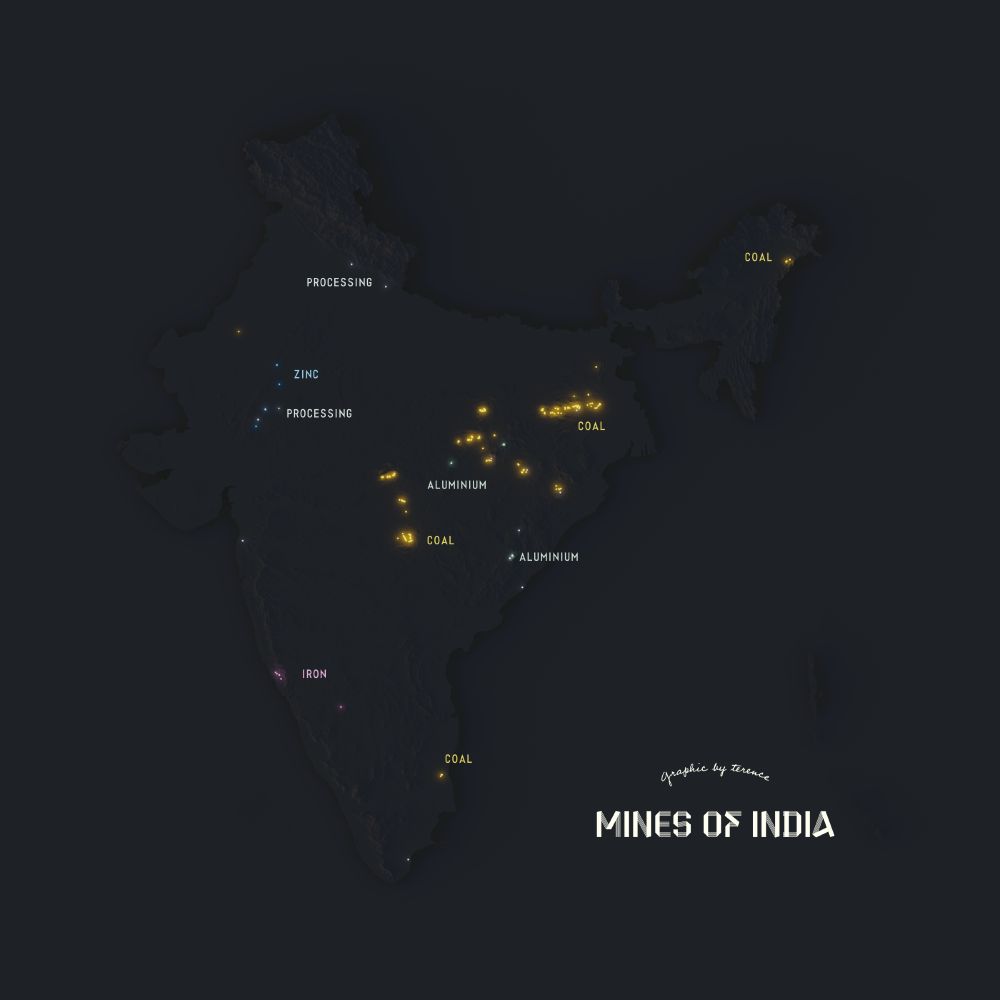
A visualisation of the mines of India
Mines of India.
#rayshader adventures, an #rstats tale
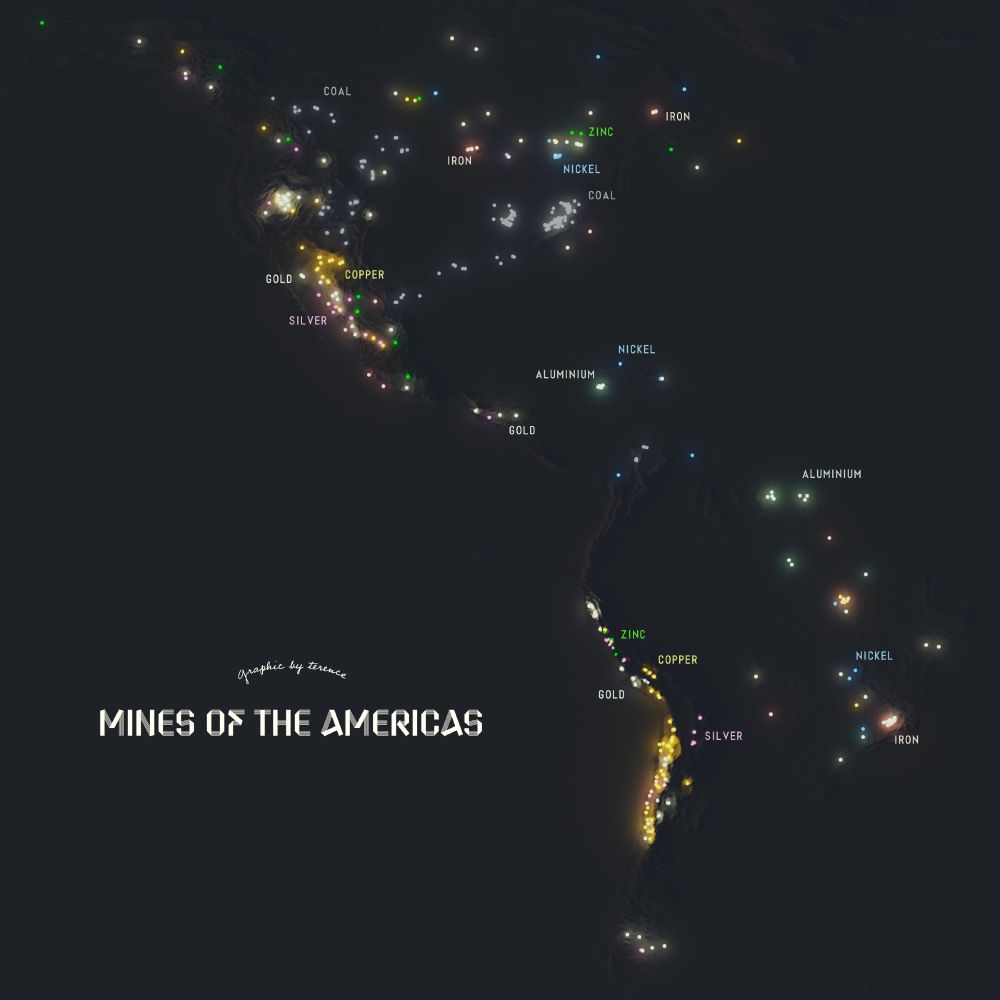
A visualisation of the mines of the Americas
Mines of the Americas.
#rayshader adventures, an #rstats tale
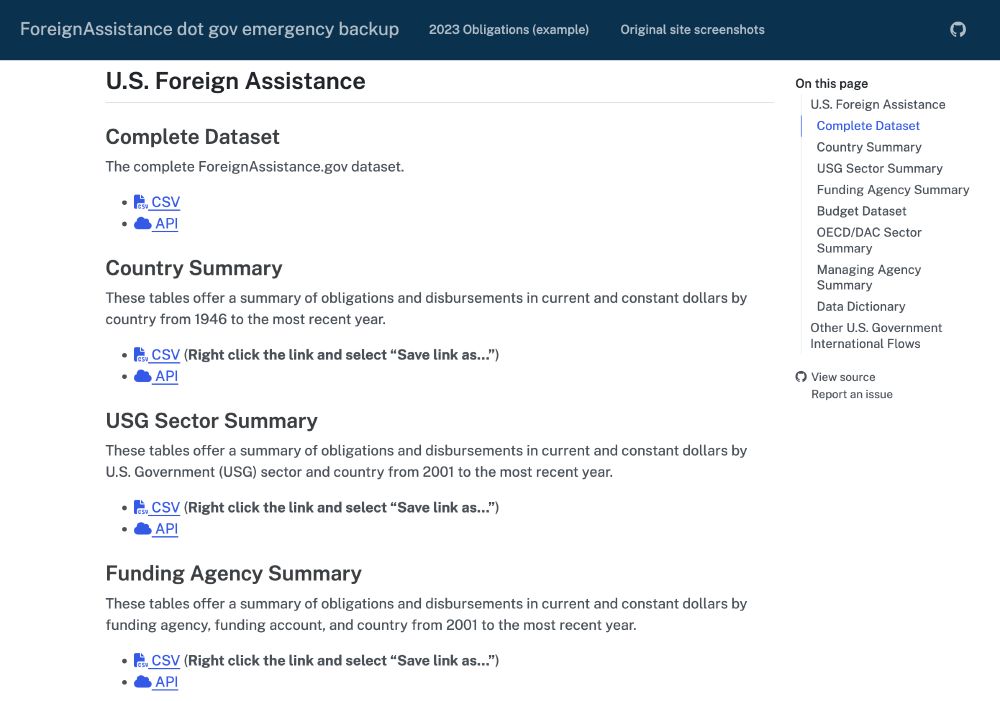
Screenshot from my backup ForeignAssistance dot gov site, with links to different USAID datasets
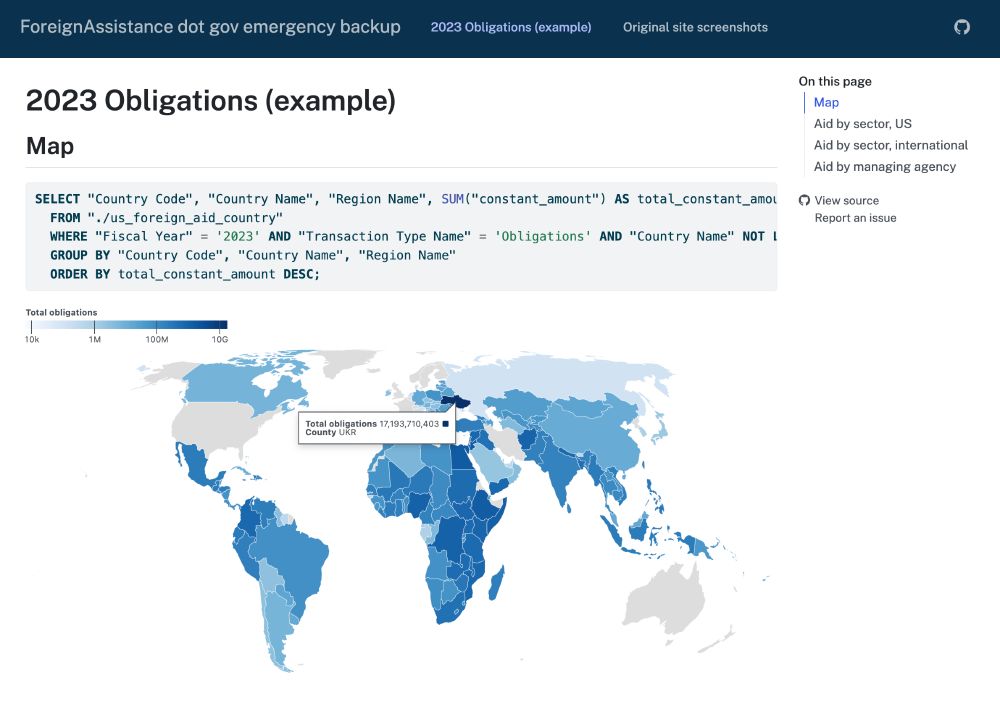
Screenshot from a live map that uses data from the backup API
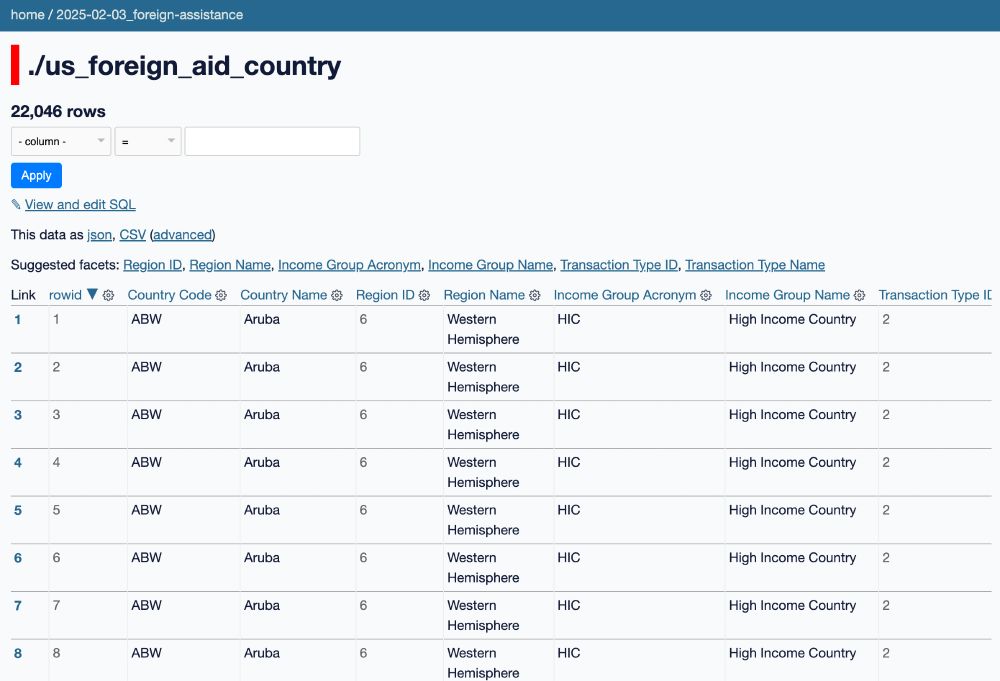
Screenshot of foreign aid by country
The data at USAID's ForeignAssistance dot gov was removed over the weekend, but it seems to be back (for now). As a backup, I've uploaded the data both as static CSV files and a queryable API
- Details: andrewheiss.github.io/foreignassis...
- API: foreignassistance-data.andrewheiss.com
A reminder that {modelsummary}, {tinytable}, and {marginaleffects} are Canadian so if you're an American researcher, you'll have to increase your citations of those #rstats packages by 25%, err, next month.
03.02.2025 23:09 — 👍 88 🔁 13 💬 1 📌 0
A video title screen, showing a few snippets of greyscale maps, and giving the video title: Live Carto #18. Project Walkthrough: Maps for Into the Ice. January 31, 2025, 2pm Central.
You know what I haven't done in almost 900 days? A livestream! Join me on YouTube on January 31st at 2pm Central (UTC - 6), where I'll walk through / break down some monochrome maps I made for a forthcoming book.
(And I'll try to remember how live streaming works).
youtube.com/live/KK5rayw...
a bit more #Severance data
please enjoy all analyses equally
👉 lucymcgowan.github.io/mdr-website/
and for my #rstats friends:
👉 lucymcgowan.github.io/mdr/

A visualisation of the lighthouses of the Canary Islands, Spain
Faros de Canarias.
#rayshader adventures, an #rstats tale

A visualisation of the Gulf of México as illuminated contours
Illuminated contours of the Gulf of México.
#rayshader adventures, an #rstats tale
Happy Lunar New Year!
#rayrender adventures, an #rstats tale
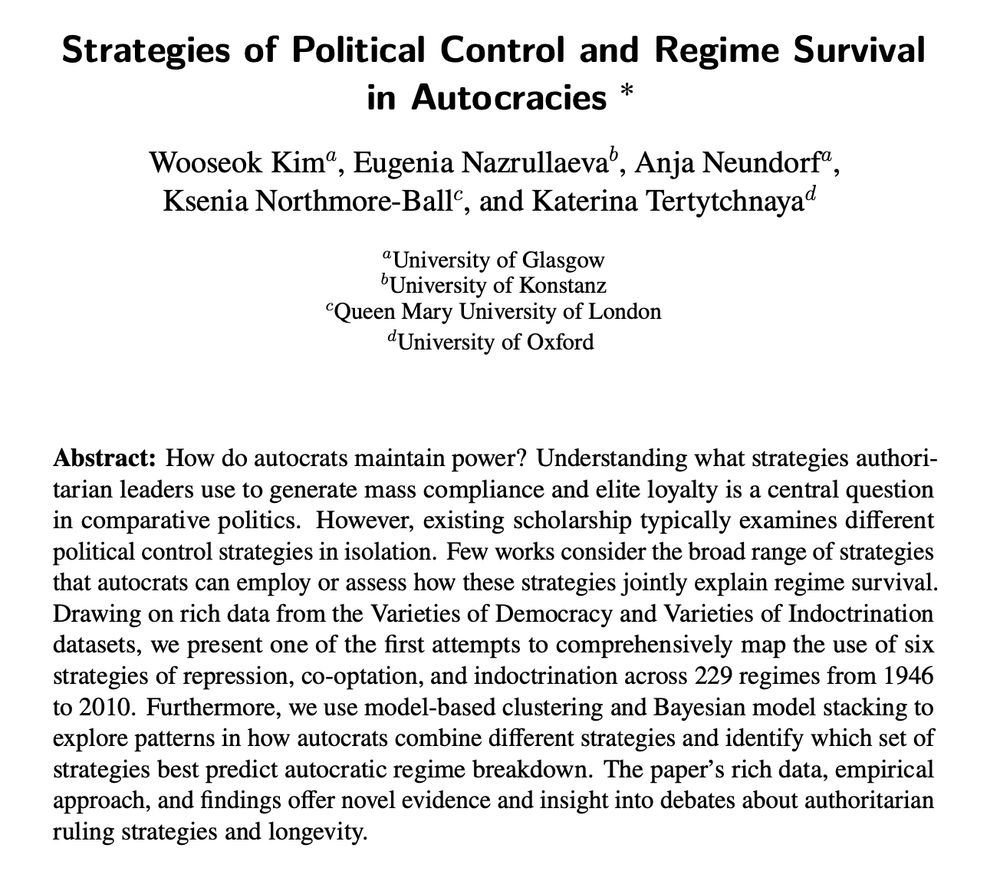
How do autocrats stay in power?
Our new research dives into the strategies of political control—repression, co-optation, and indoctrination—used across 229 autocracies from 1946 to 2010. What we found will change the way you think about authoritarian resilience. 🧵👇
Yep, you need at least three windows of 100+ tabs
17.01.2025 00:41 — 👍 2 🔁 0 💬 0 📌 0Welcome, Helen!
15.01.2025 22:15 — 👍 0 🔁 0 💬 0 📌 0
Hi I'm Helen and I don't know how Bluesky works! I'll be sharing maps & dataviz that I make and love - as well as tutorials on how to recreate them!
These will likely be interspersed with photos of my enormous cat and/or lunch.
Agreed. Kids do love being able to print the photos they take though.
14.01.2025 14:14 — 👍 1 🔁 0 💬 0 📌 0
A screenshot of a tweet by Joshua Stevens that says: "R is a niche language and belongs in the past. It perpetuated through academia (largely poli sci and soft sciences), not by virtue of its innate qualities. The tragedy of R is that many wonderful devs created fantastic libraries, all of which should have been in Python."
Salty dude from ESRI uses popularity to judge the utility of tools. Also fails my freshman methods course with what he thinks science is (hint: it ain't because you use hard objects like pipettes and calipers).
Half-baked trolling attempt; 1.5 out of 5.
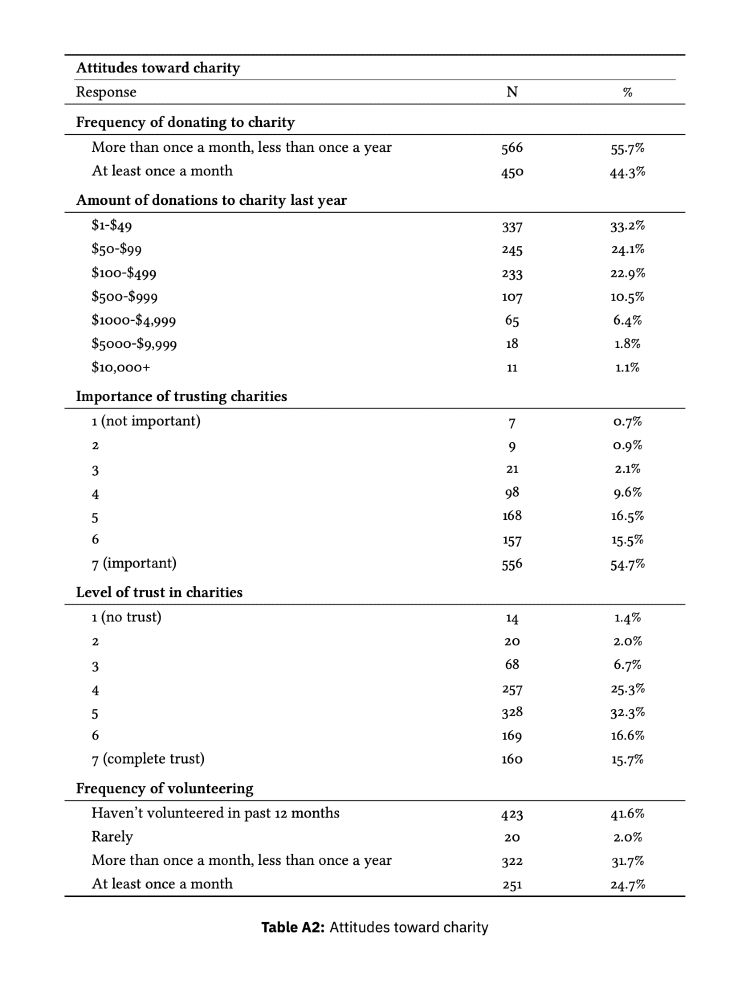
PDF table made with LaTeX and tabularray with {tinytable}
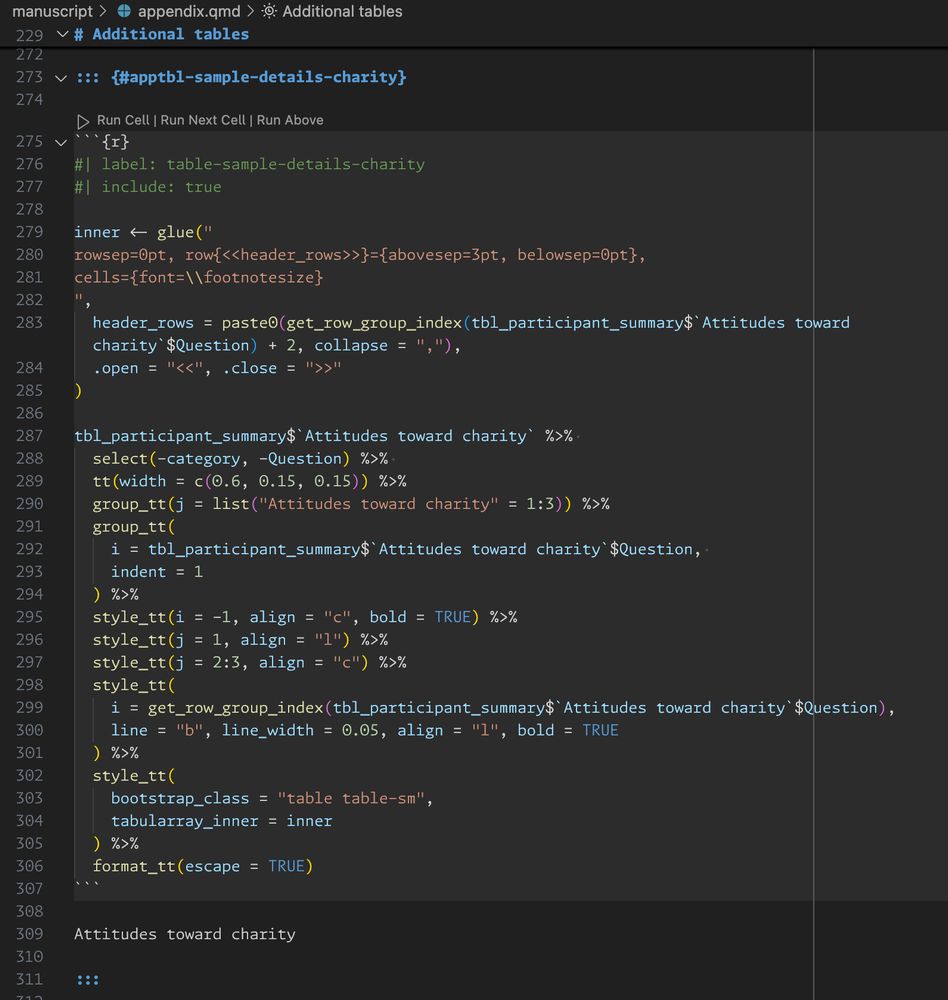
R code for making the table
#rstats and #QuartoPub PSA: @vincentab.bsky.social's {tinytable} is the absolute best table making package out there for LaTeX output (it natively supports tabularray!), and it's phenomenal for HTML. It has fully replaced {gt} and {kableExtra} for me vincentarelbundock.github.io/tinytable/
11.01.2025 20:38 — 👍 176 🔁 30 💬 8 📌 4
A visualisation of Killington Mountain Resort, Killington, Vermont
Killington Ski Resort.
#rayshader adventures, an #rstats tale
I genuinely do not understand what this is like but it sounds rough. Not having to deal with this is a perk of an utter nobody like myself. He gets ~20 emails an hour; I get less than that a week, almost all of which are campus announcements and the like.
11.01.2025 04:54 — 👍 5 🔁 0 💬 1 📌 0I have now also ported the color vision deficiency simulation app to Shiny live. Advantage is this runs entirely in your browser, even though you "upload" the image it never leaves your computer.
10.01.2025 05:15 — 👍 64 🔁 20 💬 2 📌 1This is helpful, thanks!
10.01.2025 12:27 — 👍 0 🔁 0 💬 0 📌 0