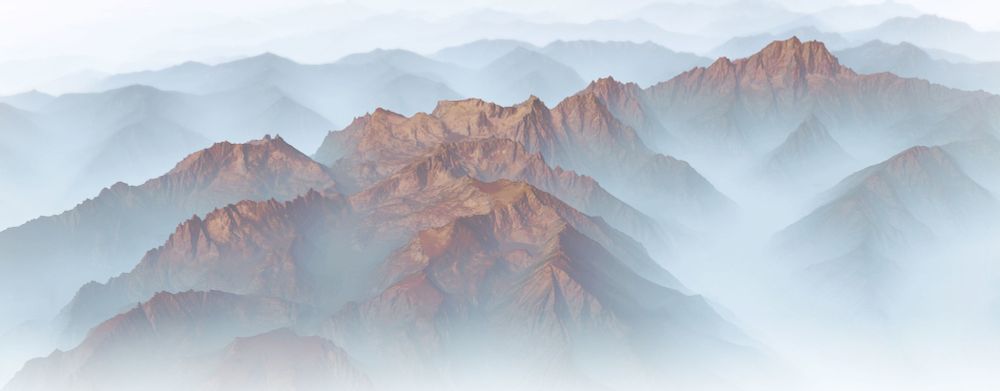
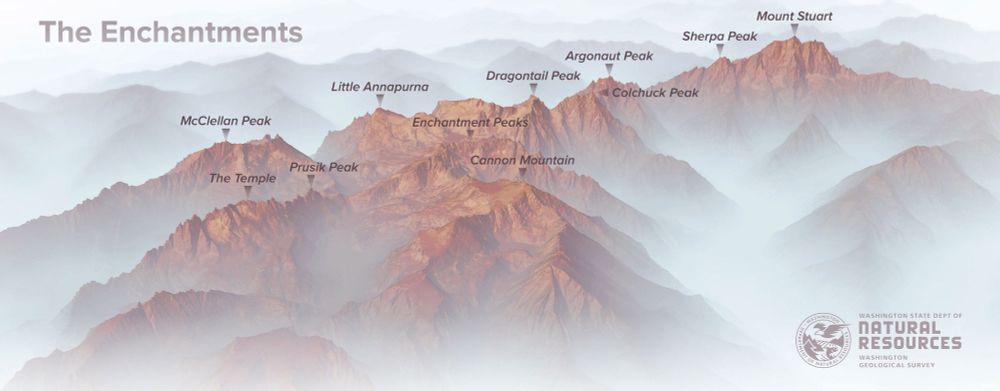
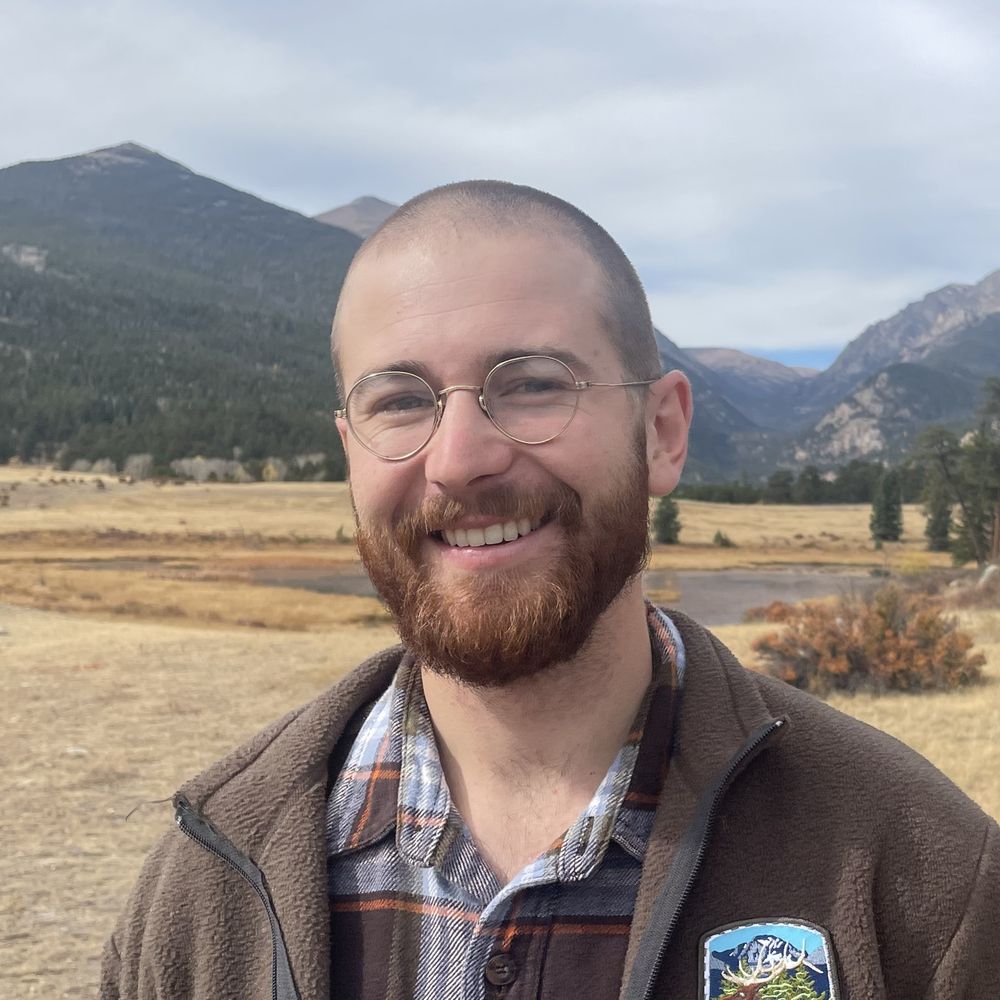
Trump wants to cut research centers like the one in this PNW forest
Congress will take up Trump's proposed budget cuts, which target 26 long-term ecological research centers like the H.J. Andrews Experimental Forest in Oregon.
Always a pleasure to see others recognize the value of our network.
"[The LTER Network] has enabled scientists to get answers that have led to key policy decisions, from amending the Clean Air Act to prevent acid rain to preserving old-growth forests."
Lynda Mapes for the @seattletimes.com
10.07.2025 21:39 — 👍 11 🔁 5 💬 0 📌 1

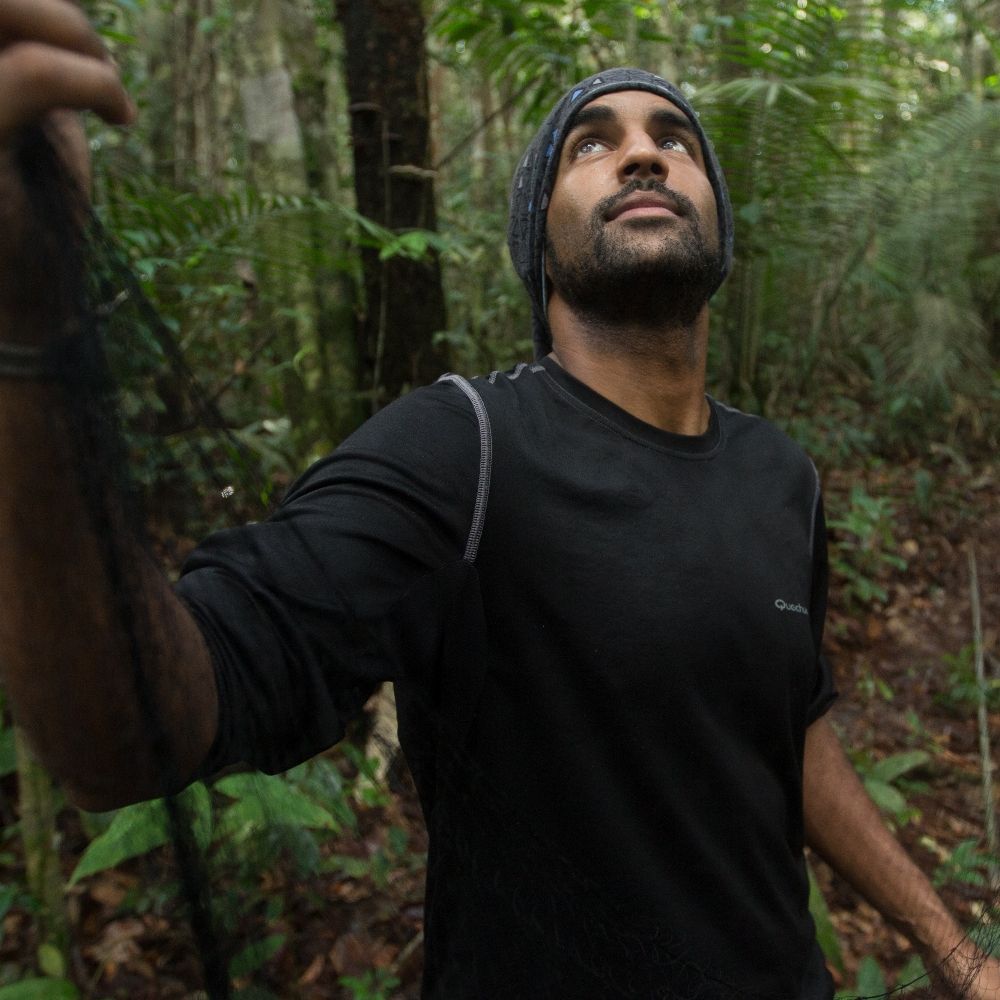
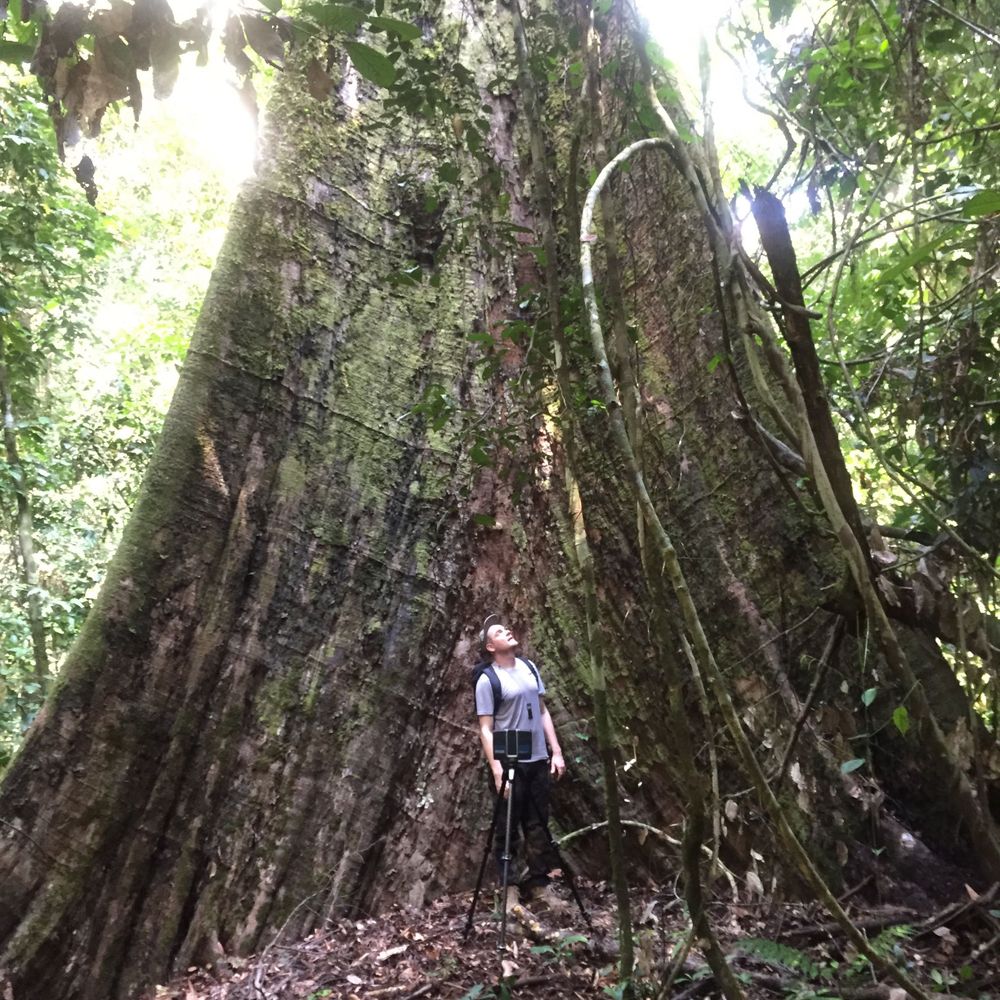
The big western hemlock at Cedar flat, WA, USA
16.07.2025 02:18 — 👍 5 🔁 1 💬 0 📌 0
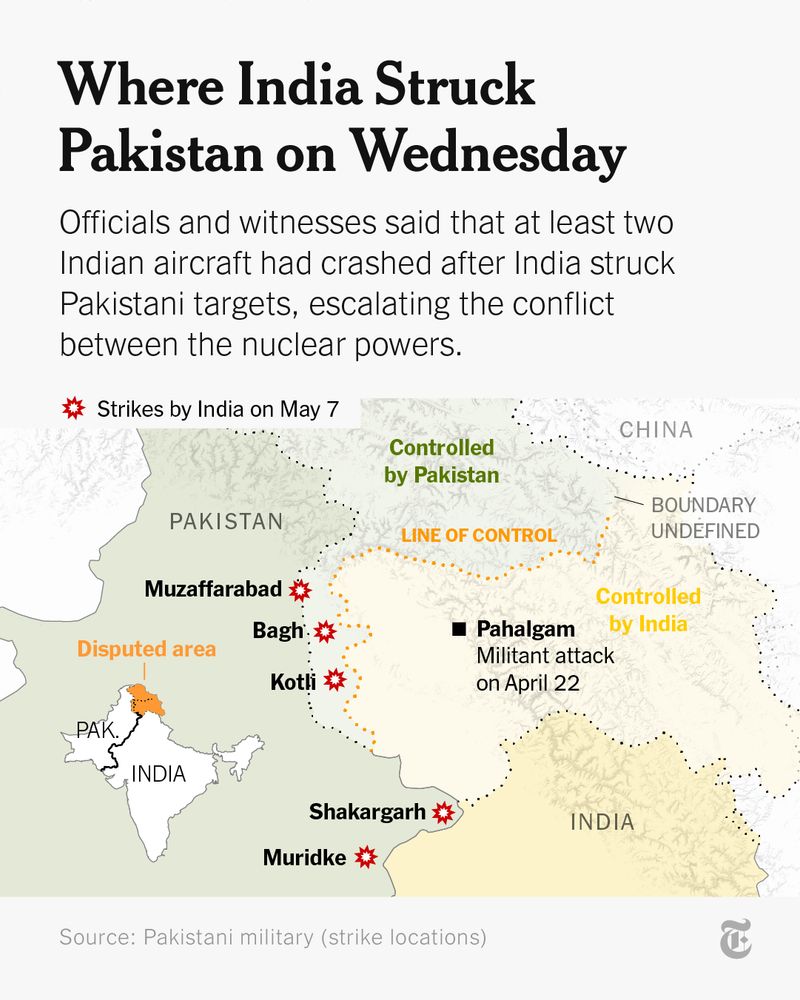
A map of strikes by India on May 7. The text reads: "Where India Struck Pakistan on Wednesday. Officials and witnesses said that at least two Indian aircraft had crashed after India struck Pakistani targets, escalating the conflict between the nuclear powers." Source: Pakistani military (strike locations).
India said early Wednesday that it had conducted several airstrikes on Pakistan after 26 civilians were killed in a terrorist attack in Kashmir. But evidence is growing that the Indian forces may have taken heavy losses during the operation. nyti.ms/4dbIwei
07.05.2025 18:34 — 👍 117 🔁 39 💬 15 📌 3
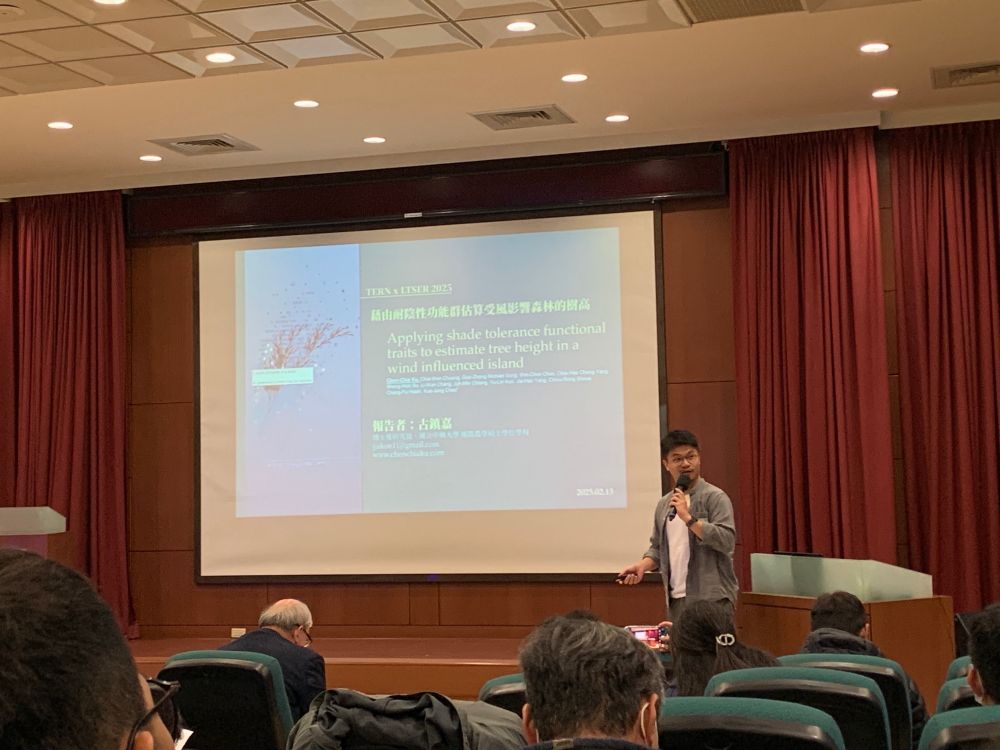

TERN X LTSER 2025
A tree height research presentation @ TERN
14.02.2025 04:29 — 👍 2 🔁 0 💬 0 📌 0

No forest, no map but Happy Lunar New Year today!
29.01.2025 13:05 — 👍 2 🔁 0 💬 0 📌 0

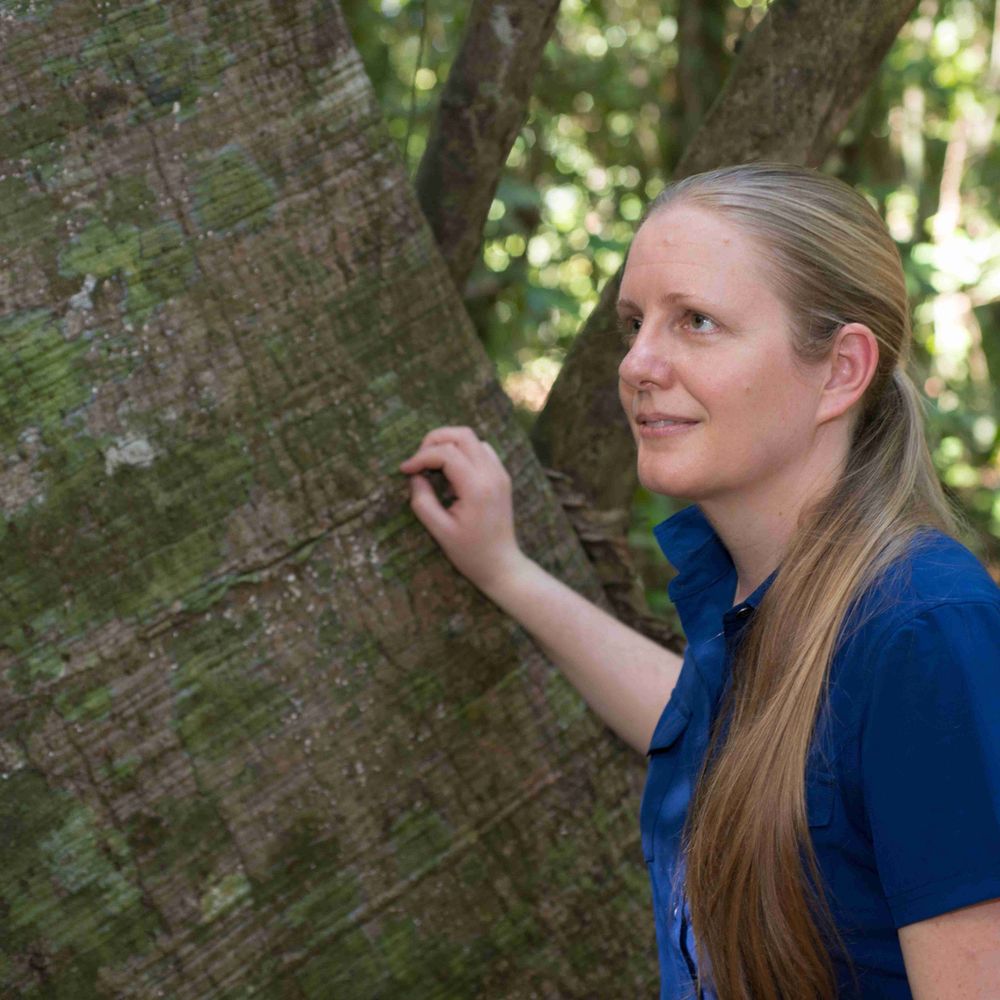
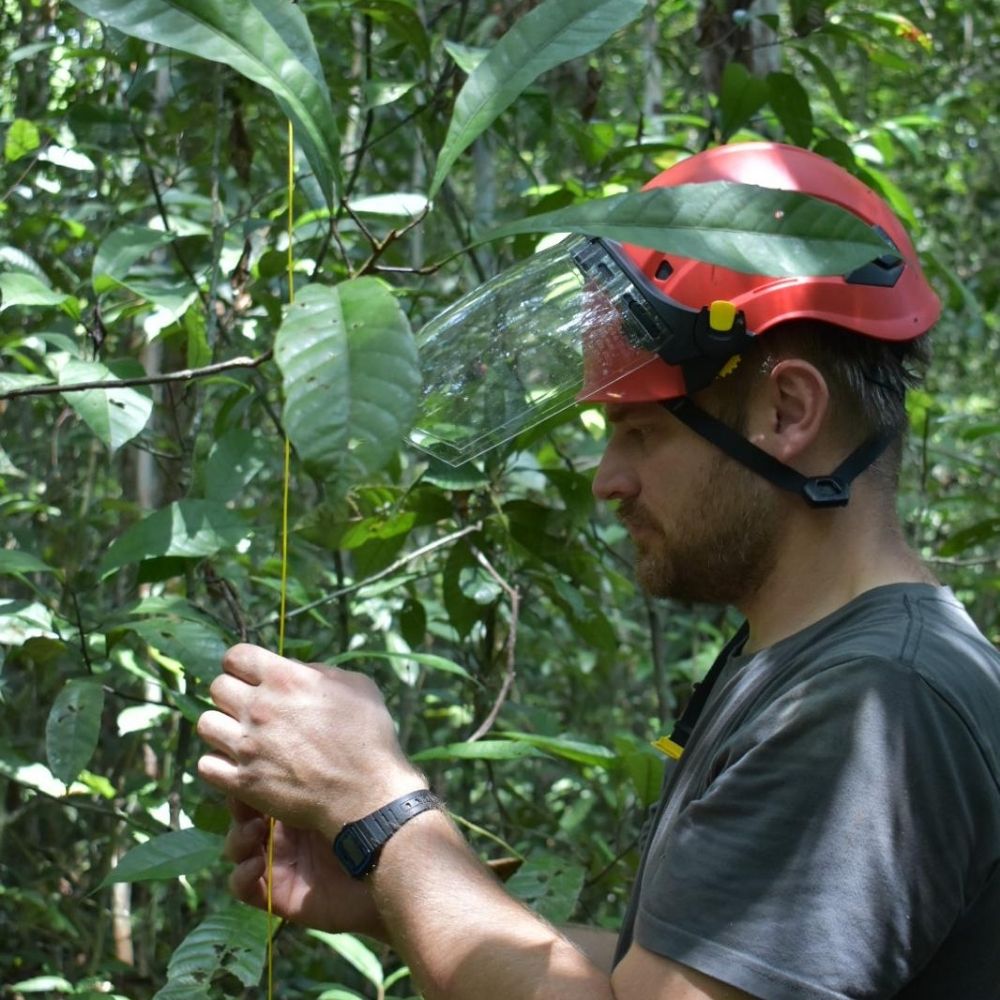
Doing the mortality survey in tropical monsoon forest at Nanjenshan, Taiwan.
18.01.2025 15:03 — 👍 7 🔁 0 💬 0 📌 1

See you next year! I am going back to my warm country.
14.11.2024 01:17 — 👍 1 🔁 0 💬 0 📌 0
And the code was made possible by
@mohsinramay_ (on Xwitter)
. Thank you so much!
12.11.2024 21:23 — 👍 0 🔁 0 💬 0 📌 0

GitHub - jjakon11/30DayMapChallenge
Contribute to jjakon11/30DayMapChallenge development by creating an account on GitHub.
Data source:
*Climate data: Climate AP
*Taiwan DEM: < data.gov.tw/dataset/35430 >
*China DEM: < shorturl.at/cbTVn >
#rstats:
github.com/jjakon11/30D...
12.11.2024 21:15 — 👍 2 🔁 0 💬 1 📌 0

#30DayMapChallenge
#Day12_Time_and_Space
Taiwan's 30-Year Average Temperature and Precipitation Pattern
This map, inspired by @tterence.bsky.social, uses climate data from Climate AP to illustrate Taiwan's 30-year distribution of temperature and precipitation.
Inspired by: @tterence.bsky.social
12.11.2024 21:15 — 👍 13 🔁 2 💬 2 📌 0

#30DayMapChallenge
#Day11_Arctic
Arctic
I used Arctic ocean DEM data to sneak in some marine DEM, mapping out the land areas. By stacking the same dataset three times, I was able to highlight the ocean, flat area, and mountainous regions.
#rstats
12.11.2024 02:16 — 👍 4 🔁 0 💬 1 📌 0
Yeah! It is!
11.11.2024 20:35 — 👍 0 🔁 0 💬 0 📌 0
The video seems like using ggridges package to draw the ridge line, not rayshader.
11.11.2024 19:45 — 👍 1 🔁 0 💬 1 📌 0
Oh gosh man! How did you do that?
11.11.2024 16:24 — 👍 0 🔁 0 💬 1 📌 0
Love it!
11.11.2024 06:48 — 👍 1 🔁 0 💬 0 📌 0

source code:
10.11.2024 23:26 — 👍 3 🔁 0 💬 0 📌 0

This was the photo that I visited Mudoyu Lighthouse, Taiwan in 2022.
10.11.2024 23:26 — 👍 1 🔁 0 💬 1 📌 0

#30DayMapChallenge
#Day10_Pen_and_Paper
Mudouyu Lighthouse
Having not sketched in years, I simply created a basic map of Mudou Island in Penghu, Taiwan.
Inspired by: my photo
10.11.2024 23:26 — 👍 18 🔁 2 💬 1 📌 1
My instruction to ChatGPT 4o is : The Taiwan map should have a very old-fashioned style, evoking a sense of heavy political pressure from 1945-1990. Then, generate and display the map here.
10.11.2024 05:53 — 👍 3 🔁 0 💬 1 📌 0

#30DayMapChallenge
#Day9_AI_only
AI generate a vintage map of Taiwan-Not Always Right.
A dumpster AI! I'd rather write the code myself. If any information is incorrect, that's not on me!
Inspired by: Me
no code today
10.11.2024 05:53 — 👍 6 🔁 0 💬 1 📌 0
Exactly!
09.11.2024 02:05 — 👍 0 🔁 0 💬 0 📌 0
This work was inspired by @tterence.bsky.social . The idea for the figure came to me this afternoon while I was enjoying an ice cream, reflecting on a figure they had previously shared: bsky.app/profile/tter...
09.11.2024 01:45 — 👍 1 🔁 0 💬 0 📌 0

GitHub - jjakon11/30DayMapChallenge
Contribute to jjakon11/30DayMapChallenge development by creating an account on GitHub.
Data source:
*Earthquake: < scweb.cwa.gov.tw/zh-tw/history >
*Taiwan DEM: < data.gov.tw/dataset/35430 >
*Ocean DEM: < www.gebco.net >
*China DEM: < shorturl.at/cbTVn >
#rstats:
github.com/jjakon11/30D...
09.11.2024 01:45 — 👍 1 🔁 0 💬 1 📌 0

#30DayMapChallenge
#Day8_Data_HDX
Earthquake in Taiwan
I used earthquake data from 1990 to 2024, combined with land and ocean DEM, to illustrate how these mountains were uplifted by thousands times of plates collisions.
Inspired by: @tterence.bsky.social
09.11.2024 01:45 — 👍 10 🔁 0 💬 2 📌 0
Thanks!
08.11.2024 19:10 — 👍 0 🔁 0 💬 0 📌 0
Thanks, just having a prep that you still needs to do something (like ps) to make it look better after the ggsave (or ggexport )
08.11.2024 08:08 — 👍 1 🔁 0 💬 0 📌 0
Thank you ❤️
08.11.2024 08:05 — 👍 0 🔁 0 💬 0 📌 0
Nature Plants is an online-only, monthly journal publishing the best research on plants (hopefully).
NSF-funded network of programs studying ecological processes operating on decadal-to-century time scales. Interdisciplinary researchers and students generate high-impact, team driven science that builds on deep place-based knowledge.
Independent freelance consultant |
data scientist | data engineer | software developer
#rstats #python #pydata #bash #databs #azure python tools for #powerbi
DMs about freelance projects, collaborations, or just to chat welcome 😁
Clinical psychology researcher | applied statistics geek | so called #RStats influencer
https://www.tree-mortality.net/
I’m a tribal storyteller from Borneo. "Tribal Stories" https://tribalstories.substack.com
i'm an r package account for testing myself
💭 pipe dreams #RStats #Python 💜 @Posit.co (formerly RStudio) || ✶ ✶ ✶ ✶ ||
r + python + data + web things. team shiny at posit (rstudio). open source all the things
https://garrickadenbuie.com
https://github.com/gadenbuie
Assoc. Prof. in Conservation Science @biology.ox.ac.uk
Advocate for Equity, Diversity & Inclusion.
2020 National Geographic Explorer.
🦇🏝️🦎🐈⬛ // @iccs.bsky.social
https://iccs.org.uk/author/ricardo-rocha/
Postdoctoral researcher in BERG group at Uni. of Jyväskylä - working on effects of global changes on biodiversity 🦉🐞 - Forest ecologist 🌳🌲 he/him
Website: https://j-cours.github.io/
Forest Ecologist @ Smithsonian. Leader of ForestGEO Ecosystems & Climate Program. Title and affiliation for identification purposes only. Posts are my personal views, not those of my employer.
Professor of Forest Vegetation Ecology, working at the Swedish University of Agricultural Sciences. 🇺🇸 + 🇸🇪
https://www.slu.se/en/profilepages/g/michael-gundale/
Tropical forest ecologist | NERC IRF | Lecturer University of Liverpool | Dad x2
Quantitative analysis of disturbance and ecosystem response
Post-Doctoral scholar in wildfire science at Colorado State University
boy howdy do I love stats
trevoracarter.com
#Ecosystem Science and Impacts of #Climate Change; #Forest #Ecology; #Biodiversity.
| Ecosystem Ecology group at @wslresearch.bsky.social |
| Professor at @usyseth.bsky.social |
| Head of the @SwissForestLab.bsky.social |
Smithsonian Climate Change Postdoctoral Fellow | ForestGEO | Previously Boston University E&E |
| He/him | Forest ecology, forest biomass & carbon
Forest ecology, forest dynamics, forest management. Temperate and tropical.
Tree-ring scientist, forest ecologist, forest fires, climate and human interactions. Regents Professor Emeritus Univ AZ; home in New Mexico.
Tree Ecophysiology Professor, University of Florida School of Forest, Fisheries, and Geomatics Sciences. Trees, forests, forestry. Posts do not represent my employer.
Plant ecophysiology starter pack:
https://go.bsky.app/Pbq39H7