While I had been using rainbow parentheses for a while, I only recently found out about rainbow indentation thanks to @ijlyttle.bsky.social and @3mmarand.bsky.social 🌈 #rstats
25.09.2025 16:46 — 👍 43 🔁 9 💬 7 📌 1

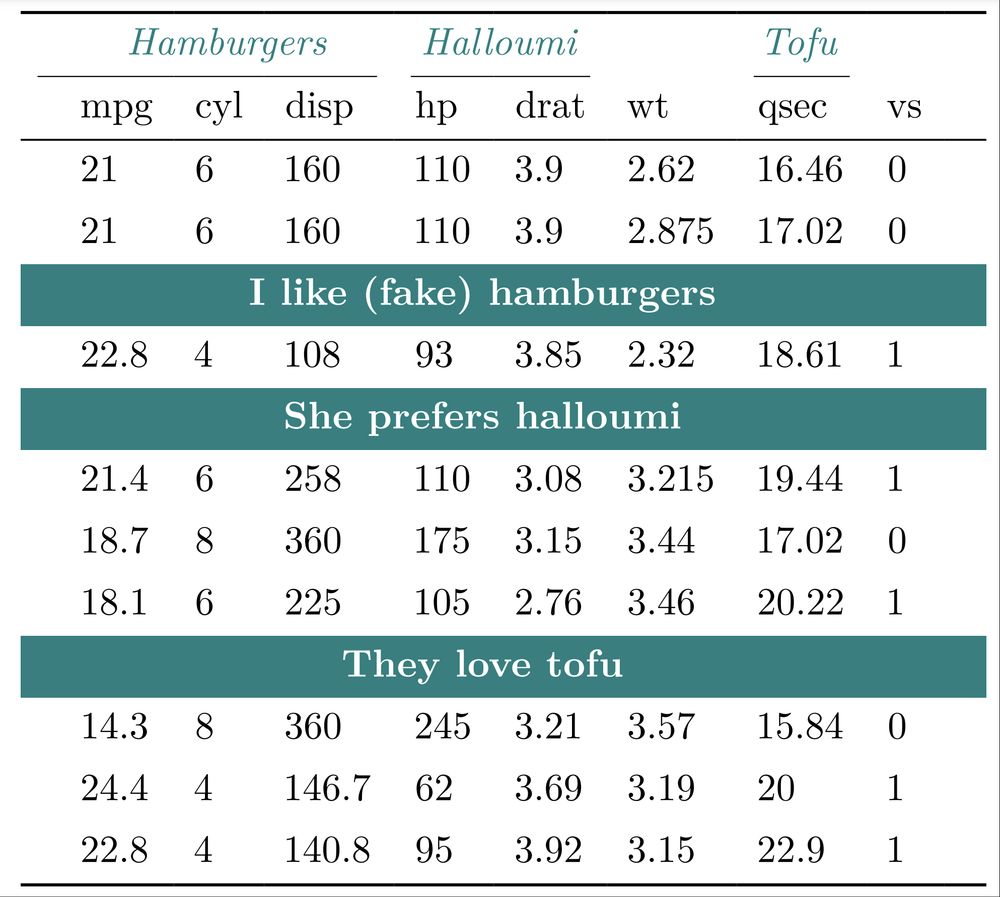
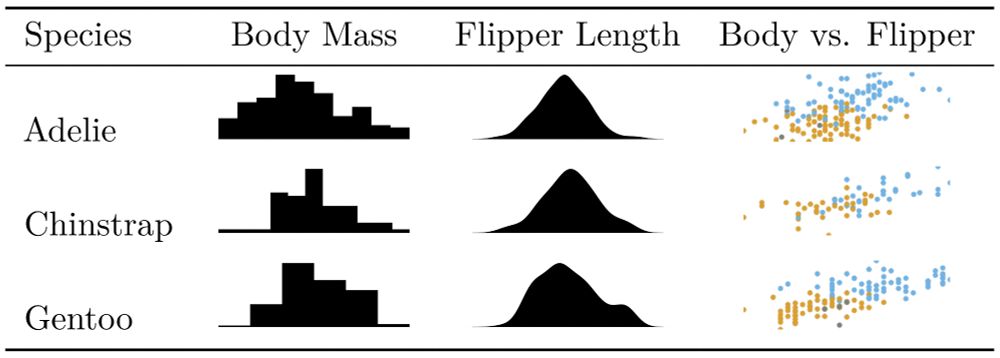
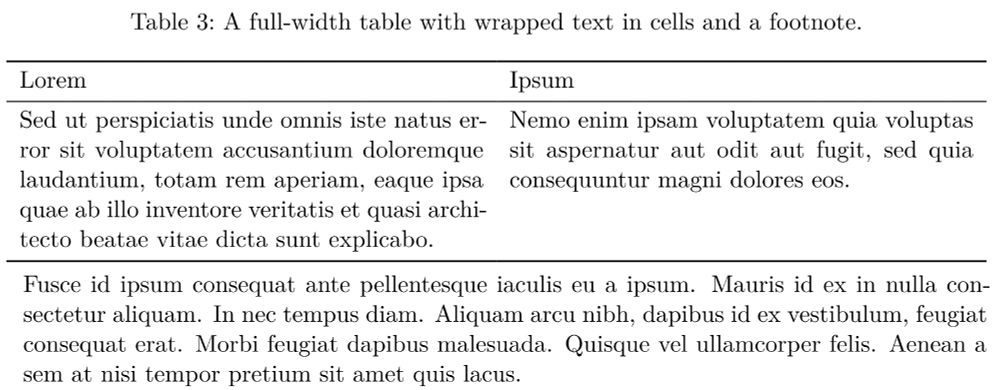
Top Ranked Board Game Table Contest Entry
Want to win the 2025 Table Contest? Get inspired by @bamattre.bsky.social's interactive table, which turns the Board Game Geek database into a practical tool ✨
His entry: bamattre.github.io/boardgames/
Submit your table using any #RStats or #Python package!
Details: github.com/rich-iannone...
24.09.2025 18:17 — 👍 13 🔁 3 💬 0 📌 1
Without transformational change, the sustainability of the NHS is at risk.
A large number of recent FT articles have focussed on the NHS and its need to modernise. But progress remains far too slow
20.09.2025 09:10 — 👍 0 🔁 0 💬 0 📌 0
"Fit for the future: 10 Year Health Plan for England".
The paper makes clear that the NHS is at a historic crossroads, facing unprecedented pressures on access, outcomes, workforce morale, and technology adoption. The government's conclusion is unambiguous
20.09.2025 09:09 — 👍 0 🔁 0 💬 1 📌 0
Which in itself leads to a vicious cycle where NHS managers remain oblivious to the huge opportunity that confronts them.
Timely investment in modern data science technologies is sorely needed, particularly in light of the UK government's newly published Policy Paper
20.09.2025 09:09 — 👍 0 🔁 0 💬 1 📌 0
But managers working in the NHS are often entirely oblivious to the advantages of applying simple data science methods (nevermind machine learning/Al).
This leads to data science teams in medical settings -- including primary, secondary and tertiary care -- being under-resourced
20.09.2025 09:09 — 👍 1 🔁 0 💬 1 📌 0
Why law firms want to recruit more data scientists - on.ft.com/3loWXkf via @FT
There's a huge amount of overlap here with what's happening in medicine and the NHS.
As in legal practice, much of Medicine is document-based -- and "words are data points", as highlighted here
20.09.2025 09:08 — 👍 1 🔁 1 💬 2 📌 0
🚨 GRADY IS BACK 🚨
01.12.2024 00:40 — 👍 52 🔁 6 💬 0 📌 0
Advent of Code 2024
This was my tenth(!) year building 25 days of puzzles for #AdventOfCode. You can solve them all for free! Most people write code to solve them, but you can solve them however you like. I hope they help people become better programmers. 🌟
The first puzzle comes out in two hours: adventofcode.com
01.12.2024 02:57 — 👍 1135 🔁 209 💬 62 📌 22
Day 1 - Advent of Code 2024
Glowing! Probably ugly #rstats code, but I did Day 1 of this year’s #AdventOfCode adventofcode.com/2024/day/1
Will try to keep up.
01.12.2024 20:15 — 👍 5 🔁 1 💬 0 📌 0
Day 1 - Advent of Code 2024
adventofcode.com/2024/day/1
#Rstats
Advent of code 2024- my first time joining in.
Really like the way it's presented almost in old fashioned RPG video game style from the 90s
01.12.2024 21:29 — 👍 2 🔁 0 💬 0 📌 0
The learning curve is steep in #RStats but the payoffs do come: "I now spend well over 90% of my work time thinking about and programming in R... as I built better tools...it becomes even easier to build new tools... and I have many techniques on-hand (in-brain) for solving new problems."
01.12.2024 21:09 — 👍 34 🔁 7 💬 0 📌 0
📌
28.11.2024 07:18 — 👍 0 🔁 0 💬 0 📌 0

Inspiration – brand.yml
Unified branding with a simple YAML file
We have our brand.yml page on the Posit Gallery posit-dev.github.io/brand-yml/in...!
All our colours can be used for NHS England.
Thanks to @send2dan.bsky.social for the issue on the Posit GitHub and @grrrck.xyz for all your help with getting this to a successful Pull Request.
#RStats #Python
27.11.2024 16:42 — 👍 24 🔁 8 💬 1 📌 0
Good, come on over
25.11.2024 20:12 — 👍 0 🔁 0 💬 0 📌 0


📚 Spatial Statistics for #datascience w/ #rstats
Chapter 1: Spatial Data Types
🔹 Areal: aggregated number of events (disease counts)
🔹 Geostatistical: observations at known locations (air pollution)
🔹 Point patterns: event locations (fires, trees)
Examples 👉 www.paulamoraga.com/book-spatial...
23.11.2024 16:59 — 👍 115 🔁 28 💬 3 📌 0
Looks really useful, thanks!
23.11.2024 20:41 — 👍 1 🔁 0 💬 0 📌 0

NHS brand · Issue #53 · posit-dev/brand-yml
For the UK it would be helpful to publish branding for the National Health Service (NHS) - The UK's largest employer after all
They say shy bairns get nought.
Happy to say Posit are working on an NHS themed _brand.yml, which should be very helpful when creating NHS themed Quarto outputs:
github.com/posit-dev/br...
Further general info here:
github.com/posit-dev/br...
posit-dev.github.io/brand-yml/
🙏
#Rstats #NHS
22.11.2024 21:13 — 👍 6 🔁 0 💬 3 📌 0
Very convincing clinical details, too. Impressive synthetic data created using the Wasserstein GAN*.
(*Google searches may have spiked recently)
21.11.2024 18:54 — 👍 1 🔁 0 💬 0 📌 0
At #NHSRPySoc and thinking for the quadrillionth time that a sane NHS would make sure that data scientists have somewhere to deploy their projects so they can show them to interested parties.
Tiny investment, massive benefit
21.11.2024 12:04 — 👍 5 🔁 3 💬 0 📌 0

Happy to attend the #NHSRPySoc 2024 conference in Birmingham at the ICC
21.11.2024 09:54 — 👍 3 🔁 1 💬 0 📌 0
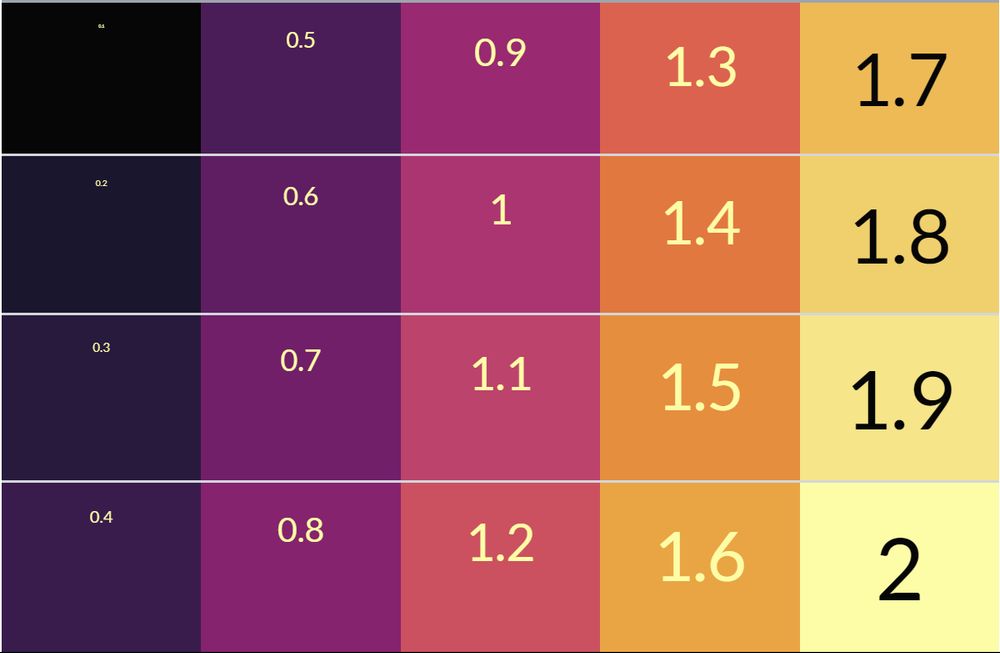
Have you ever thought to yourself… how can I make my #rstats plot UGLIER? Well, look no further, cuz it’s good plot-bad plot time! My students made plots that will make you want to laugh, cry, and throw your computer out the window. Which one do you think is the worst? 🧵🧪
11.11.2024 19:46 — 👍 78 🔁 19 💬 6 📌 10
 31.10.2024 18:00 — 👍 2 🔁 1 💬 0 📌 0
YouTube video by Posit PBC
Quarto, AI, and the Art of Getting Your Life Back - posit conf 2024
Happy Halloween—my posit::conf(2024) talk has been uploaded! Watch to see how I easily migrated my website to Quarto using some neat Quarto features and a little help from AI!
#RStats #QuartoPub #PositConf #Quarto
youtu.be/U8_Dc_ru8fg?...
31.10.2024 19:54 — 👍 11 🔁 8 💬 0 📌 0

a group of people are hugging in a living room .
Alt: A group of men and women converging for a group hug.
The #rstats community has re-assembled on this platform. I am crying! It's beautiful to watch 😍
28.10.2024 22:42 — 👍 118 🔁 14 💬 10 📌 4
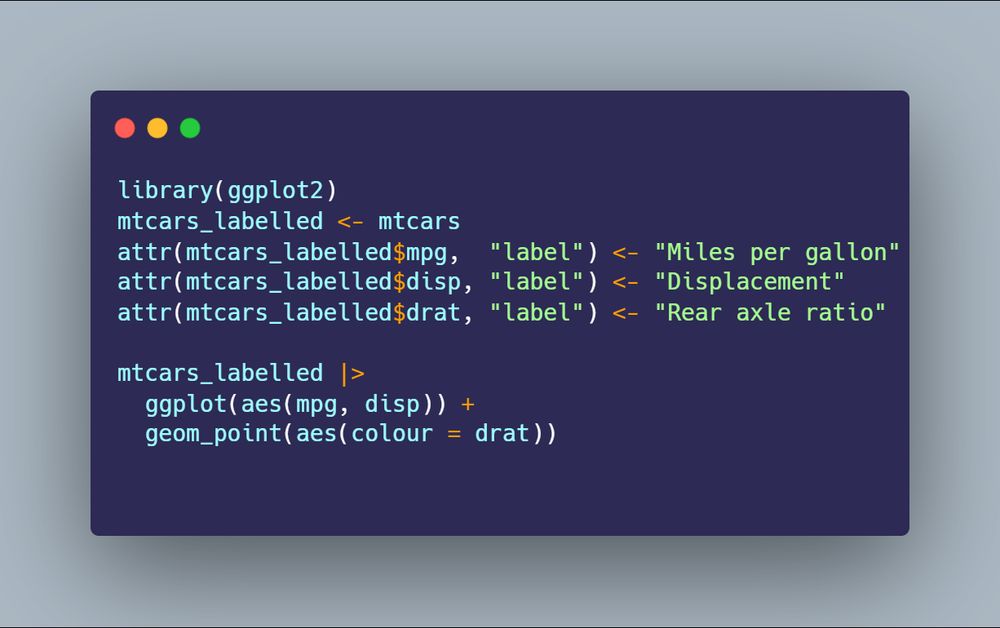
library(ggplot2)
mtcars_labelled <- mtcars
attr(mtcars_labelled$mpg, "label") <- "Miles per gallon"
attr(mtcars_labelled$disp, "label") <- "Displacement"
attr(mtcars_labelled$drat, "label") <- "Rear axle ratio"
mtcars_labelled |>
ggplot(aes(mpg, disp)) +
geom_point(aes(colour = drat))
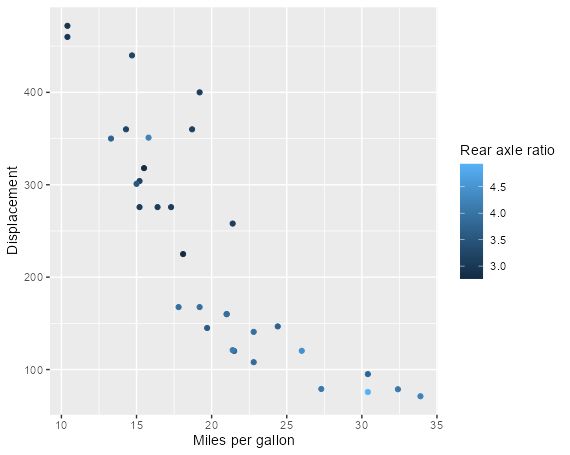
ggplot figure showing "Miles per gallon" on x-axis, "Displacement" on y-axis, and "Rear axle ratio" on legend.
y'all probably know i ❤️labelled data. the dev version of {ggplot2} has a new feature that automatically applies variable labels when plotting 😍✨ thank you @teunbrand.bsky.social!!! 🙏 #rstats
29.10.2024 12:59 — 👍 128 🔁 31 💬 10 📌 2
The R profile file
29.10.2024 16:30 — 👍 0 🔁 0 💬 1 📌 0
Promoting the use of R and open analytics in health and care
Building a community of practice for data analysis and data science using open source software in the NHS and wider UK health and care system https://nhsrcommunity.com/
Created http://adventofcode.com, http://compute-cost.com, http://anoik.is, http://was.tl/projects/; Principal Architect at https://acvauctions.com
Nurse Researcher in Emergency Medicine in London. Currently completing PhD in outcome prediction following Trauma @ C4TS QMUL
#Rstats #nurse #emsky
Also enjoy trail running, nvim, walks in the woods, cooking and audiobooks.
ORCID: 0000-0003-2068-0560
Head of data science at the Strategy Unit
🧮 NHS Data Scientist
🗣️ Stats communicator
👩💻 #RStats educator
💜 Community champion
🔗 rhian.rbind.io
🚣♀️ 🚴♀️🧗♀️ 🏊♀️🏃♀️🚐🎼 🥁 🧶🏳️🌈 she/her
Code-first data analyst, mostly #rstats. Good information --> good decisions. Head of Activity Analysis & Forecasting at Nottingham University Hospitals NHS Trust. Personal account, views my own. https://github.com/ThomUK
🔷🔵🟦◀ #shapenote #RStats #JuliaLang #cymraeg #pyrotheology #scything #stroud
Demographer, former tweeting statistician and female data lad. Attempting to make a difference in public health analysis at DHSC. I ran the UK's covid dashboard. Now seen running parkruns. DMs not available. She/her 🍉🏳️⚧️🏳️🌈
We are the Newcastle Cycling Campaign: we want a city with safe space for cycling so that people of all ages and abilities are able to choose to cycle.
Demographics | Geospatial | Data Science | Open Source
Daily tips and tricks to enhance your Shiny Apps. Use hashtag #rshiny and tag our page with your best Shiny Apps!
data specialist in the NHS, Scotland.
Experience with clinical audit, quality improvement, BI and public health.
Likes #RStats and #dataviz
Formerly HighlandR , still at
https://johnmackintosh.com
Director of Training/Community at the Data Science Lab at Fred Hutch. Former OHSU, DNAnexus. Posit Data Science Mentor (when I have the time) #bioinformatics, #datascience, #teaching, and #ambientmusic. https://laderast.github.io
A guy programming in rural Japan.
GitHub: https://github.com/nteetor
Trans rights
Data science, rstats, sometimes video games, hobby shiny apps
Once a sociologist, FLG -> SEA
alans.omg.lol
omnipresent explorer of the unknown, fashionably caffeinated informatics phd, amorous cavalier. design, build, analyze. #rstats on #macos + #webr and #python with #pyodide
#rstats user and developer. umairdurrani.com