Search Page
The Data Catalog is designed to make World Bank's development data easy to find, download, use, and share. It includes data from the World Bank's microdata, finances and energy data platforms, as well...
Grab this new global public good from the World Bank Data Catalog datacatalog.worldbank.org/search/datas... or query it from the feature server here: www.arcgis.com/home/item.ht...
If you want to know more, the intro blog post is here: blogs.worldbank.org/en/opendata/... 4/4
21.11.2025 14:43 — 👍 4 🔁 0 💬 0 📌 0

A comparison of the level of detail and simplification for Belgium in the Natural Earth 10M data (shown in red) and in the World Bank official boundaries in blue
Interesting characteristics of this data set: periodically updated, explicit disputed areas and digitized at 1:250k scale. This level of detail makes it a lot more detailed than the 1:10M Natural Earth we are all using, and makes it suitable for country maps 3/4
21.11.2025 14:43 — 👍 2 🔁 0 💬 1 📌 0

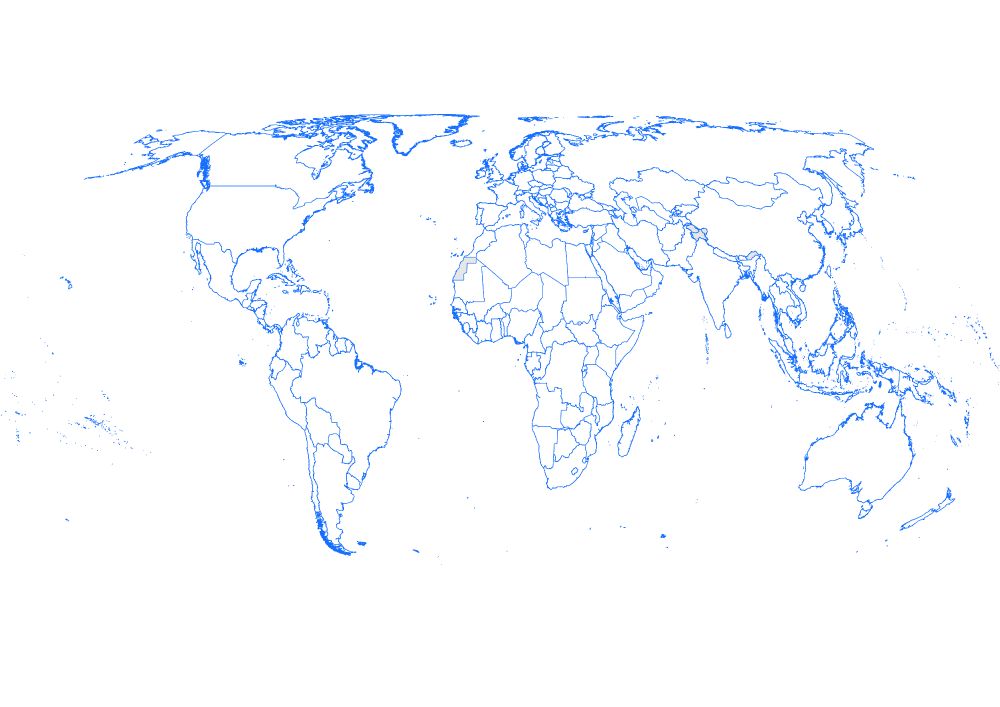
Outlines of the Admin0 level administrative boundaries from the World Bank official boundaries, shown in blue

Outlines of the Admin1 level administrative boundaries from the World Bank official boundaries, shown in blue

Outlines of the Admin2 level administrative boundaries from the World Bank official boundaries, shown in blue
The first data set I presented were the World Bank official administrative boundaries, at admin levels 0 (country level, 263 features), 1 (3587) and 2 (39355). Already interesting to look at just like that, if you ask me :) 2/4
21.11.2025 14:43 — 👍 2 🔁 0 💬 1 📌 0

Maarten Lambrechts presenting some World Bank geo data resources at Geomob Belgium on 2025-11-19
Earlier this week, I had the honour to speak at @geomob.bsky.social Belgium. Geomobs are informal meetups, organised in many cities thegeomob.com
I took the opportunity to talk about some fresh open geodata published by some of my colleagues at the World Bank 1/4
21.11.2025 14:43 — 👍 4 🔁 0 💬 1 📌 0
Super, Senne en @marcolangbroek.bsky.social!
20.11.2025 11:14 — 👍 2 🔁 0 💬 0 📌 0

Geomob Belgium 18 Nov 2025 speakers

Geomob Berlin 19 Nov 2025 speakers

Geomob Lisbon 19 Nov 2025 speakers
It's a huge Geomob week coming up with not one, not two, but three events coming up.
On Tuesday (18th) in Antwerp 🇧🇪 is Geomob Belgium: https://thegeomob.com/post/nov-18-2025-geomobbe-details
Followed on Wednesday (19th) by events in Berlin 🇩🇪 and Lisbon 🇵🇹:
16.11.2025 17:18 — 👍 1 🔁 2 💬 0 📌 0
THEN YOU PURCHASE THEM AND DO NOT USE THE PROPERTY OF OTHERS
14.11.2025 21:23 — 👍 6774 🔁 2196 💬 10 📌 27
Is that Rob and Fil?
14.11.2025 23:36 — 👍 0 🔁 0 💬 0 📌 0
Waw. Where did you find this?
13.11.2025 18:10 — 👍 1 🔁 0 💬 1 📌 0

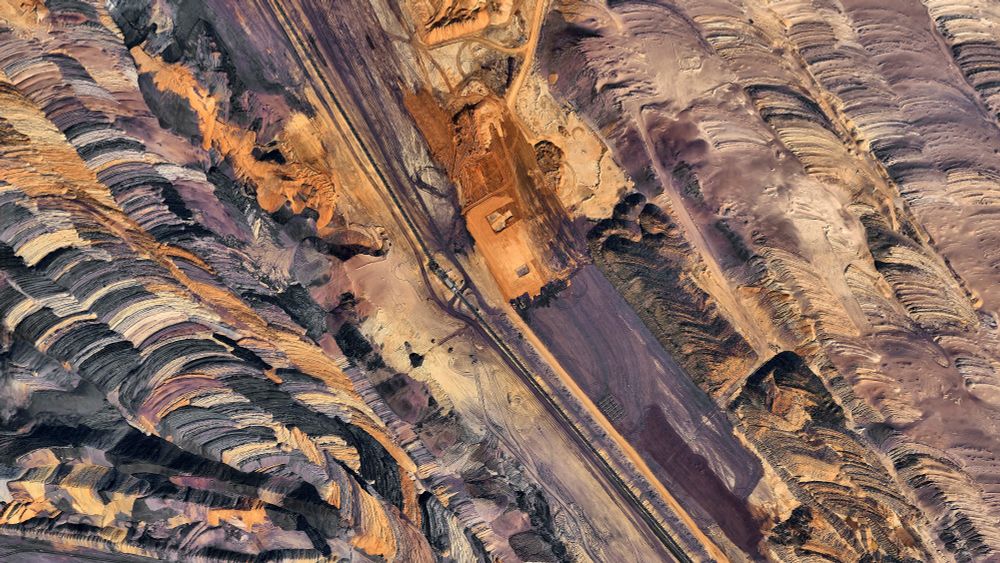
A satellite picture of a large mining site with multiple open pits, exposed earth layers, and water-filled trenches in varying colors. Machinery and vehicles are scattered across the terrain, with a central excavator near the middle. Dirt roads and linear patterns mark the landscape, indicating active industrial activity

A satellite picture of a large open-pit mining site with terraced layers of excavated earth forming curved and parallel patterns. The upper area shows light-colored terrain, while the lower sections reveal darker, systematically mined zones. The scene illustrates industrial-scale resource extraction.

A satellite picture of a landscape with diagonal bands of colorful sediment or rock in shades of purple, orange, black, white, and beige.

A satellite picture of a large open-pit mine with terraced layers of excavated earth in colors like purple, black, orange, and yellow. A flat central area contains buildings and equipment, connected by roads across the site. The stepped terrain reveals geological strata shaped by industrial mining.
Details of the Garzweiler surface mine - Germany
🌍 : maps.app.goo.gl/JJbyiLQvkJ8R...
4K link : imgur.com/a/h5r35F5
06.11.2025 20:08 — 👍 58 🔁 20 💬 0 📌 0
It's been a while, but I'm doing a little public talk again soon
05.11.2025 16:00 — 👍 6 🔁 1 💬 0 📌 0
This is Monty Python and I refuse to believe otherwise
04.11.2025 16:47 — 👍 11 🔁 1 💬 1 📌 0
New video: A glacier on Antarctica’s Eastern Peninsula experienced the fastest retreat recorded in modern history—in just two months, nearly 50 percent of the glacier disintegrated. Watch this video to understand what happened. Study by @ciresnews #Antarctica #glaciermelt
03.11.2025 20:17 — 👍 76 🔁 49 💬 1 📌 4

https://www.pnas.org/doi/10.1073/pnas.2322597121
At 185 mph maximum sustained winds, Cat 5 Hurricane #Melissa is now just 7 mph shy of what @michaelfwehner.bsky.social r.bsky.social & Jim Kossin have defined as the cutoff for a prospective "Cat 6" hurricane:
www.pnas.org/doi/10.1073/...
28.10.2025 17:02 — 👍 315 🔁 157 💬 9 📌 19
12 hours of Hurricane #Melissa, one frame every minute. 🛰️🗺️
28.10.2025 01:22 — 👍 67 🔁 26 💬 3 📌 1
The before and after of the East Wing demolition is wild... 😨
See for yourself: shorturl.at/TrWu3
#WhiteHouse #WhiteHouseWall #EastWing #Trump
24.10.2025 06:18 — 👍 8 🔁 4 💬 1 📌 0
Xenographics – Weird but (sometimes) useful charts
Absolutely delighted to catch up with Xenographics, an initiative of @maartenzam.bsky.social. It was a big thing on Twitter some 4-5 years ago and I wish that the conversation would carry over on Bluesky. 📊
xeno.graphics
23.10.2025 01:28 — 👍 27 🔁 6 💬 2 📌 0

Waimakariri River, New Zealand
22.10.2025 19:32 — 👍 88 🔁 14 💬 4 📌 2
Hi. It's me. 2 weeks later. This is done. 58 frames over 3 seconds, *50* layers in the final image. WOO. This was a long edit, felt like ACTUAL work so unless I get it again with the actual sunset I doubt I'll be editing more like this. Psyched for the final piece tho! 🪶
28.09.2025 04:49 — 👍 2493 🔁 567 💬 51 📌 18
Very sad data journalist job posting
17.10.2025 14:47 — 👍 6 🔁 3 💬 0 📌 0


Part of Wadden Sea in false color
More: whc.unesco.org/en/list/1314/
📸🛰 #Sentinel2
Footage: @sentinelonline.bsky.social
16.10.2025 22:35 — 👍 5 🔁 2 💬 1 📌 0
Salesforce owns Tableau. Time to drop all mentions from classes and trainings #dataViz
17.10.2025 03:02 — 👍 76 🔁 23 💬 1 📌 2
Excellent graphics in this one
17.10.2025 07:58 — 👍 2 🔁 0 💬 0 📌 0
I was also curious.It's here: www.google.com/maps/@51.799...
16.10.2025 15:04 — 👍 2 🔁 0 💬 1 📌 0
"The data's in PDF."
12.10.2025 16:08 — 👍 77 🔁 12 💬 3 📌 1

Well, it's official. After our paper last year (onlinelibrary.wiley.com/doi/full/10....), the Slender-billed Curlew is officially declared Extinct today.
Scientists dream of describing new species, not writing their obituary and epitaph, knowing that they are gone forever #ornithology
10.10.2025 08:54 — 👍 521 🔁 312 💬 31 📌 45
Immigrant Nobel Prize winners exiting the United States
10.10.2025 11:24 — 👍 3022 🔁 861 💬 48 📌 26
Iceberger
That is not how icebergs float :) joshdata.me/iceberger.html
09.10.2025 06:52 — 👍 2 🔁 0 💬 1 📌 0
These must be some of the most morally bankrupt graphics ever made
08.10.2025 18:13 — 👍 4 🔁 0 💬 0 📌 0
Limogé volontaire à Lyon • Nord Isère aussi, et passé par l’Ariège • Parmi les gens qui doutent • Géographile • PatrimoineS, démocratie, carto, panneaux, Wiki, toponymie. Et pas que.
Sociology PhD candidate at Cornell, studying wealth inequality and elites.
www.wesleystubenbord.com
building a new map of the world at @protomaps.com
cartographic tools, neogeography, systems programming, @recursecenter.bsky.social, https://80s.nyc
https://bdon.org
https://www.are.na/bdon
📍 Taiwan
cartography + data + visualization // building https://allmaps.org // freelance creative technologist
Bot showing random, recently georeferenced historical maps from https://latest.allmaps.org
Background data: https://openstreetmap.org
Maintainers: @bertspaan.nl @bdon.org
Community geographer, cartographer, pedestrian, cyclist. Author of "The New American Small Town: Lessons for sustainable urban futures" (West Virginia University Press, June 2025). https://communitygeography.kent.edu/
Freelance Data Visualization Developer. Into D3.js, React and Svelte. Based in Berlin.
www.kristin-baumann.com
Data Visualisation Manager at a health think tank 👩💻 Mostly talk about data, #dataviz, #opendata, #maps, #python and #data4good 📈 Into cycling, yoga, sourdough, puns and more. Views my own.
Also active on Mastodon + Linkedin
Hang on, I'll be with you in a minute ...
New York Times journalist covering cities and urban policy for The Upshot. emily.badger@nytimes.com, ebadger.21 on Signal
Data, maps, and satellite imagery 🛰🌻🔭
viewsfromabove.bradyafrick.com
⚽️ Head of Football Insights & Innovation at Club Brugge
👨🔬 Research Fellow at KU Leuven
🎮 Editor for EAFC at EA Sports
👨🎓 Computer Science & Machine Learning
‘This Way Up: When Maps Go Wrong’ (the MAP MEN BOOK) is available now: https://lnk.to/mapmen 🗺️ 📕
Reuters deputy editor, data journalism. Europe, Middle East, Africa. #okstate alum....... send tips: ryan.mcneill@tr.com
Professor of Alcohol Policy in the Sheffield Addictions Research Group (@SARG-SCHARR), graph drawer, data botherer, cake eater, incompetent cyclist and intermittent birder.
Journalist on the Guardian Data Projects team
London and Brighton
Ignore my silly posts
Here to talk mainly about games and interactive media 🎮
On my day job I work with data visualization.
he/him
Montréal 🇨🇦
Assistant Professor at HKUST. CS PhD from Georgia Tech. I build cool things leveraging data visualizations, human-computer interaction (HCI), and artificial intelligence (AI).
Website: https://narechania.com
Email: arpit@ust.hk


