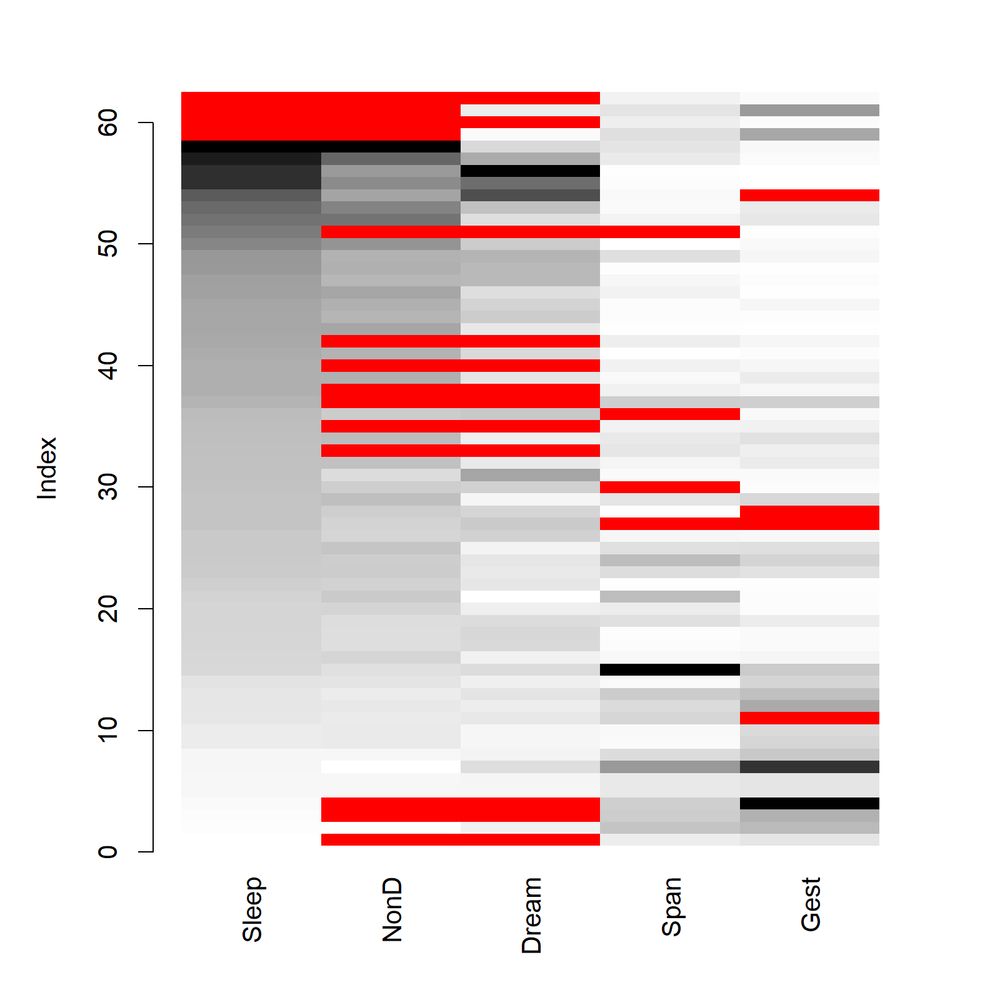
When analyzing missing data, it is crucial to identify patterns and explore relationships between variables to ensure accurate and robust analysis.
The attached matrix plot was created using the matrixplot function.
More information: cran.r-project.org/web/packages...
#dataanalytics #coding #data
04.08.2025 14:23 — 👍 4 🔁 1 💬 0 📌 0
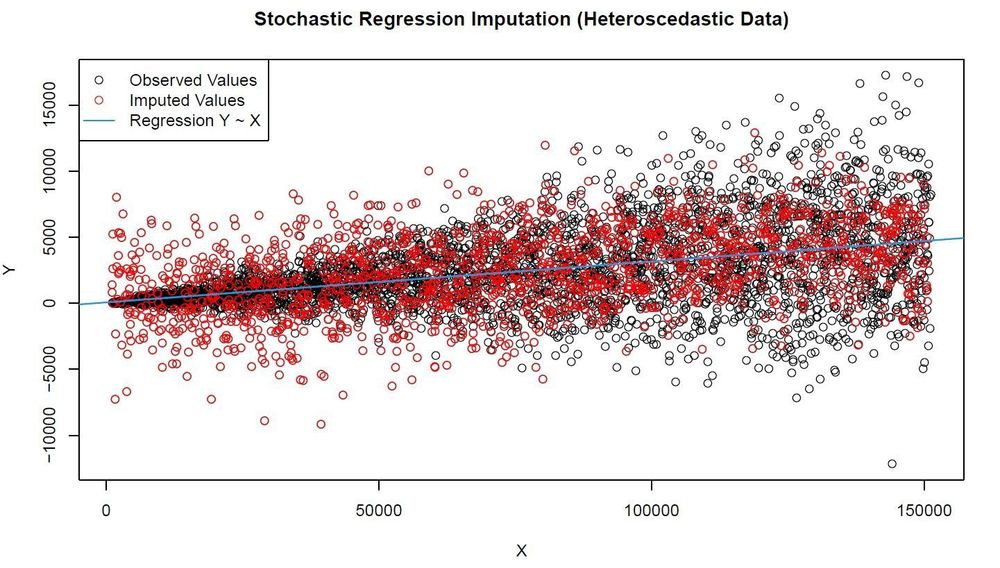
Regression imputation is a widely used method for handling missing data, leveraging relationships between variables to estimate missing values.
The attached image illustrates stochastic regression imputation applied to heteroscedastic data.
Tutorial: statisticsglobe.com/regression-i...
#rstudio
31.07.2025 09:38 — 👍 0 🔁 0 💬 0 📌 0
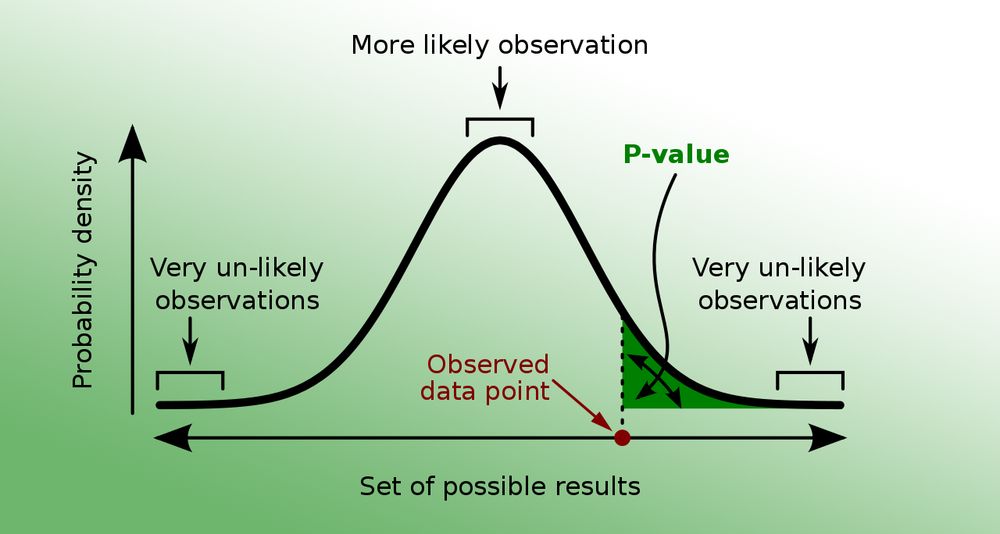
Misuse of p-values is a prevalent issue in scientific research. P-values are often misunderstood and misapplied, leading to incorrect conclusions.
The graph shown in this post is a modified version of this Wikipedia image: es.wikipedia.org/wiki/Valor_p...
More: eepurl.com/gH6myT
#datastructure
28.07.2025 14:23 — 👍 3 🔁 0 💬 0 📌 0
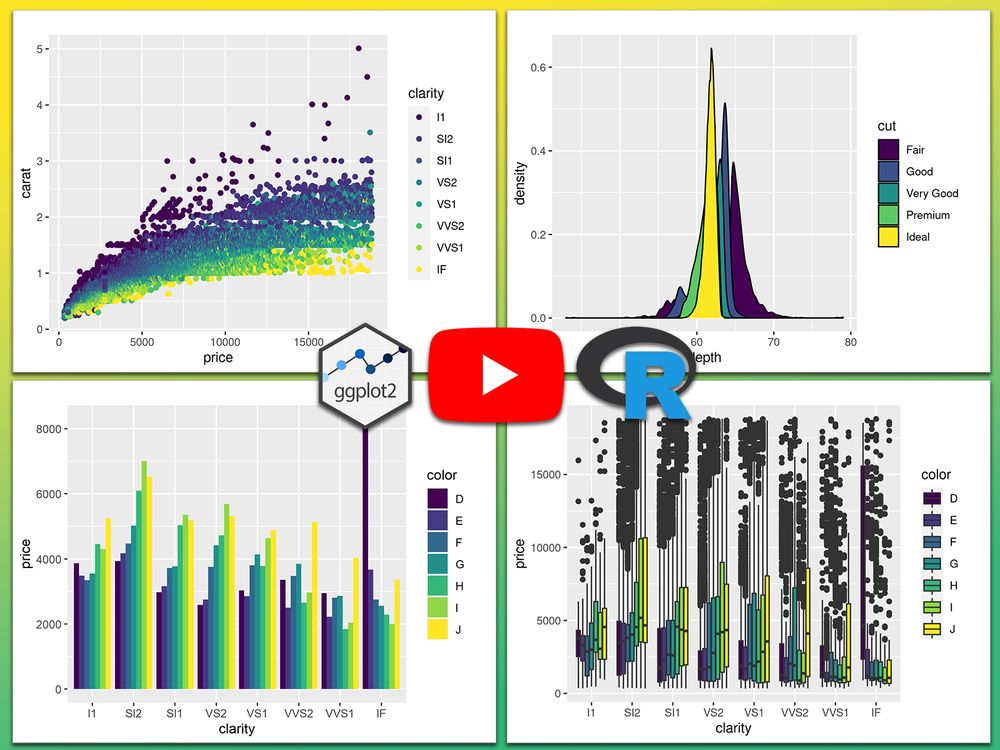
In my opinion, ggplot2 is by far the best tool for visualizing your data!
Video: www.youtube.com/watch?v=Cl9y...
Website Tutorial: statisticsglobe.com/ggplot2-r-pa...
Learn more by visiting this link: statisticsglobe.com/online-cours...
#datavisualization #data #package #programming #rprogramming
24.07.2025 09:38 — 👍 4 🔁 0 💬 0 📌 0
This is a final reminder that the 33% discount on all Statistics Globe online courses ends today.
If you’re interested in boosting your R programming and data science skills, now is the perfect time!
Here’s the full list of courses: statisticsglobe.com/courses
#rstats #statistics #datascience
23.07.2025 10:25 — 👍 3 🔁 0 💬 0 📌 0
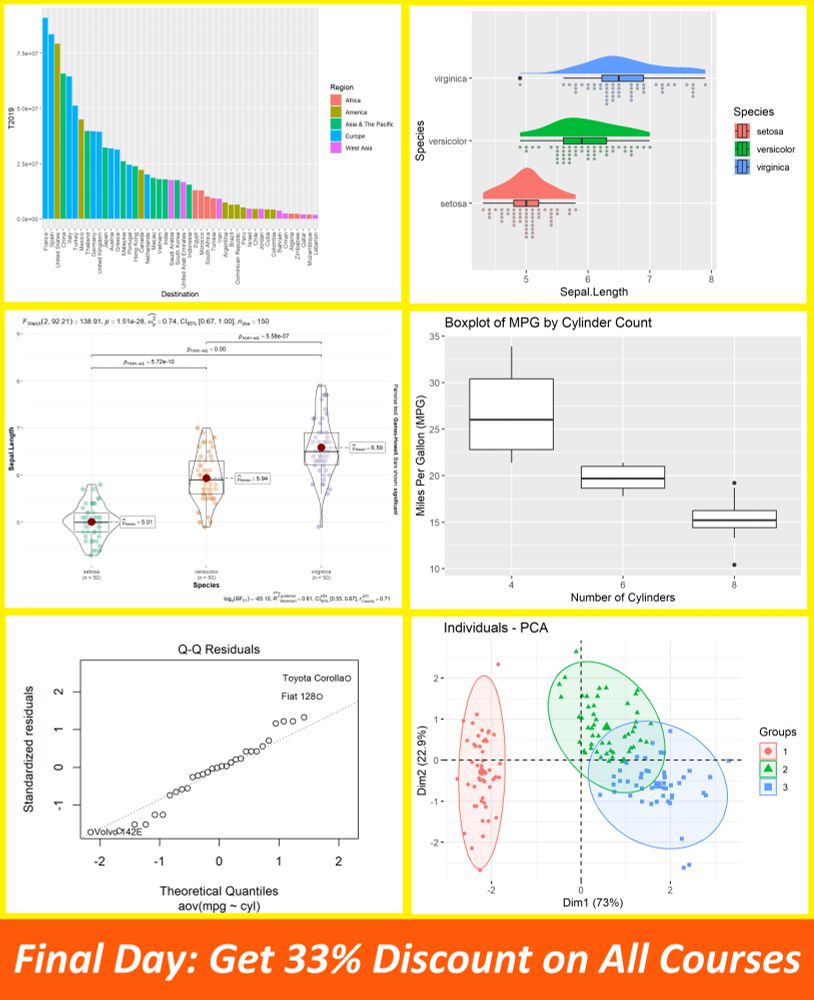
Free course previews:
- Working with Rows: statisticsglobe.com/online-cours...
- Violin Plots: statisticsglobe.com/online-cours...
- Sampling Methods: statisticsglobe.com/online-cours...
- PCA in R: statisticsglobe.com/online-cours...
#rstats #statistics #datascience #rstudio #dataviz
22.07.2025 09:52 — 👍 9 🔁 3 💬 0 📌 0
Thank you so much, Jamie! :)
22.07.2025 09:50 — 👍 2 🔁 0 💬 0 📌 0
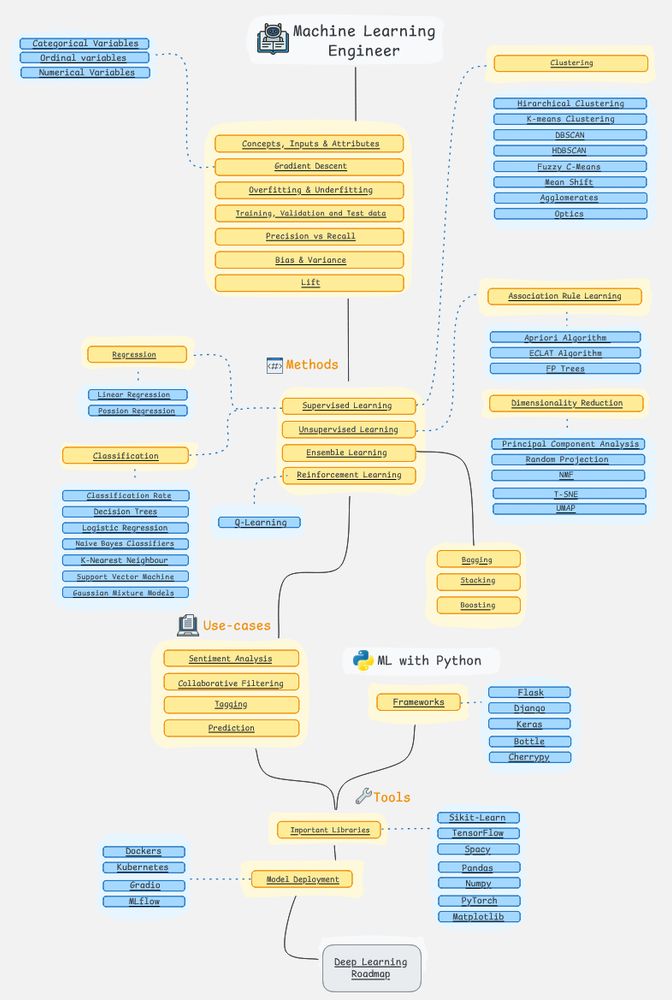
If you’re interested in Machine Learning, having a clear roadmap can simplify the process of mastering this complex field.
I came across this roadmap on the AIGENTS website, and what makes it stand out is its interactive structure.
More details: aigents.co/learn/roadma...
#rstudio #statistics
21.07.2025 14:23 — 👍 2 🔁 0 💬 0 📌 0
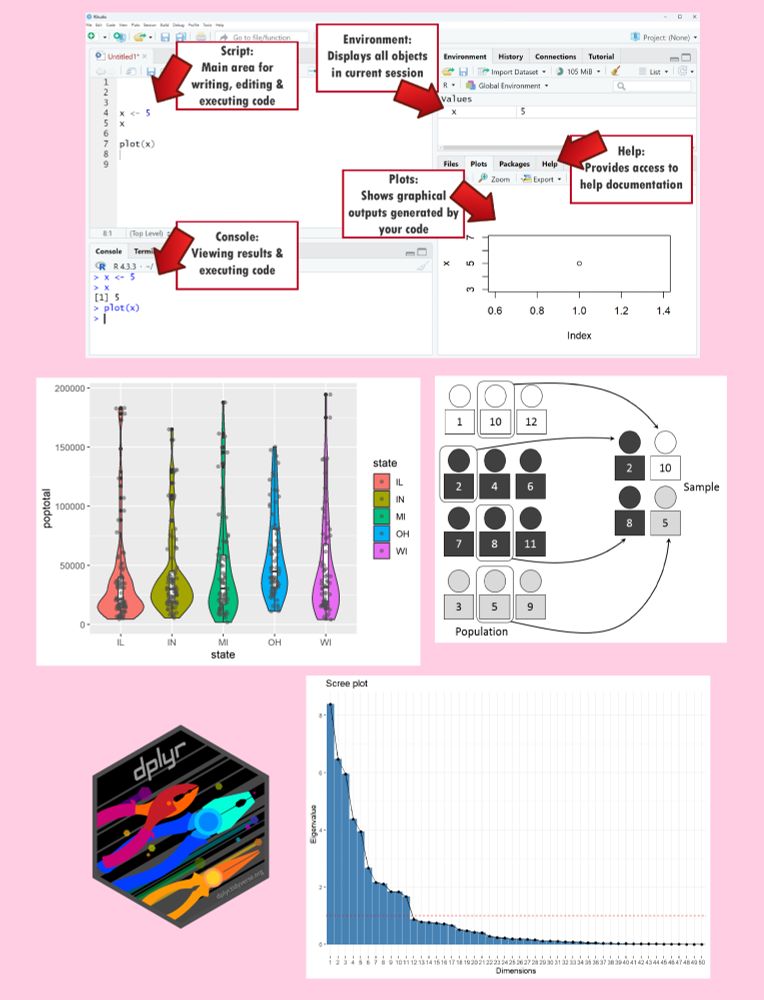
Most data projects follow a clear sequential process:
1) Data Import
2) Data Manipulation
3) Data Visualization
4) Data Analysis
Free R video: www.youtube.com/watch?v=l2Og...
My online courses also follow this structure: statisticsglobe.com/courses
#data #datascience #statistics #rstats #python
21.07.2025 09:53 — 👍 5 🔁 1 💬 1 📌 0
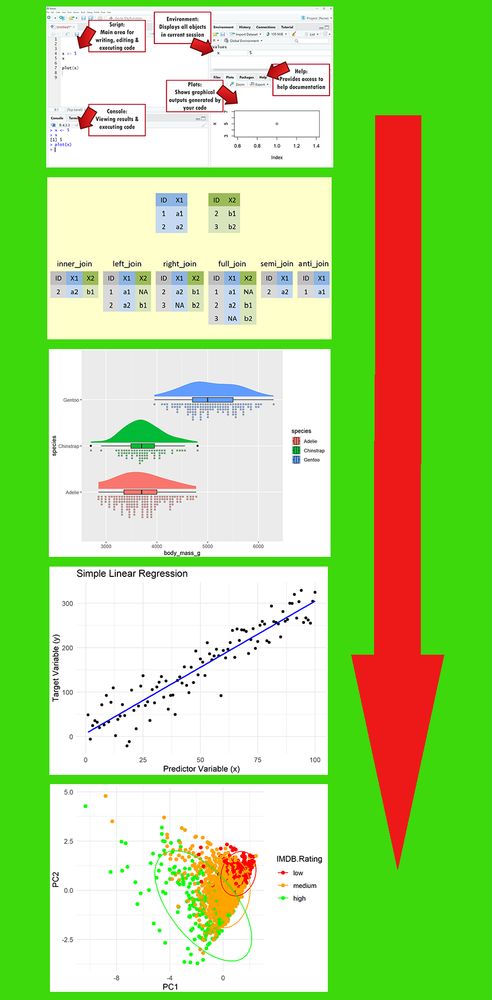
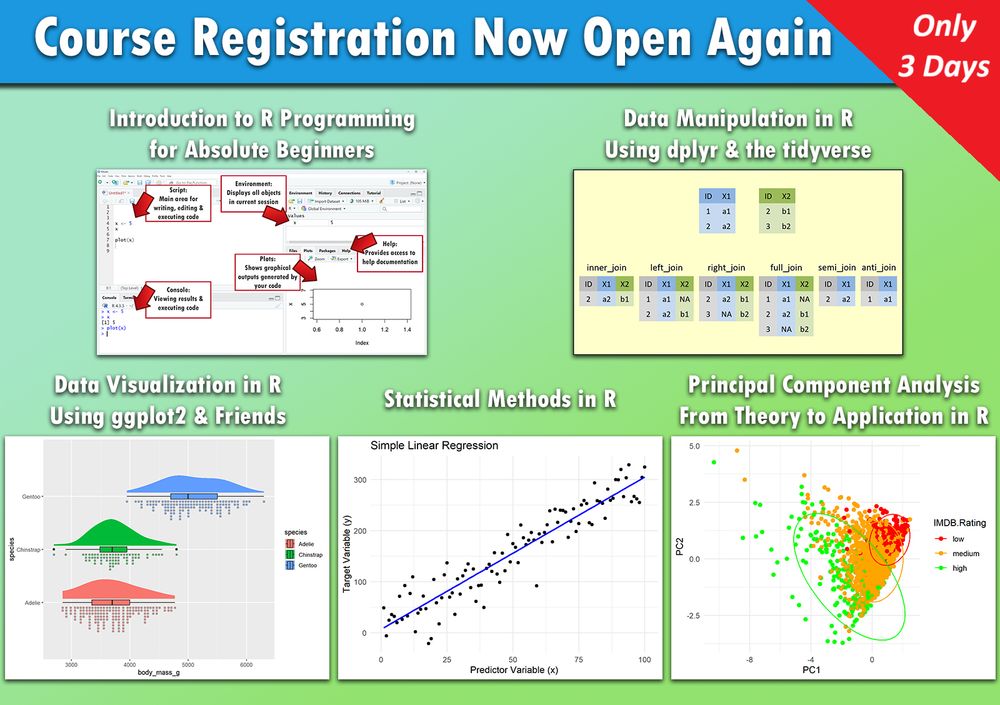
Courses open again with 33% off. Sneak peek below.
Data Manipulation in R: www.youtube.com/watch?v=XGBj...
ggplot2 Extensions: www.youtube.com/watch?v=44hT...
ANOVA in R: www.youtube.com/watch?v=m9hd...
PCA & K-means Clustering: www.youtube.com/watch?v=nzhS...
#datascience #statistics #rstats
18.07.2025 10:12 — 👍 6 🔁 1 💬 0 📌 0
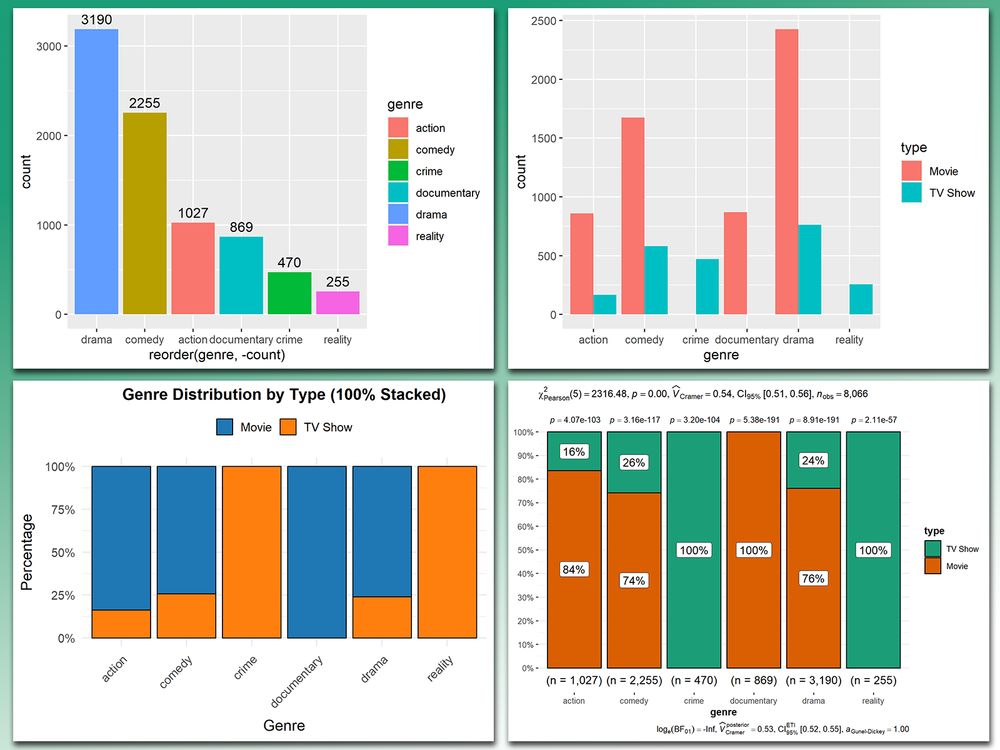
At first glance, bar charts might seem like a simple visualization type.
The attached visual highlights a variety of bar chart styles to inspire your work.
More details: statisticsglobe.com/online-cours...
#datastructure #data #tidyverse #rstats #package #datasciencetraining
17.07.2025 09:38 — 👍 2 🔁 1 💬 0 📌 0
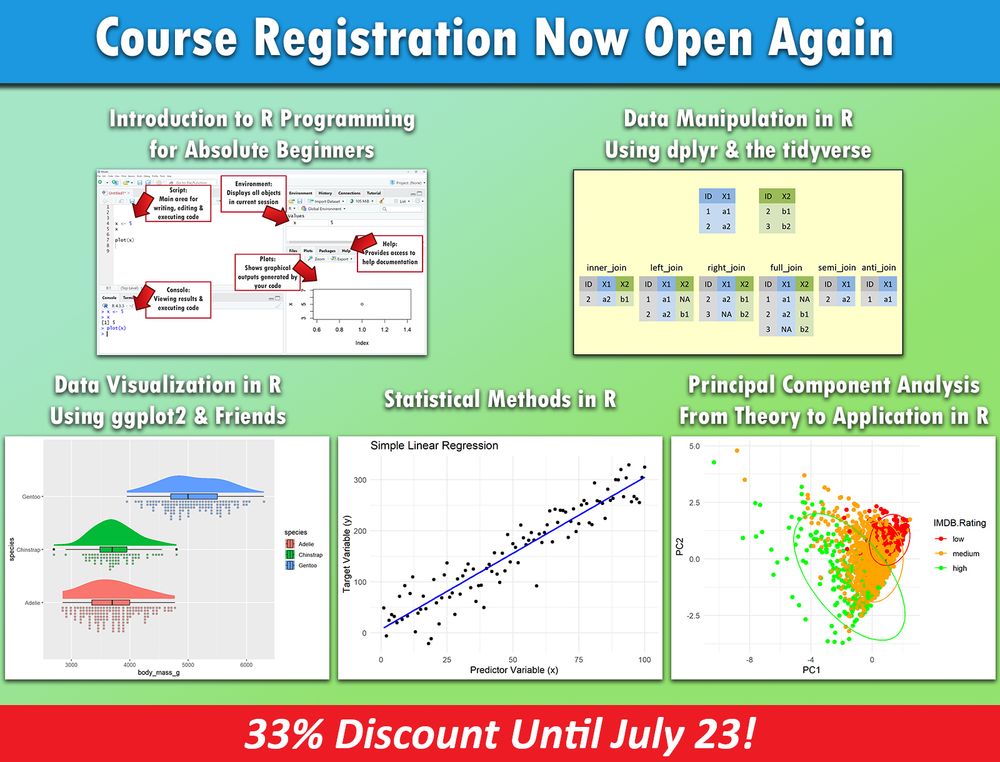
I’ve just returned from parental leave, and enrollment for all my courses is now open again. To celebrate, I'm offering a 33% discount until July 23.
Here’s the full list of my courses: statisticsglobe.com/courses
#statistics #datascience #rstats
16.07.2025 12:49 — 👍 4 🔁 0 💬 0 📌 0
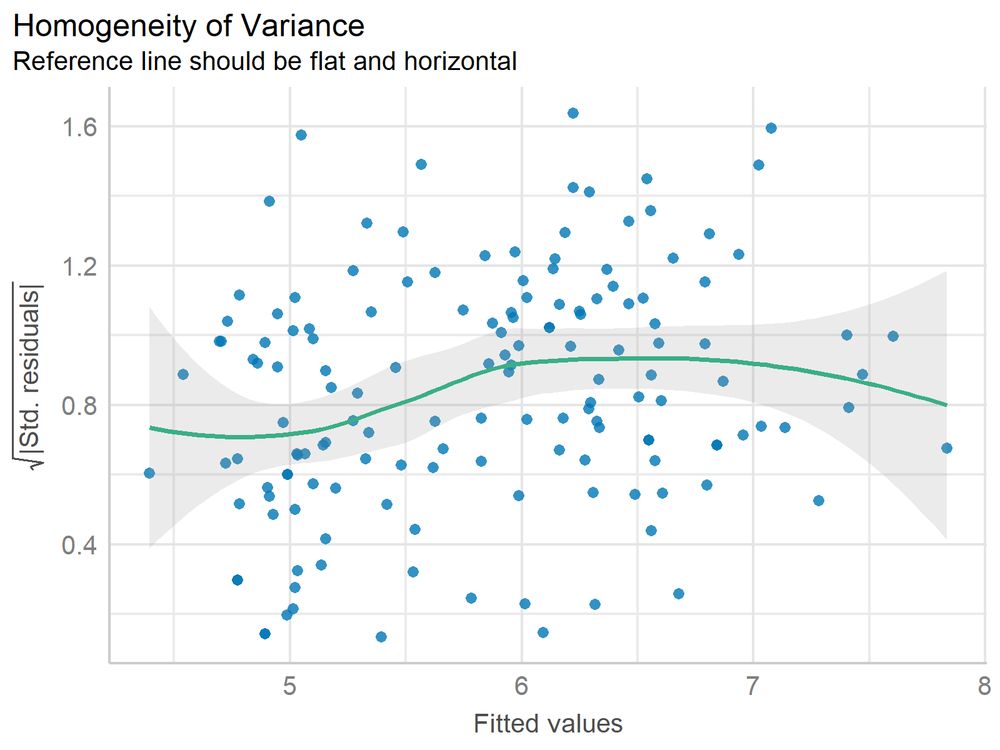
Ensuring homogeneity of variance (homoscedasticity) is often considered a key assumption in linear regression.
The plot below visually demonstrates how heteroscedasticity can manifest in residuals.
Learn more: eepurl.com/gH6myT
#rprogramminglanguage #advancedanalytics #package
14.07.2025 14:23 — 👍 3 🔁 1 💬 0 📌 0
Efficient data manipulation is essential when working with large data sets, and dplyr in R makes row and column operations simple and intuitive.
Tutorial: www.youtube.com/watch?v=OpNQ...
More: statisticsglobe.com/online-cours...
#database #coding #package #data #rstats
10.07.2025 09:38 — 👍 5 🔁 2 💬 0 📌 0
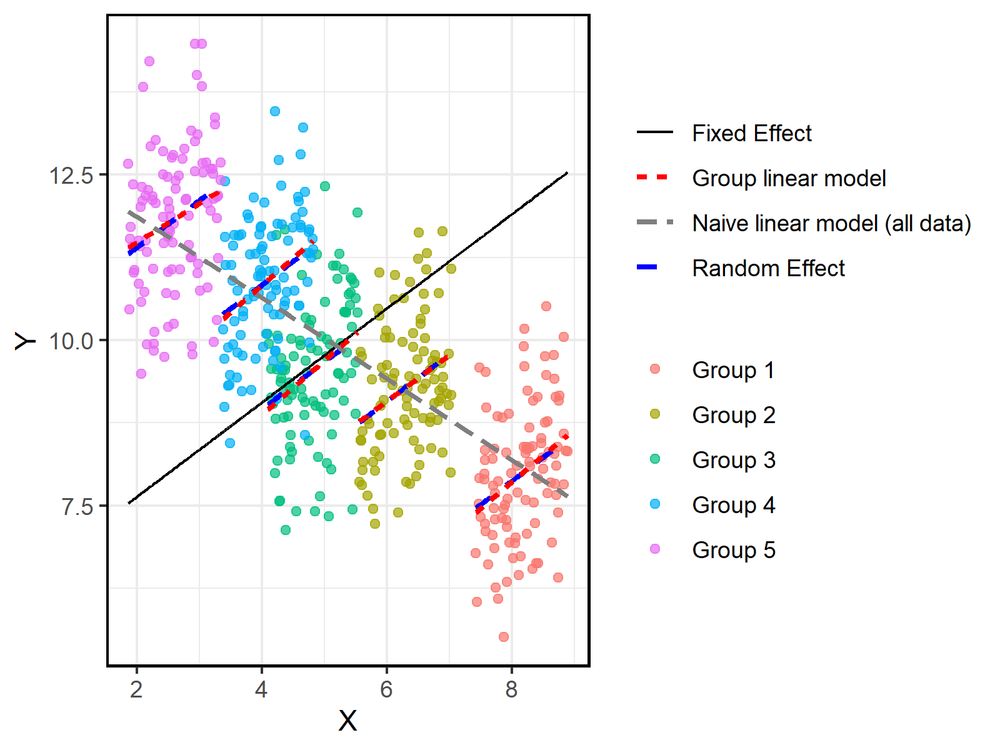
I recently made a very popular LinkedIn post about Simpson's Paradox, which resulted in an engaging conversation. Paul Julian made a great comment on the relationship between Mixed Effects Models and Simpson's Paradox.
Original post: www.linkedin.com/posts/joachi...
#datavisualization #database
07.07.2025 14:23 — 👍 4 🔁 2 💬 0 📌 0
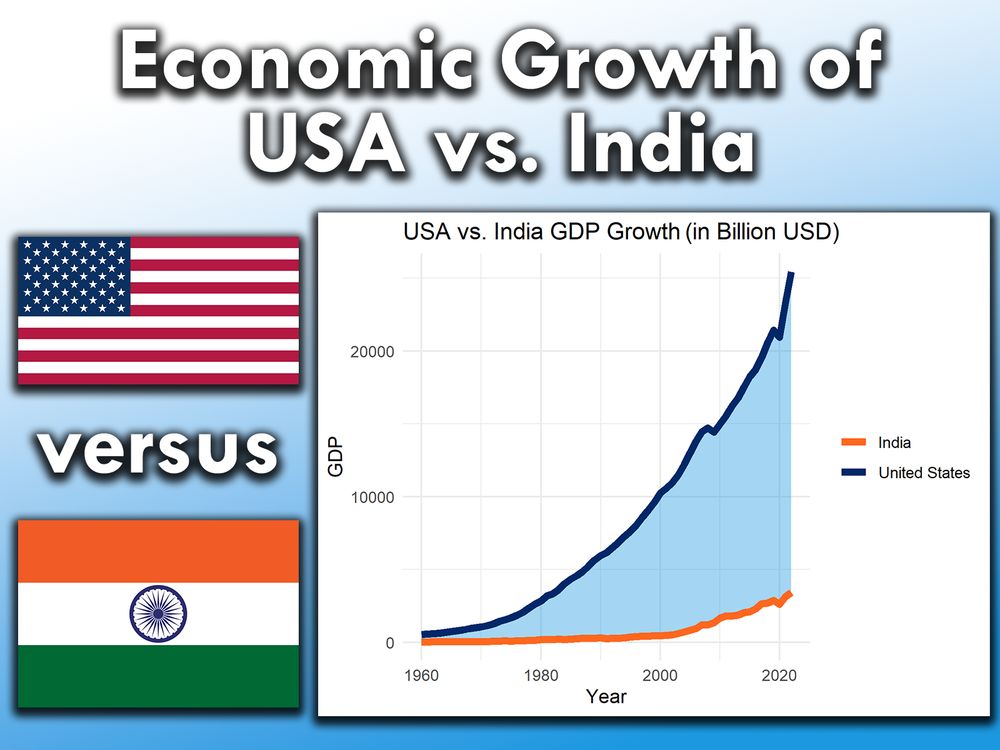
Did you know that India is one of the fastest-growing major economies in the world? 🇮🇳 Meanwhile, the USA remains the largest economy by nominal GDP. 🇺🇸
Both countries face unique challenges but have the potential for continued economic growth.
More: statisticsglobe.com/gdp-usa-vs-i...
#research
03.07.2025 09:38 — 👍 1 🔁 1 💬 0 📌 0
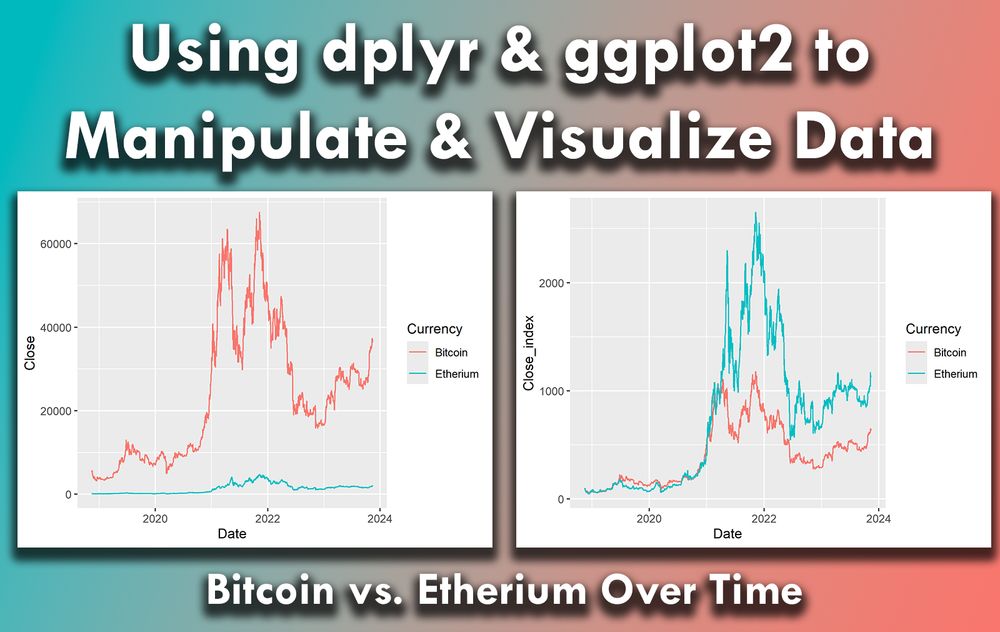
Using dplyr and ggplot2 in R can significantly streamline your data analysis process, making it easier to work with complex data sets.
I have created a video tutorial in collaboration with Albert Rapp: www.youtube.com/watch?v=EKIS...
#coding #datavisualization #rprogramming #dataviz #statistics
30.06.2025 14:23 — 👍 2 🔁 0 💬 0 📌 0
Want to bring your plots to life? gganimate is a powerful extension for ggplot2 in R that transforms static visualizations into dynamic animations.
The attached animated visualization, which I created with gganimate, shows inflation trends for six countries since 1980.
#datavisualization
26.06.2025 09:38 — 👍 4 🔁 0 💬 0 📌 0
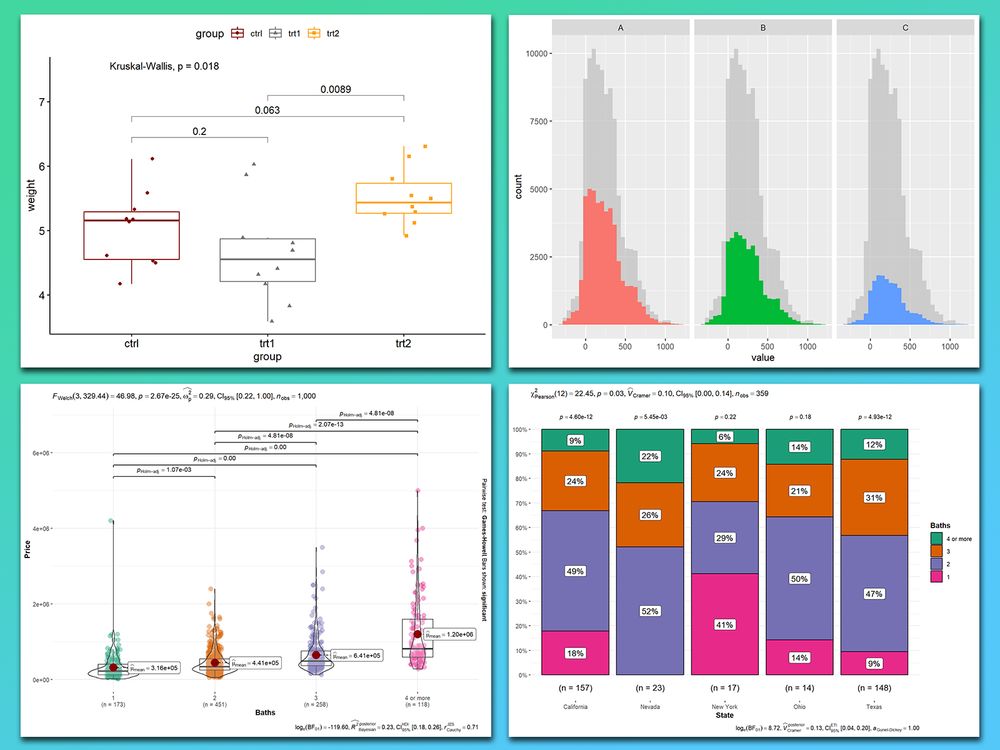
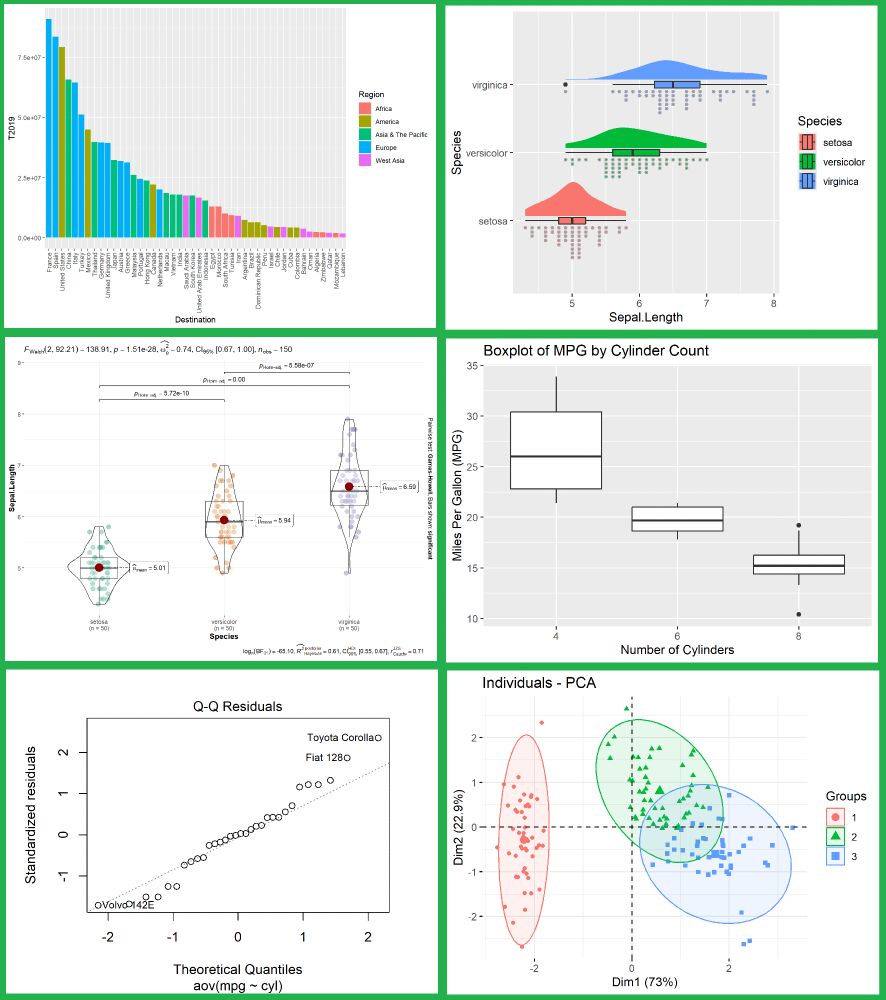
Comparing groups is often one of the main goals in data visualizations. The ggplot2 package in R, along with its powerful extensions, makes it easy to create visualizations.
More: statisticsglobe.com/online-cours...
#businessanalyst #datavisualization #statistics #package #ggplot2 #rstats
23.06.2025 14:23 — 👍 3 🔁 1 💬 0 📌 0
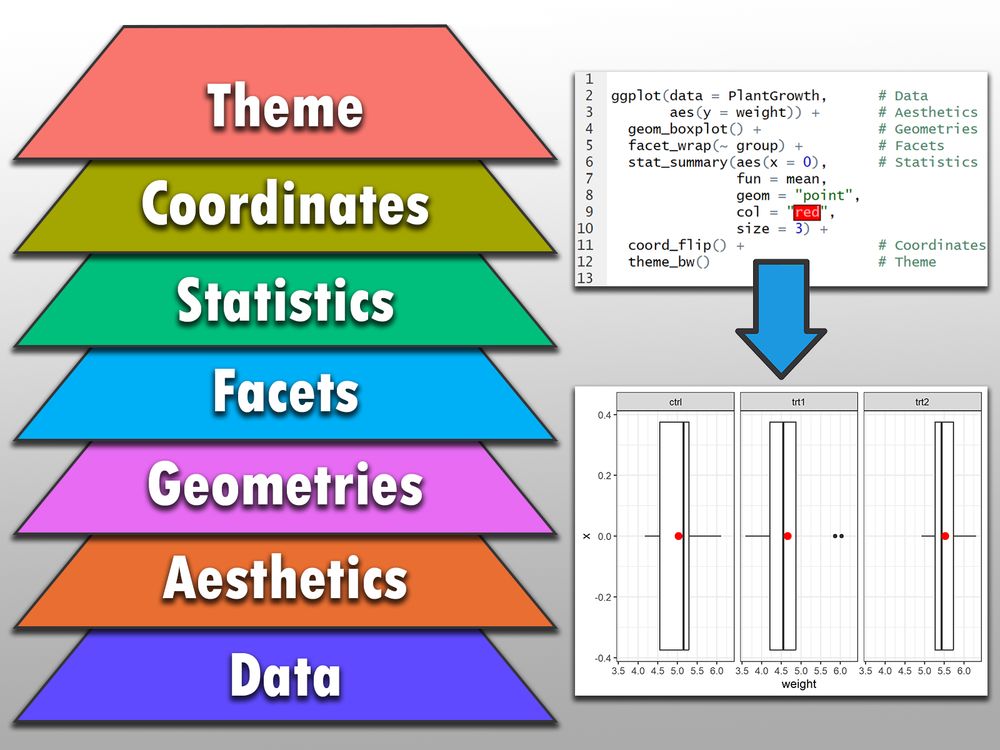
The "Grammar of Graphics" is a powerful concept that ggplot2 in R is built on.
Take a look here for more details: statisticsglobe.com/online-cours...
#rprogramminglanguage #visualanalytics #datascience
19.06.2025 09:38 — 👍 2 🔁 1 💬 0 📌 0
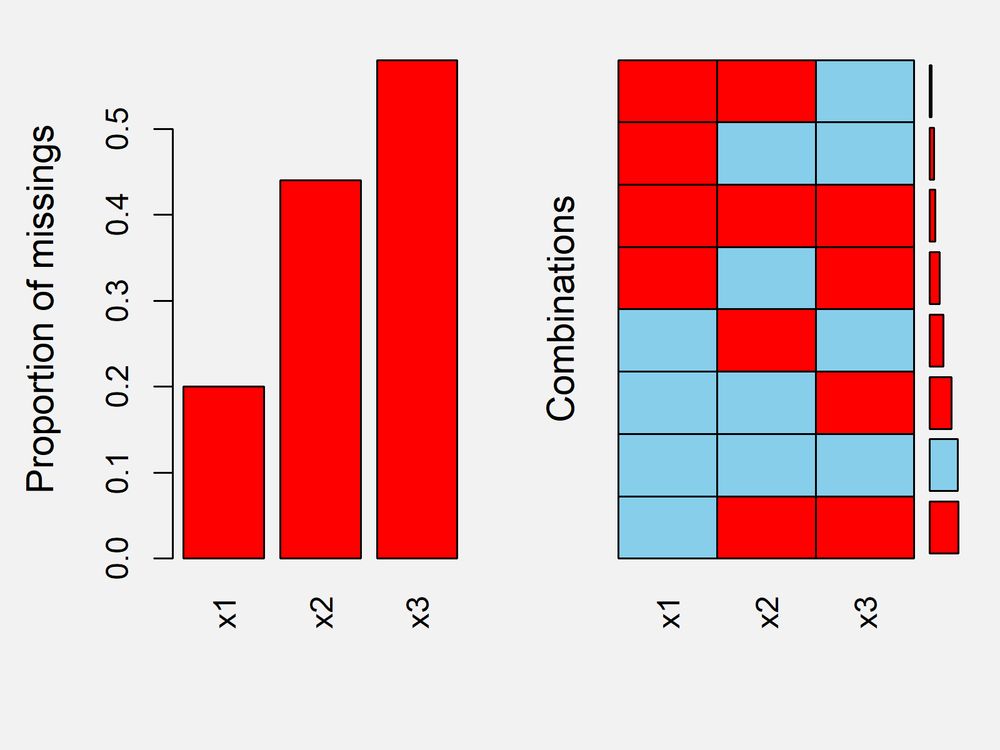
Missing values are a common challenge in data analysis, and properly reporting them is a critical step in understanding your data.
The attached image, created using the VIM package in R, illustrates the proportion of missing values across variables.
More: eepurl.com/gH6myT
#advancedanalytics
16.06.2025 14:23 — 👍 0 🔁 0 💬 0 📌 0
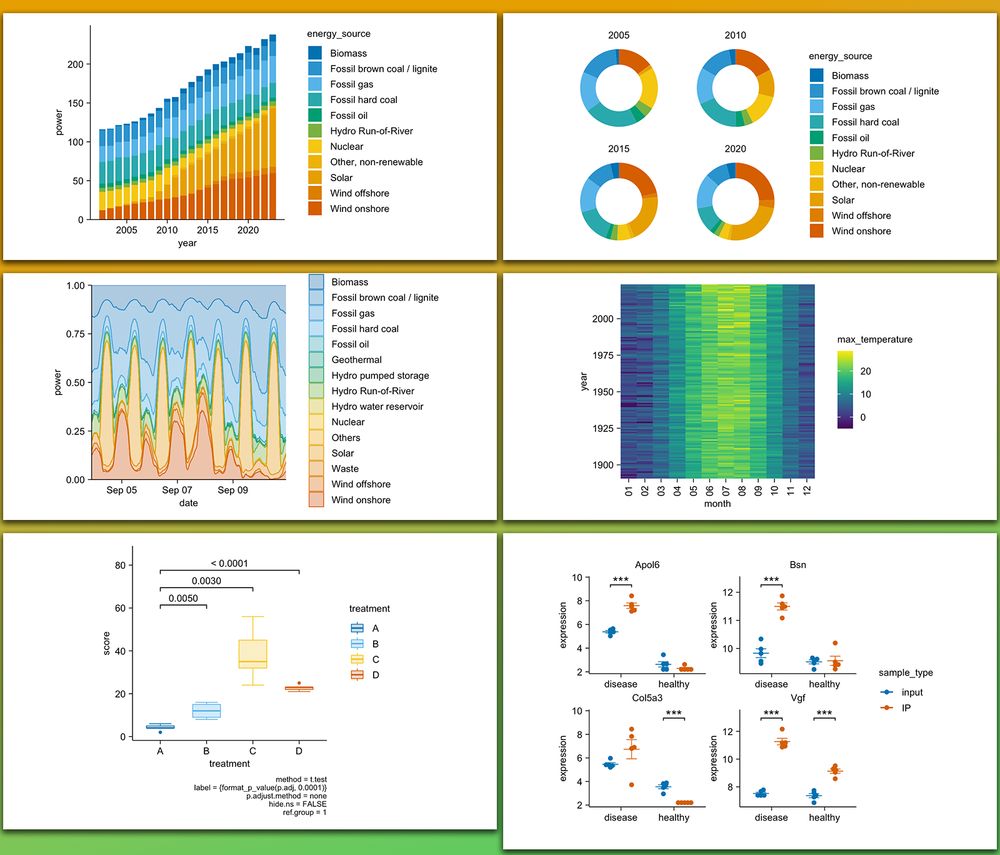
I recently discovered the tidyplots package in R, and it’s impressive how effortlessly it enables you to create beautiful, publication-ready plots.
Credits: Jan Broder Engler: jbengler.github.io/tidyplots/
#statisticsclass #datavisualization
12.06.2025 09:38 — 👍 6 🔁 0 💬 0 📌 0
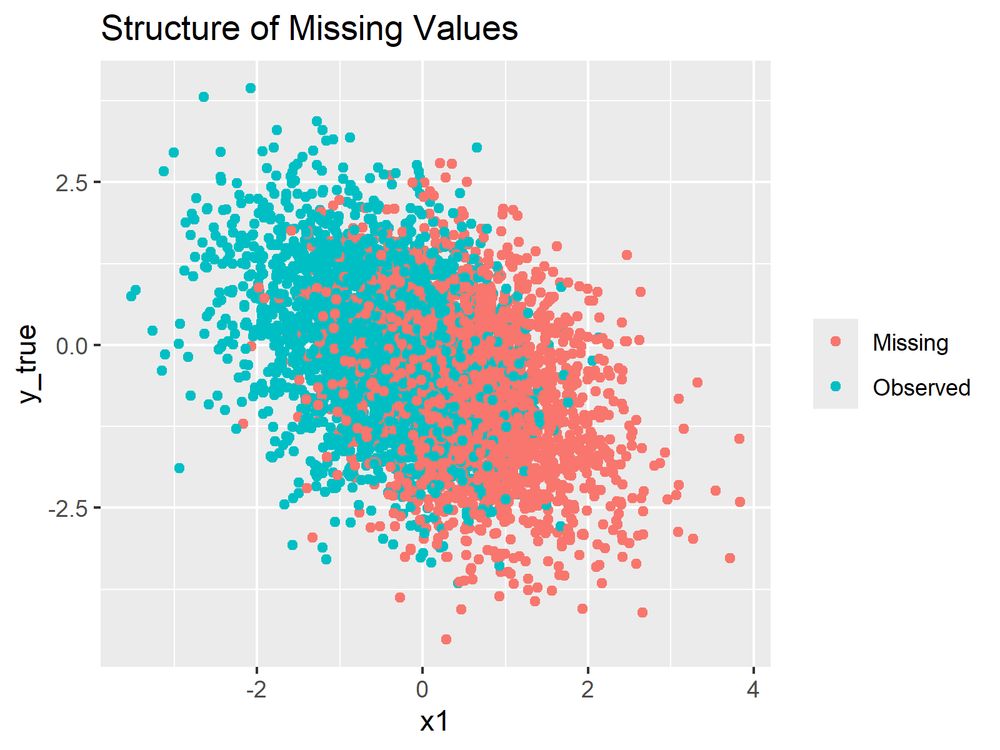
Missing data is a common issue in data analysis, and there are several approaches to handle it.
The attached image illustrates the structure of missing values in a data set, with missing values shown in red and observed values in blue.
More: www.youtube.com/watch?v=oPFs....
#rprogramminglanguage
09.06.2025 14:23 — 👍 2 🔁 1 💬 1 📌 0

Final reminder that registration for all Statistics Globe online courses closes today and won’t reopen until the end of July.
You can find all courses here: statisticsglobe.com/courses
#statistics #datascience #rasts #dataviz #statisticalanalysis
05.06.2025 16:44 — 👍 1 🔁 0 💬 0 📌 0
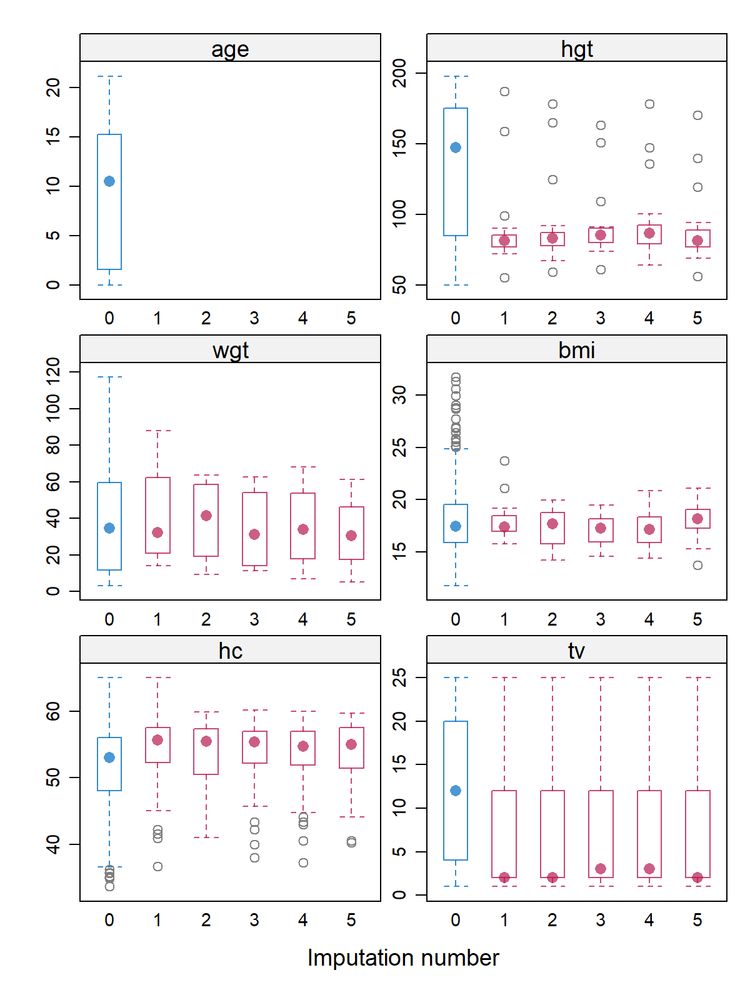
When performing multiple imputation of missing data, it is essential to evaluate how the imputed values compare to the observed data.
The attached image was created with the bwplot() function.
More: eepurl.com/gH6myT
#rstats #bigdata #businessanalyst #datavisualization
05.06.2025 09:38 — 👍 4 🔁 2 💬 0 📌 0

As announced yesterday, registration for all my courses is now open again for three days.
Please note that it will close tomorrow night and won’t reopen until the end of July.
Find all courses here: statisticsglobe.com/courses
Regards,
Joachim
#rstats #dataanalysis #datascience #statistics
04.06.2025 11:20 — 👍 1 🔁 0 💬 0 📌 0
Registration for all my courses was closed until the end of July due to my parental leave.
However, since several people asked about early enrollment, I’ve decided to reopen them until this Thursday, June 5.
Find my courses here: statisticsglobe.com/courses
#datascience #statistics #rstats
03.06.2025 16:13 — 👍 2 🔁 0 💬 0 📌 0
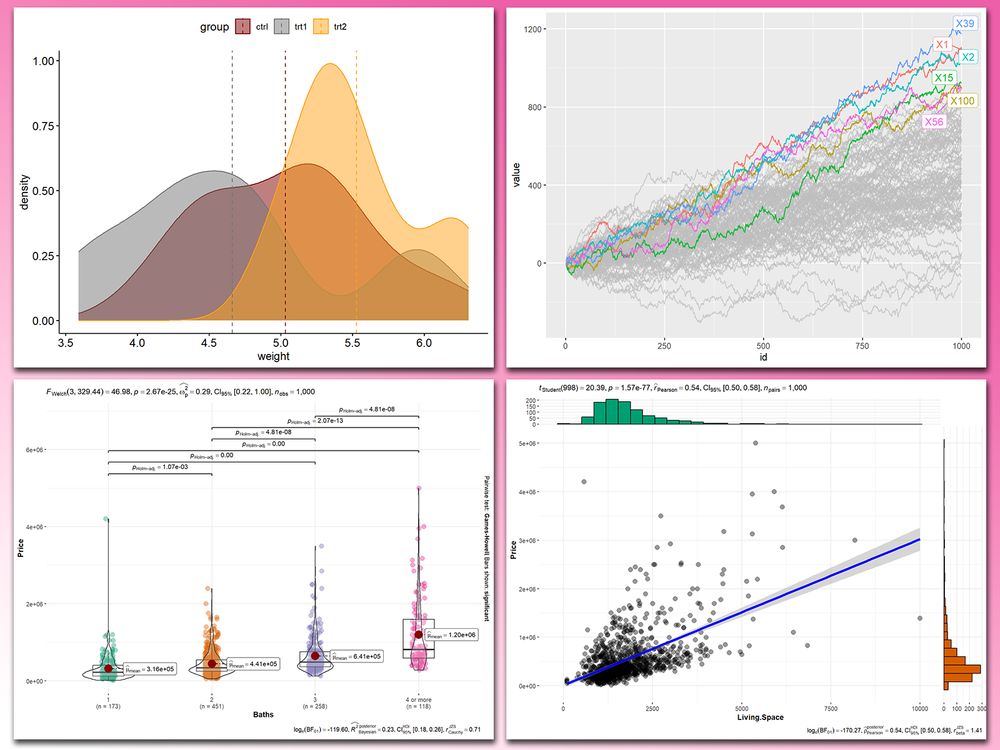
Adding statistical metrics to your plots can transform your visualizations from basic to highly informative.
More details: statisticsglobe.com/online-cours...
#rprogramminglanguage #visualanalytics
02.06.2025 14:23 — 👍 3 🔁 0 💬 0 📌 0
There are many reasons why you should switch to R, even if you are already familiar with another tool!
More information: statisticsglobe.com/online-cours...
#rprogramminglanguage #data #datasciencecourse
29.05.2025 09:38 — 👍 0 🔁 1 💬 0 📌 0
If you're a Stata user, you should switch to R now!
Thinking about switching to R? Check out my online course for absolute beginners in R programming.
Click this link for detailed information: statisticsglobe.com/online-cours...
#advancedanalytics #data #package #datasciencecourse
26.05.2025 14:23 — 👍 2 🔁 0 💬 0 📌 0