Love it! Thank you for putting my tutorial to good use and for tagging me!
08.11.2025 17:49 — 👍 20 🔁 1 💬 0 📌 0
Lovely implementation of my river basin tutorial! Thank you!
Here is the tutorial 👉 youtu.be/HugGwjogPv0
04.11.2025 12:42 — 👍 14 🔁 0 💬 0 📌 0
YouTube video by Milos Makes Maps
Can You Create Stunning Lighthouse Maps with Python in Just 20 Minutes?
From zero to a cinematic lighthouse map in 20 minutes.
My new hands-on tutorial shows you how to leverage Python to make stunning pulsing-beacon animation
Watch here 👉 youtu.be/BQSuZgzheNk
Which coastline should we light up next?
#Python #GIS #Mapping
02.11.2025 13:06 — 👍 9 🔁 0 💬 0 📌 0
Lol, literally every programming language can provide a view of a scene you are trying to capture and has debugging. Not sure what you are trying to argue
02.11.2025 07:22 — 👍 2 🔁 0 💬 0 📌 0
In this project "only code" means no GUI modeling (e.g., no CityEngine/Blender), just data transformed through a scripted pipeline to create a beautiful 3D city model. My video is about reproducibility anyone can rerun.
01.11.2025 15:16 — 👍 2 🔁 0 💬 1 📌 0
*Steve, apologies for the typo @stevetornes.bsky.social
01.11.2025 11:13 — 👍 2 🔁 0 💬 0 📌 0
Rayrender can do it. Not showing it in this tutorial though
01.11.2025 09:02 — 👍 1 🔁 0 💬 0 📌 0
I love how it looks Stebe! Awesome work and thank you for bringing my tutorial to life!
Tutorial 👉 youtu.be/E7F75OFXu-I
01.11.2025 07:14 — 👍 10 🔁 2 💬 3 📌 0
YouTube video by Milos Makes Maps
I Built a 3D City Using Only Code
I used to stare at OpenStreetMap and imagine the city lifting off the screen. Today it does. I’ve just published a step-by-step guide to turn raw OSM into a fully styled 3D city.
👉 youtu.be/E7F75OFXu-I
Build with me!
26.10.2025 15:49 — 👍 12 🔁 0 💬 0 📌 0

𝖳𝗁𝖾 𝖫𝖺𝗇𝖽 𝖯𝗋𝗈𝖽𝗎𝖼𝗍𝗂𝗏𝗂𝗍𝗒 𝖣𝗒𝗇𝖺𝗆𝗂𝖼𝗌 (𝖫𝖯𝖣) 𝗂𝗇𝖽𝗂𝖼𝖺𝗍𝗈𝗋 𝗆𝖾𝖺𝗌𝗎𝗋𝖾𝗌 𝗅𝗈𝗇𝗀-𝗍𝖾𝗋𝗆 𝖼𝗁𝖺𝗇𝗀𝖾𝗌 𝗂𝗇 𝗏𝖾𝗀𝖾𝗍𝖺𝗍𝗂𝗈𝗇 𝗉𝗋𝗈𝖽𝗎𝖼𝗍𝗂𝗏𝗂𝗍𝗒 𝖻𝗒 𝖼𝗈𝗆𝖻𝗂𝗇𝗂𝗇𝗀 𝗍𝗋𝖾𝗇𝖽, 𝗌𝗍𝖺𝗍𝖾, 𝖺𝗇𝖽 𝗉𝖾𝗋𝖿𝗈𝗋𝗆𝖺𝗇𝖼𝖾 𝗅𝖺𝗒𝖾𝗋𝗌 𝖽𝖾𝗋𝗂𝗏𝖾𝖽 𝖿𝗋𝗈𝗆 𝟣𝟧+ 𝗒𝖾𝖺𝗋𝗌 𝗈𝖿 𝗌𝖺𝗍𝖾𝗅𝗅𝗂𝗍𝖾 𝖭𝖣𝖵𝖨 𝖽𝖺𝗍𝖺 (𝟣𝟫𝟪𝟤–𝟤𝟢𝟣𝟥).
𝖫𝖯𝖣 𝗌𝖾𝗋𝗏𝖾𝗌 𝖺𝗌 𝗈𝗇𝖾 𝗈𝖿 𝗍𝗁𝖾 𝖼𝗈𝗋𝖾 𝗀𝗅𝗈𝖻𝖺𝗅 𝗂𝗇𝖽𝗂𝖼𝖺𝗍𝗈𝗋𝗌 𝖿𝗈𝗋 𝖲𝖣𝖦 𝟣𝟧.𝟥 (𝖫𝖺𝗇𝖽 𝖣𝖾𝗀𝗋𝖺𝖽𝖺𝗍𝗂𝗈𝗇 𝖭𝖾𝗎𝗍𝗋𝖺𝗅𝗂𝗍𝗒) 𝗎𝗇𝖽𝖾𝗋 𝗍𝗁𝖾 𝖴𝖭𝖢𝖢𝖣, 𝗁𝖾𝗅𝗉𝗂𝗇𝗀 𝖼𝗈𝗎𝗇𝗍𝗋𝗂𝖾𝗌 𝗍𝗋𝖺𝖼𝗄 𝗐𝗁𝖾𝗋𝖾 𝗅𝖺𝗇𝖽 𝗂𝗌 𝗅𝗈𝗌𝗂𝗇𝗀 𝗈𝗋 𝗀𝖺𝗂𝗇𝗂𝗇𝗀 𝖻𝗂𝗈𝗅𝗈𝗀𝗂𝖼𝖺𝗅 𝗉𝗋𝗈𝖽𝗎𝖼𝗍𝗂𝗏𝗂𝗍𝗒.
𝖴𝗇𝗅𝗂𝗄𝖾 𝗌𝗂𝗇𝗀𝗅𝖾-𝗒𝖾𝖺𝗋 𝗏𝖾𝗀𝖾𝗍𝖺𝗍𝗂𝗈𝗇 𝗂𝗇𝖽𝗂𝖼𝖾𝗌, 𝖫𝖯𝖣 𝗋𝖾𝖿𝗅𝖾𝖼𝗍𝗌 𝗉𝖾𝗋𝗌𝗂𝗌𝗍𝖾𝗇𝗍 𝖾𝖼𝗈𝗌𝗒𝗌𝗍𝖾𝗆 𝗍𝗋𝖾𝗇𝖽𝗌, 𝖽𝗂𝗌𝗍𝗂𝗇𝗀𝗎𝗂𝗌𝗁𝗂𝗇𝗀 𝗍𝖾𝗆𝗉𝗈𝗋𝖺𝗋𝗒 𝖼𝗅𝗂𝗆𝖺𝗍𝗂𝖼 𝖿𝗅𝗎𝖼𝗍𝗎𝖺𝗍𝗂𝗈𝗇𝗌 𝖿𝗋𝗈𝗆 𝗀𝖾𝗇𝗎𝗂𝗇𝖾 𝖽𝖾𝗀𝗋𝖺𝖽𝖺𝗍𝗂𝗈𝗇 𝗈𝗋 𝗋𝖾𝖼𝗈𝗏𝖾𝗋𝗒.
𝖳𝗁𝖾 𝗈𝖻𝗌𝖾𝗋𝗏𝖾𝖽 𝗉𝗋𝗈𝖽𝗎𝖼𝗍𝗂𝗏𝗂𝗍𝗒 𝖽𝖾𝖼𝗅𝗂𝗇𝖾𝗌 𝖺𝗋𝖾 𝗇𝗈𝗍 𝗌𝗂𝗆𝗉𝗅𝗒 𝗏𝖾𝗀𝖾𝗍𝖺𝗍𝗂𝗈𝗇 𝗅𝗈𝗌𝗌𝖾𝗌 𝗍𝗁𝖾𝗒 𝗋𝖾𝗉𝗋𝖾𝗌𝖾𝗇𝗍 𝗋𝖾𝖽𝗎𝖼𝖾𝖽 𝖾𝖼𝗈𝗌𝗒𝗌𝗍𝖾𝗆 𝖾𝖿𝖿𝗂𝖼𝗂𝖾𝗇𝖼𝗒, 𝗐𝗁𝖾𝗋𝖾 𝗌𝗈𝗂𝗅𝗌, 𝗐𝖺𝗍𝖾𝗋 𝖼𝗒𝖼𝗅𝖾𝗌, 𝖺𝗇𝖽 𝗏𝖾𝗀𝖾𝗍𝖺𝗍𝗂𝗈𝗇 𝗂𝗇𝗍𝖾𝗋𝖺𝖼𝗍𝗂𝗈𝗇𝗌 𝗇𝗈 𝗅𝗈𝗇𝗀𝖾𝗋 𝗌𝗎𝗉𝗉𝗈𝗋𝗍 𝖼𝗈𝗇𝗌𝗂𝗌𝗍𝖾𝗇𝗍 𝖻𝗂𝗈𝗆𝖺𝗌𝗌 𝗀𝗋𝗈𝗐𝗍𝗁.
𝖨𝗇 𝖡𝗋𝖺𝗓𝗂𝗅’𝗌 𝗌𝗈𝗎𝗍𝗁𝖾𝗋𝗇 𝖺𝗀𝗋𝗂𝖼𝗎𝗅𝗍𝗎𝗋𝖺𝗅 𝗓𝗈𝗇𝖾𝗌, 𝗉𝗋𝗈𝖽𝗎𝖼𝗍𝗂𝗏𝗂𝗍𝗒 𝗀𝖺𝗂𝗇𝗌 𝖼𝖺𝗇 𝖻𝖾 𝖽𝗈𝗎𝖻𝗅𝖾-𝖾𝖽𝗀𝖾𝖽: 𝗍𝗁𝖾𝗒 𝗆𝖺𝗒 𝗂𝗇𝖽𝗂𝖼𝖺𝗍𝖾 𝗂𝗇𝗍𝖾𝗇𝗌𝗂𝖿𝗂𝖼𝖺𝗍𝗂𝗈𝗇 𝗋𝖺𝗍𝗁𝖾𝗋 𝗍𝗁𝖺𝗇 𝗋𝖾𝗌𝗍𝗈𝗋𝖺𝗍𝗂𝗈𝗇, 𝗈𝖿𝗍𝖾𝗇 𝖺𝖼𝗁𝗂𝖾𝗏𝖾𝖽 𝗍𝗁𝗋𝗈𝗎𝗀𝗁 𝗁𝗂𝗀𝗁 𝖿𝖾𝗋𝗍𝗂𝗅𝗂𝗓𝖾𝗋 𝗂𝗇𝗉𝗎𝗍𝗌 𝖺𝗇𝖽 𝗆𝖾𝖼𝗁𝖺𝗇𝗂𝗓𝖺𝗍𝗂𝗈𝗇.
🇧🇷 L🅐🅝🅓 P🅡🅞🅓🅤🅒🅣🅘🅥🅘🅣🅨 D🅨🅝🅐🅜🅘🅒🅢 🅘🅝 B🅡🅐🅩🅘🅛
𝖦𝗋𝖾𝖾𝗇𝗂𝗇𝗀 𝗂𝗇 𝗍𝗁𝖾 𝖠𝗆𝖺𝗓𝗈𝗇 & 𝗌𝗈𝗎𝗍𝗁 𝗌𝗁𝗈𝗐𝗌 𝗋𝗂𝗌𝗂𝗇𝗀 𝗉𝗋𝗈𝖽𝗎𝖼𝗍𝗂𝗏𝗂𝗍𝗒 🌱
𝖡𝗎𝗍 𝗈𝗋𝖺𝗇𝗀𝖾 & 𝗒𝖾𝗅𝗅𝗈𝗐 𝗓𝗈𝗇𝖾𝗌 𝗋𝖾𝗏𝖾𝖺𝗅 𝗌𝗍𝗋𝖾𝗌𝗌 𝖽𝖾𝖿𝗈𝗋𝖾𝗌𝗍𝖺𝗍𝗂𝗈𝗇, 𝖽𝗋𝗈𝗎𝗀𝗁𝗍 & 𝖼𝗅𝗂𝗆𝖺𝗍𝖾 𝗉𝗋𝖾𝗌𝗌𝗎𝗋𝖾 𝗋𝖾𝖽𝗎𝖼𝗂𝗇𝗀 𝗋𝖾𝗌𝗂𝗅𝗂𝖾𝗇𝖼𝖾 🌾🔥
𝖧𝗈𝗐 ? 𝗌𝖾𝖾 @milos-makes-maps.bsky.social 𝗍𝗎𝗍
#𝖫𝖺𝗇𝖽𝖣𝖾𝗀𝗋𝖺𝖽𝖺𝗍𝗂𝗈𝗇 #𝖡𝗋𝖺𝗓𝗂𝗅 #𝖤𝖺𝗋𝗍𝗁𝖮𝖻𝗌𝖾𝗋𝗏𝖺𝗍𝗂𝗈𝗇 #𝖱𝗌𝗍𝖺𝗍s
15.10.2025 21:52 — 👍 12 🔁 4 💬 0 📌 0
Nicely done!
Here's the tutorial 👉 youtu.be/JfDW8P51MmA
10.10.2025 18:36 — 👍 7 🔁 1 💬 0 📌 0
Thank you for the shout-out and for putting my tutorial to good use!
09.10.2025 18:03 — 👍 1 🔁 0 💬 0 📌 0
YouTube video by Milos Makes Maps
Python: The Secret Weapon for Analyzing Google Earth Engine Data
I’ve been deep in R for GIS mapping for years, but today marks a thrilling pivot: my very first Python tutorial is live!
We’ll extract Google’s latest satellite embeddings, run k-means analysis, and map our results
Everyone, watch the tutorial youtu.be/WjoB7mou2n8
05.10.2025 13:26 — 👍 21 🔁 3 💬 1 📌 0
YouTube video by Milos Makes Maps
30-Minute Travel Maps: The Secret to Fast Exploration
How far can you go in 30 minutes—from your doorstep? ⏱️
I just dropped a from-scratch tutorial to build travel-time maps in R (OSM → network → isochrones → crisp basemap).
Ship your city now.
🎥 Watch now: www.youtube.com/watch?v=M-O0...
14.09.2025 14:13 — 👍 14 🔁 2 💬 0 📌 0

#geodata #mapping #datavis
Precipitation (rain and snow) vs temperature in Germany
by @milos-makes-maps.bsky.social over on the birdsite
06.09.2025 08:26 — 👍 12 🔁 2 💬 0 📌 1
Thank you dear Miska!
31.08.2025 09:17 — 👍 9 🔁 0 💬 1 📌 0
YouTube video by Milos Makes Maps
Revolutionizing Land Cover Analysis with Google Earth Engine!
Google Earth Engine now delivers annual 10 m Satellite Embeddings (64 bands per pixel!
In my new tutorial, I walk you through:
✅Loading & exploring AlphaEarth embeddings in R
✅Sampling & k-means clustering
✅Visualizing beautiful results
👉 youtu.be/dmtNAYb5woE
#GoogleEarthEngine #AlphaEarth #GIS
10.08.2025 13:21 — 👍 13 🔁 2 💬 1 📌 0

Milos Makes Maps
I paint the world with R and teach you how to unleash your inner map artist. Join my map adventures and tutorials now!
Earth Engine now hosts annual 10 m Satellite Embeddings (64 bands per pixel) powered by the new AlphaEarth Foundations model.
My next video on YouTube (milos-makes-maps) will show how to run part of its workflow in R. Subscribe to catch it 👉🏻 youtube.com/@milos-makes...
#AlphaEarth #Rstats #GIS
03.08.2025 09:03 — 👍 24 🔁 2 💬 1 📌 0
Thank you for spreading the word @miskaknapek.bsky.social ♥️
03.08.2025 08:58 — 👍 3 🔁 0 💬 1 📌 0
ps. Milos here - @milos-makes-maps.bsky.social - has released a #GIS #geodata programming book with R #rlang
It ought to be good, knowing Milos.
payhip.com/b/MH9Ot
21.07.2025 14:55 — 👍 4 🔁 1 💬 0 📌 0
YouTube video by Milos Makes Maps
How to Make Awesome 3D Tree Cover Maps from Free Satellite Data!
Ready to create stunning 3D tree cover maps entirely for free?
My new tutorial guides you step-by-step on turning free satellite data from Google Dynamic World into high-quality visualizations.
Watch here 👉🏻 youtu.be/gyfy6HdbcLw
#GIS #RemoteSensing #3DMapping #ForestConservation #RStats
06.07.2025 10:57 — 👍 18 🔁 5 💬 0 📌 0
Beautiful and informative map 🇨🇭
08.06.2025 13:37 — 👍 21 🔁 1 💬 1 📌 0
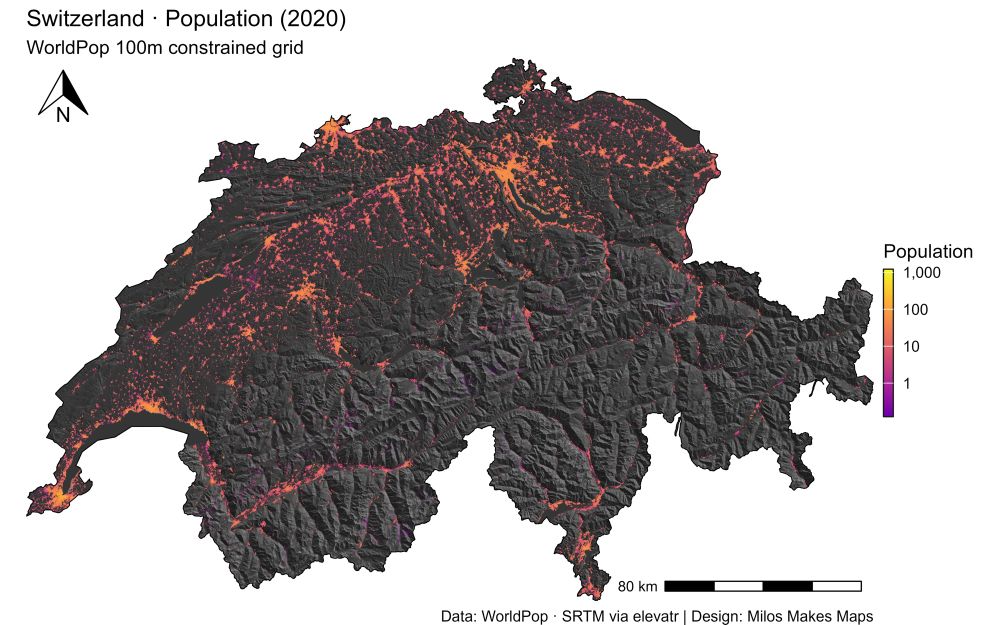
A detailed thematic map of Switzerland visualizing 2020 population distribution using a logarithmic color scale over a shaded relief background. Bright orange and yellow tones indicate high population density areas like Zurich, Geneva, and Basel, while purple and black tones highlight sparsely populated alpine regions. The map includes a north arrow, population legend, and scale bar (80 km). Elevation is represented through 3D hillshading derived from SRTM data.
Data sources: WorldPop 100m constrained grid (2020); SRTM via the elevatr R package.
Map design: Milos Popovic (YouTube: Milos Makes Maps).
Want the secret to stunning maps like this Switzerland hillshade & population visualization?
My latest YouTube tutorial shows you exactly how!
🎬 Watch here 👉🏻 youtu.be/2dNIultQQ4Y
#GIS #Cartography #RStats #DataViz #MilosMakesMaps
08.06.2025 13:07 — 👍 33 🔁 4 💬 1 📌 1
Love it! Thank you for watching my tutorial!!
02.06.2025 07:19 — 👍 8 🔁 1 💬 0 📌 0
Better engage, folks. Otherwise, this content might only be fit for LinkedIn. You've been warned.
26.05.2025 00:35 — 👍 15 🔁 6 💬 0 📌 0
This is neat!
26.05.2025 00:49 — 👍 6 🔁 1 💬 0 📌 0
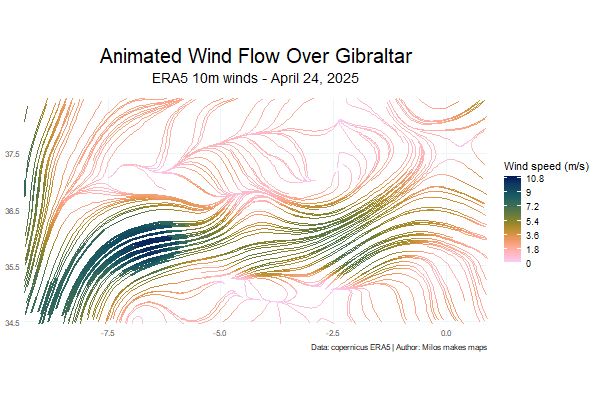
This tutorial will level up your skills and show you how to build animated wind maps from scratch.
Watch it here: https://lnkd.in/e_8QaFn6
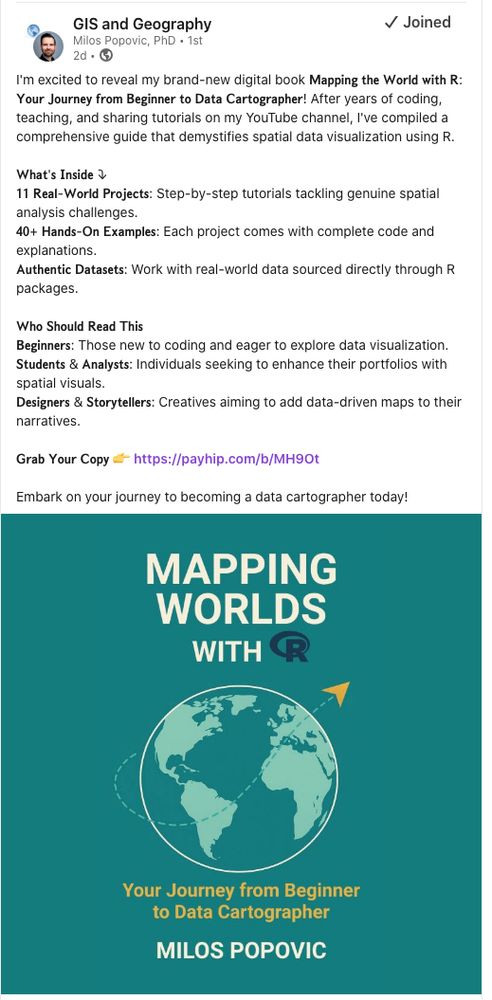
And if you’re ready to go deeper into the world of spatial data, check out my new book:
Mapping Worlds with R: Your Journey from Beginner to Data Cartographer
It’s packed with real projects, full code, and clear explanations for every step of the map-making process.
Grab the book: https://payhip.com/b/MH9Ot
Let’s catch the breeze, beautifully, in R.
#rstats #GIS #DataVisualization #ClimateData #ERA5 #gganimate #WindMapping #Geospatial #EnvironmentalScience #OpenData #MilosMakesMaps #MappingWithR
Want to turn raw wind data into a mesmerizing, animated map?
With R, it’s easier than you think.
My new tutorial shows you how, step by step.
Let’s catch the breeze. ⤵️
youtu.be/EmVbVTqwoMU
#GIS #DataViz #gganimate #metR #WindMap #ClimateData #SpatialAnalysis #MilosMakesMaps
25.05.2025 12:38 — 👍 108 🔁 16 💬 2 📌 2
That's weird
25.05.2025 13:30 — 👍 1 🔁 0 💬 0 📌 0
BlueSky still doesn't support GIF!?! 😡
25.05.2025 13:11 — 👍 7 🔁 0 💬 1 📌 0
This tutorial will level up your skills and show you how to build animated wind maps from scratch.
Watch it here: https://lnkd.in/e_8QaFn6
And if you’re ready to go deeper into the world of spatial data, check out my new book:
Mapping Worlds with R: Your Journey from Beginner to Data Cartographer
It’s packed with real projects, full code, and clear explanations for every step of the map-making process.
Grab the book: https://payhip.com/b/MH9Ot
Let’s catch the breeze, beautifully, in R.
#rstats #GIS #DataVisualization #ClimateData #ERA5 #gganimate #WindMapping #Geospatial #EnvironmentalScience #OpenData #MilosMakesMaps #MappingWithR
Want to turn raw wind data into a mesmerizing, animated map?
With R, it’s easier than you think.
My new tutorial shows you how, step by step.
Let’s catch the breeze. ⤵️
youtu.be/EmVbVTqwoMU
#GIS #DataViz #gganimate #metR #WindMap #ClimateData #SpatialAnalysis #MilosMakesMaps
25.05.2025 12:38 — 👍 108 🔁 16 💬 2 📌 2
Explore the world throughout time, mapped in minute detail by people like you & dedicated to the public domain. OHM is a charter project of @osmus.bsky.social and cousin of @openstreetmap.bsky.social. #oldmaps #dh #hgis
https://www.openhistoricalmap.org
Data Scientist & Researcher | Building models to understand reality | Mapping our world
🌐 http://pablohernandezb.dev
Community geographer, cartographer, pedestrian, cyclist. Author of "The New American Small Town: Lessons for sustainable urban futures" (West Virginia University Press, June 2025). https://communitygeography.kent.edu/
Aquatic ecologist, mud, erosion, applied river restoration planning, QGIS, Sediment Sandy, sometimes Austrian and garden stuff, mom
#python, #rstats, #shiny, #datascience training and consultancy. We help organisations extract the most from their data.
Eco-socialist, ex-Lab, 75+ disabled MH survivor
Support Green & Your Party electoral pact
#FreePalestine #TaxTheRich #BLM #Feminist
Songwriter https://www.youtube.com/watch?v=2AGDJDrklwM&list=
Data Visualization in Life and Health Science. PhD biology, trained in art, Associate Prof
Writes here: https://helenajamborwrites.netlify.app/
Following science & political content, posting mainly science
Loc: Chur, Dresden, Lüneburg
Real-wildfire data at your fingertips 🌍 | Visualize global wildfire activity instantly 🔥 | Bushfire Map | #GeoINT #GeoAI| Currently in Beta
Hydrology • Remote Sensing • Mountains • Climate Justice • SDGs • Climate Change • Himalayas • Migration • WebGIS • Water Accounting
https://bio.link/praveenkalura
Indian Institute of Technology Roorkee
National Institute of Hydrology Roorkee
India
Demographer / Senior Researcher @dst.dk / Affiliate Member @oxforddemsci.bsky.social / Board @demografi.dk
✨ @datavizartskill.ikashnitsky.phd
📝 https://ikashnitsky.phd
😍 #demography #dataviz #rstats
🙌 #openscience #bibliometrics
🔗 https://bio.link/ikx
Wildlife Biologist that’s passionate about #rstats, #gis, the #web, and data driven land management.
Data analyst and data viz geek
Senior Lecturer in War Studies at the Swedish Defence University | Interventions, Conflict Delegation, Proxy Warfare, Civil Wars and US Foreign Policy.
🔥🗺️ Pyrogeographer.
🛰️🛩️🔥 #RemoteSensing of #Wildfire.
❤️🚒 Passionate about finding ways to help emergency responders.
📣 #SciComm
👩💻 https://www.kristaleewest.com/
📍 Colorado, USA
World's best cloud-native GIS
Software for a better world. All open source, all the time. Committed to transport with wheel counts of zero, two (preferred), or many (trains). urbananalyst.city, ropensci.org, github.com/mpadge