And now for something completely different…
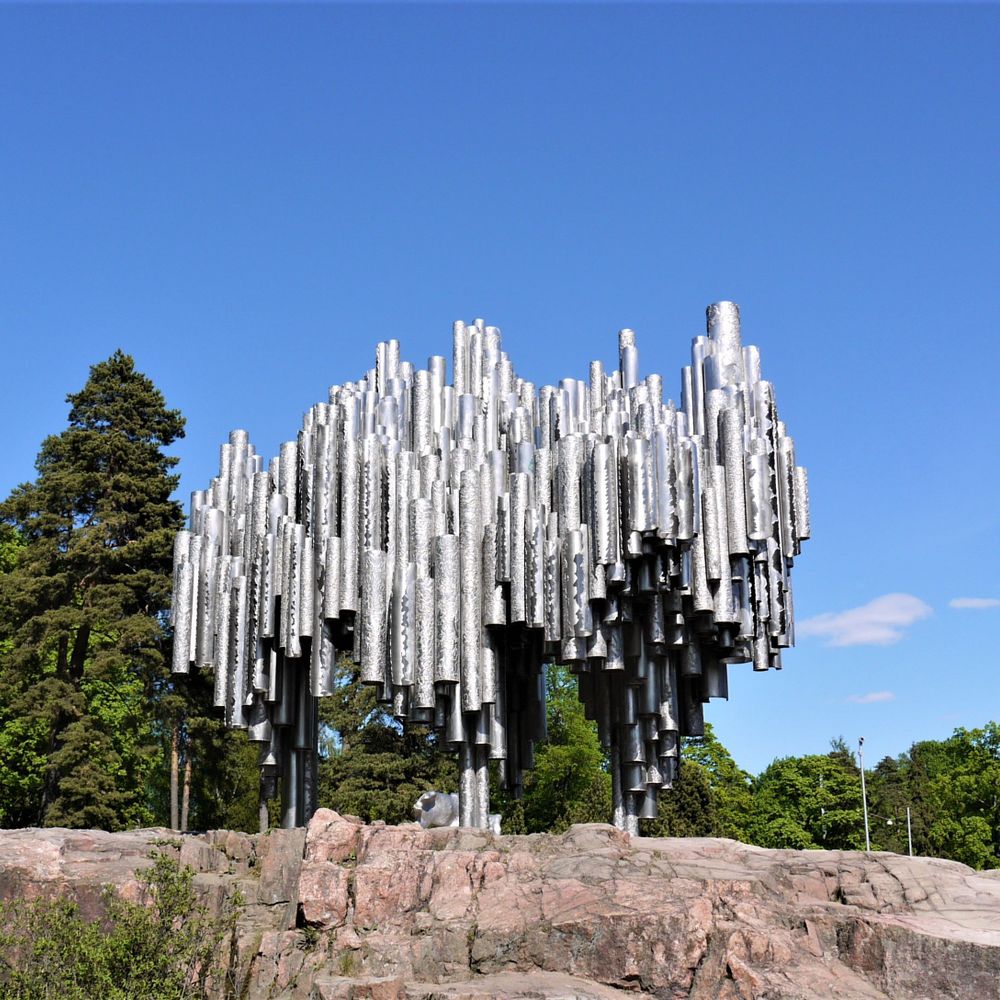
I like to take photographs. I used to post a lot of street art photos on Instagram (that I’m leaving for good before the year is over).
This one happened by accident. A raindrop fell on the lens of the iPhone camera. So no filters needed!
#VisitHelsinki
19.12.2024 21:00 — 👍 3 🔁 1 💬 0 📌 0
Sure, but I don't see this as an either/or type of situation. More as a both/and kind.
What using the pipe (in addition to the assignment arrow) gives me is the ability to decide what to assign and when.
Without the pipe, every step needs to be assigned and I've seen that lead to hairy situations.
15.12.2024 09:12 — 👍 0 🔁 0 💬 0 📌 0
Anyway, here's the only change you need to make to get that. Not a big change, after all:
Before:
...
select(color, hex)
...
After:
...
pull(hex)
...
15.12.2024 00:39 — 👍 0 🔁 0 💬 0 📌 0
Why return a tibble? Personal preference, I guess.
If I need to do something else, I’ll modify the code accordingly.
I’m more interested in showing what is possible instead of trying to nail the one true/right/correct/best way of doing a thing.
There are enough of those kinds of people around…
14.12.2024 23:31 — 👍 0 🔁 0 💬 1 📌 0
And the alternative? I’m genuinely curious. Because for me the hardest code to read is when there are multiple functions inside one another.
And that’s the world (Excel) I came from when I started to learn R in 2020 (I know, I’m still a relative newcomer). But still I prefer the pipe.
14.12.2024 23:02 — 👍 0 🔁 0 💬 1 📌 0
Not hating on data.table, but I am loving tidyverse.
And honestly, to me, clear and logical syntax is everything. Also, I'm not saying that tidyverse has gotten it right every time. But most of the times, yes.
ps. Ceci n'est pas une pipe... but yeah, pipes are part of the clear and logical syntax.
14.12.2024 22:38 — 👍 2 🔁 0 💬 1 📌 0

No new book chapter. But here's a function to turn color names into hex codes.
The image is missing:
library(tidyverse)
color_to_hex(c("cyan4", "blue"))
A tibble: 2 × 2
color hex
<chr> <chr>
cyan4 #008B8B
blue #0000FF
2 rows
#ggplot2
#DataViz
#Writing
#RStats
💙📚
📊
14.12.2024 22:15 — 👍 3 🔁 0 💬 1 📌 0

Writing ggplot2 extended continues...
The latest published (first version) chapter is about visualizing data summaries.
The {DataExplorer} package by Boxuan Cui is the main character of this one:
ggplot2-extended-book.com/data#sec-sum...
#ggplot2
#DataViz
#Writing
#RStats
💙📚
📊
08.12.2024 11:43 — 👍 10 🔁 0 💬 0 📌 0
The deep goal of bluesky is to decentralize the social internet so that every individual controls their experience of it rather than having it be controlled by 5 random billionaires. Everyone thinks they signed up for a demuskified twitter...we actually signed an exciting and bizarre experiment.
03.12.2024 16:05 — 👍 57845 🔁 6410 💬 1294 📌 461
I must say this as clearly as possible: if you have, in the last ten years, thought "I just don't get tech" or that you're "getting old" or "you're not technical," you are the victim - so much of the tech industry is now oriented around making you do stuff rather than doing stuff for you.
29.11.2024 19:34 — 👍 6399 🔁 1609 💬 153 📌 138
You are not "too old," you don't "just not get it." Things have stopped being made intuitively by default. You are the victim, you are being gaslit into believing you are deficient when using software made by companies that have failed you.
29.11.2024 19:36 — 👍 2383 🔁 315 💬 43 📌 26

I updated my GitHub profile! It was about time (the last update was from 2022) too...
By the way, the number of contributions in the past five years: 4 -> 15 -> 25 -> 64 -> 128
Will I make 256 contributions in 2025? Probably not, but it is crazy that the growth has been more or less 2x each year.
01.12.2024 23:24 — 👍 1 🔁 0 💬 0 📌 0

Analysis | Musk admits X throttles links as ‘news influencers’ take over
Hard times for the humble hyperlink and those who depend on it.
Musk admitted X throttles links, and Threads is only a little better. But social media's quiet war on links has been going on for years. I wrote about how big tech has been draining the open web's lifeblood and giving us "news influencers" instead of the news. www.washingtonpost.com/politics/202...
27.11.2024 14:24 — 👍 3921 🔁 1051 💬 97 📌 95

Planning next year with my dearest Helsinki Data Week crew @jkor.bsky.social, @eevamaija.bsky.social & Säde Haveri!
Anyway, what are your plans for next fall? 🤓
www.helsinkidataweek.com
#HelsinkiDataWeek
#VisitHelsinki
#VisitFinland
#HDW2025
30.11.2024 18:44 — 👍 6 🔁 0 💬 1 📌 0
Actually, I think I changed my mind about DataExplorer. The part of it that deals with EDA is among the more useful visual summarization tools out there, it seems. Plus I'm experiencing some annoying problems with gt + gtExtras (especially the gt_plt_summary() function)...
28.11.2024 17:11 — 👍 0 🔁 0 💬 0 📌 0
ggquickeda: this is the EDA app I was already going to write about
trelliscopejs: will be featured in the Interactive Plots section
ExPanDaR: this was new to me, but looks promising! Might find its way to the Automated EDA app chapter...
27.11.2024 23:00 — 👍 0 🔁 0 💬 1 📌 0
GGally: this is one of the packages I will showcase in the Visualizing data subchapter
ggforce: this will be featured heavily in the book, but not in the EDA section
corrplot: not a ggplot2 extension, but I'm featuring ggcorrplot instead
27.11.2024 23:00 — 👍 0 🔁 0 💬 1 📌 0
naniar: as mentioned, it was mentioned in the latest published chapter of the book
explorer: another new one to me, looks more like a general EDA tool than something specifically for visualizations
DataExplorer: similar to tidyplot, DataExplorer seems more of a Helper than an EDA tool to me
27.11.2024 22:59 — 👍 0 🔁 0 💬 1 📌 0
@ercbk.bsky.social, here are my thoughts about the packages you mentioned so far:
tinyplot: not a ggplot2 extension as you mentioned, looks cool otherwise
tidyplot: this was new to me, but I would put it under the Shortcuts > Helpers section of the book instead of EDA
27.11.2024 22:57 — 👍 0 🔁 0 💬 1 📌 0

ggplot2 extended continues...
The latest published (first version) chapter is about visualizing missing values in your data set.
The {naniar} package by Nicholas Tierney et al. is the main character of this one:
ggplot2-extended-book.com/data#sec-mis...
#ggplot2
#DataViz
#Writing
#RStats
💙📚
📊
27.11.2024 22:01 — 👍 7 🔁 3 💬 1 📌 0
ggplot2 extended - 2 Data
@ercbk.bsky.social, I just finished writing the first version of 2.2.1 Missing values. Not surprisingly naniar is the main package I write about: ggplot2-extended-book.com/data#sec-mis...
27.11.2024 21:37 — 👍 2 🔁 0 💬 1 📌 0

LinkedIn prompts us to "Start a post, try writing with AI".
How about "Start a post, try writing without AI"? I know I would be much happier if my fellow LinkedIn users did that instead.
Making yourself sound like a bot isn't doing you any favors in the already competitive job market.
#Facts
#AI
27.11.2024 21:23 — 👍 2 🔁 0 💬 0 📌 0

Dataviz bingo card with squares such as "used a pie on the table as a visual aid" and "so you do computer stuff".
Ready for a holiday challenge that’s more fun than explaining your job? Grab our 📊 Data Viz Holiday Bingo card and see if you can spot all the classic family reactions to what you do for a living. Post your cards and maybe even win bragging rights at the dinner table!
@datavizsociety.bsky.social
27.11.2024 17:25 — 👍 47 🔁 13 💬 6 📌 3
Thank you, @ercbk.bsky.social! Most of these were already on my radar, but I’ll check the complete list tomorrow to see if there were some I’ve missed previously. Much appreciated!
24.11.2024 00:29 — 👍 1 🔁 0 💬 1 📌 0

I'm continuing to write ggplot2 extended, the book. This week I'm writing about ggplot2 extensions that help with the EDA process.
What are your favorite ggplot2-related EDA tools?
Let me know in the comments!
ggplot2-extended-book.com/data#sec-exp...
#ggplot2
#DataViz
#Writing
#RStats
💙📚
📊
22.11.2024 20:58 — 👍 8 🔁 2 💬 1 📌 0
Thank you! The only other chapter that has text in it is Data. Even that is only half ready.
I know there are pros and cons in this building-in-public thing. But I’m hoping there is this positive pressure to get things done when there are people maybe even waiting for a certain chapter to be done.
17.11.2024 19:58 — 👍 1 🔁 0 💬 1 📌 0

What's the purpose and scope of ggplot2 extended? What will you learn by reading the book (when it's done)? What won't you and why? Who is the book for? Who am I to write it? What next?
The answers can be found here:
ggplot2-extended-book.com/introduction
#ggplot2
#DataViz
#Writing
#RStats
💙📚
📊
17.11.2024 10:35 — 👍 14 🔁 2 💬 2 📌 1

THE 2024 MAD LANDSCAPE X WHERE'S WALDO? - The crossover you didn't know you needed! Think you can spot the familiar friendly fellow with a striped shirt?
Thank you and sorry Matt Turck! I'm a big fan of the original concept.
#FunnyBecauseItsTrue
#FridayMemes
#MAD2024
#DataBS
#Satire
15.11.2024 16:42 — 👍 4 🔁 0 💬 1 📌 0
I haven’t pronounced it like that, @libbyheeren.bsky.social, but after this I will!
15.11.2024 12:06 — 👍 1 🔁 0 💬 0 📌 0
More time for coffee and donuts?
14.11.2024 17:23 — 👍 2 🔁 0 💬 1 📌 0
she/her, mostly OSS big data (Spark, Dask, Ray, and friends). I ❤️☕️🛵. I don't represent my employer. Live @ http://twitch.tv/holdenkarau , http://tech.lgbt/@holden , Twitter was @holdenkarau
CDO, Podcast Host, Wannabe Landscape Photographer, Hodler
Developer Advocacy & Labs at Neo4j.
Happy dad of 3 girls ADHD GraphAddict JavaChampion
Code http://github.com/jexp
Words http://medium.com/@mesirii
Network http://de.linkedin.com/in/jexpde
A technologist who specializes in AI and machine learning and is passionate about innovating for a better future. Views are my own.
GH: https://github.com/yulleyi
Art substack: yulle.substack.com
LI: https://www.linkedin.com/in/michelleyulleyi
Information architecture • systems thinking •
Software Developer
lyonwj.com
R nerd, developer of the {crosstable} package.
Biostatistician (PharmD, PhD) in clinical cancer research.
https://github.com/DanChaltiel
(formerly @limeygrl on Twitter)
SVP of #Education at NORC at the University of Chicago | Transforming education one evaluation at a time! #bluecollarscholar #firstgen | chaotic good
Assistant professor of statistics/data science at Wilfrid Laurier University
Data Scientist in Ag 🌱 Environmentalist 🦥 Boba drinker🧋Bestselling Author 📚 of "Interpretable Machine Learning with Python" & upcoming "𝘿𝙄𝙔 𝘼𝙄" 🇨🇷→🇺🇸
"Just a regular human guy"
Insisting I'm here for Epidemiology, Public Health, and Code related content. Actually almost exclusively engaging mostly unrelated content.
New York 📍
Bio: https://tinyurl.com/DEJohns
Data Analyst, AI enthusiasts and also #SocialPolicy researcher
#R #rstats #CSS #Sociology #DataJournalism
dataviz and statistics | https://jdonland.github.io | views are my own
❤️📊 | 🗣️DE|EN|FR | #rstats | #econsky
Writing my second book, on the Meta Grid: Fundamentals of Metadata Management (O’Reilly, 2025)
Email salesman at Platformer.news and podcast co-host at Hard Fork.
NYT tech columnist, Hard Fork co-host, best at 0.8x speed
Life in Helsinki, Finland
Suomi 🇫🇮💙❄️