8 1/2 is the most overrated work of art in any medium ever made.
08.12.2025 03:48 — 👍 0 🔁 0 💬 0 📌 0
Can you guess which basic #dataviz errors this graphic features?
Why in the world wouldn't the colour mapping be the same across the four donuts?
And why not a 100% stacked bar chart instead of donuts?
Just like movies about making movies, data graphics about making data graphics are never good.
03.12.2025 21:07 — 👍 2 🔁 0 💬 1 📌 1

Screen-shot of wirecutter page with a big titel that says "The Best Bar Carts"
I'm not proud to tell you that I clicked this Wirecutter article fully believing it was about the 📊 Best Bar Charts.
11.11.2025 23:39 — 👍 52 🔁 3 💬 2 📌 1
If you're looking for more on this sort of thing, what we did here was "enumerate non-decreasing sequences".
A lot of these elementary enumeration problems hinge on recursion: a non-decreasing sequence of length n+m is comprised of one of length m glued to the end of one of length n.
28.10.2025 15:38 — 👍 2 🔁 0 💬 1 📌 0
When we add the (n + 1)-th variable, we need to know how many times the nth variable took on each of its possible values, which can be found in the nth diagonal of Pascal's triangle. (Prove by induction somehow.)
I think that solves the problem.
28.10.2025 05:09 — 👍 2 🔁 0 💬 1 📌 0
For the case with just two variables 2 ≤ a ≤ b ≤ 6, there are (7 - a) choices for b once a is fixed, and the sum over a from 2 to 6 of (7 - a) is 15.
Can you do a similar trick for 2 ≤ a ≤ b ≤ c ≤ 6? Can you get a recurrence relation by writing the answer for this case in terms of the previous one?
28.10.2025 04:42 — 👍 1 🔁 0 💬 1 📌 0
Are you sure there are only 15?
28.10.2025 04:23 — 👍 1 🔁 0 💬 1 📌 0

Figure 2 from the linked article.

Abstract of the linked article
New paper for anyone working with data:
Better data viz - for free, in few clicks.
Below, all N = 111, M = 0.04, SD = 0.27.
One-sided t-tests vs. 0 yield: t(110) = 1.67, p = .049.
Use raincloud plots. Or risk wrong conclusions!
Plot w/ @jaspstats.bsky.social today!
🧪 📊 #PsychSciSky #StatsSky
🧵👇
29.08.2025 14:10 — 👍 72 🔁 20 💬 7 📌 1
Will Posit's recent transition to hyping slop generation endanger its B Corporation status? Surely you can't be serious about climate targets while shilling this stuff, right?
29.08.2025 02:48 — 👍 0 🔁 0 💬 0 📌 0
Does this company only have "AI" in its name for marketing reasons, or is it actually engaged in slop generation?
20.08.2025 15:32 — 👍 0 🔁 0 💬 1 📌 0
The plot on the right is exactly what I had in mind!
18.08.2025 12:42 — 👍 1 🔁 0 💬 0 📌 0
Can you superimpose the exact and smoothed plots with differences in lighter grey?
Maybe just plotting a smoothed line on top would be more straightforward, I suppose.
17.08.2025 19:59 — 👍 0 🔁 0 💬 1 📌 0
Also formalized the frequentist interpretation of probability.
05.08.2025 22:56 — 👍 0 🔁 0 💬 0 📌 0
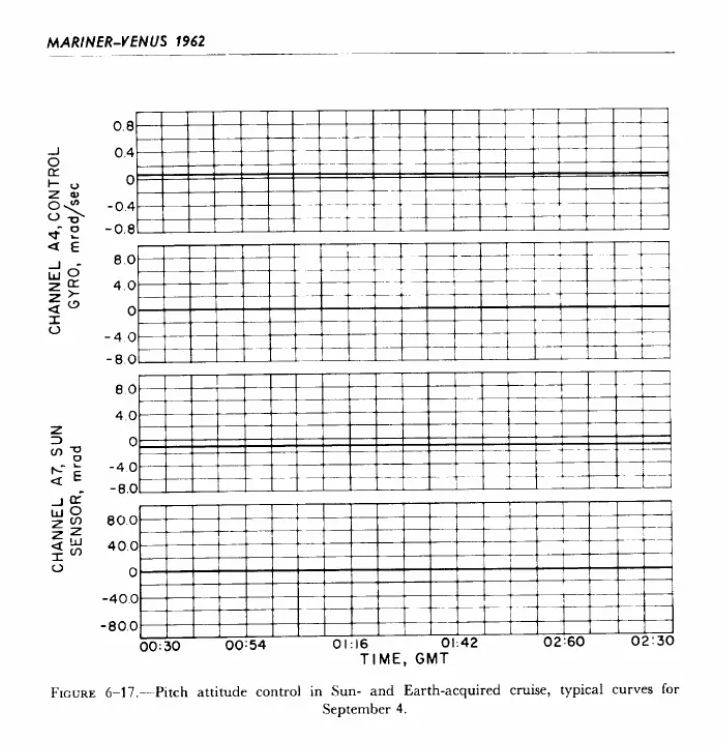
One of many line graphs in the NASA Mariner-Venus Report from 1962. Due to the rather black and bold and many grid lines, the straight lines that show the results (which are also black) are almost invisible.
Find the data 🧐🤓
#dataviz #datatoinkratio
25.07.2025 11:37 — 👍 16 🔁 2 💬 3 📌 0
Would the "The Lady Tasting Tea" be too breezy?
22.07.2025 03:54 — 👍 2 🔁 0 💬 1 📌 0
Not certain. I don't want a facsimile edition but other than that I'm not too picky.
18.07.2025 21:58 — 👍 0 🔁 0 💬 0 📌 0

Embarrassing. Why not just train a slop generator on all the conference submissions and then skip actually running it?
17.07.2025 17:29 — 👍 2 🔁 0 💬 0 📌 0
Maybe I'm too ggplot2-brained, but I wouldn't have guessed that "make one line in this chart dashed and the rest solid" is advanced!
17.07.2025 17:28 — 👍 1 🔁 0 💬 0 📌 0
Every time I can't figure out how to get what I want, the solution always seems to be some zany kludge.
17.07.2025 15:17 — 👍 0 🔁 0 💬 1 📌 0
My struggles with Tableau 📊 seem to boil down to two issues:
1. Too little control over the aesthetic mapping. (E.g. cannot map to position.)
2. Dimensions and measures are treated radically differently (e.g by filtering) in ways that are unintuitive and/or just never what one would want.
17.07.2025 15:05 — 👍 2 🔁 0 💬 2 📌 0
I've been on the hunt for a copy of this, but it seems scarcer than his other book, "Graphic Methods for Presenting Facts".
17.07.2025 12:51 — 👍 0 🔁 0 💬 1 📌 0
Watch the seismic waves from today's magnitude 7.3 Alaska earthquake ripple across seismic stations in North America.
More ➡️ loom.ly/kaJp5I0
17.07.2025 03:26 — 👍 3239 🔁 906 💬 124 📌 114
(After live-generating 80 lines of SQL with five paragraphs of pre-written prompts)
"This would have taken hours!"
Maybe for *you*.
15.07.2025 17:48 — 👍 0 🔁 0 💬 0 📌 0
I'm sorry, but if the image slop generator you used for your slides can't produce a world map with South America in it, I'm not buying your data engineering pipeline slop generator.
Pretend tools for pretend work.
15.07.2025 17:45 — 👍 1 🔁 0 💬 1 📌 0
Plot by distance to an ocean port and you get a different set of outliers.
13.07.2025 19:25 — 👍 2 🔁 0 💬 0 📌 0
I wouldn't want to be associated with that creep either, but I think if you open-source your #dataviz 📊 theme, you have to accept the possibility of creeps using it.
In any case, I'd never assume that two chart authors were associated just because they use the same style, and you shouldn't either.
05.07.2025 22:44 — 👍 6 🔁 1 💬 0 📌 0

Vertical axis trickery in Bigalke et al. (2021), via dynomight.net/blue-light/. 📊
04.07.2025 12:51 — 👍 3 🔁 0 💬 0 📌 0
The history of Venn diagrams | Statistical Modeling, Causal Inference, and Social Science
A #dataviz adjacent post from Andrew Gelman about which Venn diagrams can be drawn with rotational symmetry. The same Venn after whom the diagrams are named originated the frequency interpretation of probabilities, incidentally.
01.07.2025 18:01 — 👍 1 🔁 0 💬 0 📌 0
(At least for that aspect ratio.)
30.06.2025 16:09 — 👍 0 🔁 0 💬 0 📌 0
data scientist studying how kids learn to speak, dad, jump roper, bayesian, tjmahr.com
🗣️#RStats #DataScience #Dogs
@dslc.io Executive Director
#TidyTuesday poster
🔗http://linkedin.com/in/jonthegeek
🔗http://github.com/jonthegeek
Prof. Most tweets about R. “Polisci, it’s all about what’s going on.”
http://arelbundock.com
Linguist at the University of Bergen 🇳🇴
#SignLanguages, #linguistics, #RStats & #dataviz
#dataanalysis #rstats #dataviz
Senior Data Analyst, DTU Food
Views mine
www.gregdubrow.io
www.linkedin.com/in/dubrowg/
https://medium.com/the-polymaths-dilemma
Statistics expert and writer, formerly of the House of Commons Library. New book 'Sum of Us' out now 🙌📊 Also author of critically acclaimed 'Bad Data' (2022).
Scientist and software developer. Creator of tidyplots.org. Website jbengler.de.
Senior Visual Data Journalist at @zeit.de. Co-founder and former CTO of @datawrapper.de. Former @nytimes.com graphics editor #datajournalism #graphics #maps #cartography (he/him)
dataviz and information graphics at ELTE MMI
portfolio: https://attilabatorfy.com/
head of visual journalism project: https://atlo.team/
book order: https://eltebook.hu/batorfy-attila-adatvizualizacio
blog: https://attilabatorfy.substack.com/
Unparalleled reporting and commentary on politics and culture, plus humor and cartoons, fiction and poetry. Get our Daily newsletter: http://nyer.cm/gtI6pVM
Follow The New Yorker’s writers and contributors: https://go.bsky.app/Gh5bFwS
Assoc. Dir., Insights and Analytics at Temple University
Managing Editor of Nightingale, the Journal of the Data Viz Society 📊
https://www.wcareri.com
Paleontologist. Artiodactyl enthusiast. Co-host of the podcast Weird & Dead. Clothing and art at www.Geopetalfabric.com
Visualizing Knowledge – a conference, workshop, and showcase on data visualization and information design. #VK25 will be held on June 6th 2025.
https://linktr.ee/vizknowledge
Helps making useful information out of data.
Loves and promotes #OpenData.
Open to requests but no promises on the results.
In English and Nederlandsch.
https://datagraver.com
Data reporter at Bloomberg News. Usually writing about transportation and cities. Opinions are my cat's. Clips and contact info at agordon.me. Signal: awgordon dot 89
#rstats #ggblanket
https://github.com/davidhodge931/ggblanket
🧮 Statistics & data science
💊 Clinical trials & R&D & Epidemiology
💻 R enthusiast
👩💻 Stats @ loyal.com
https://jesslgraves.github.io
Freelance data visualization designer and #D3js developer based in Mensk, Belarus. Open for hire worldwide #datavis @ yanouski.com
Mostly here for charts and maps 💁📊 especially about weather and space
Montréal ⚜️🌹🌲🌷☘️
stevecarufel.com (needs an update)
github.com/datacarvel
Website: https://stevenponce.netlify.app/
GitHub: http://github.com/poncest/
LinkedIn: http://linkedin.com/in/stevenponce/